
最新行情速看
785 Posts

最新行情速看
Report
Block User
Open Trade
Occasional Trader
5.6 Years
1 Following
61 Followers
70 Liked
Posts
Portfolio
All
Quotes
Videos
·
--
【See the Rise】
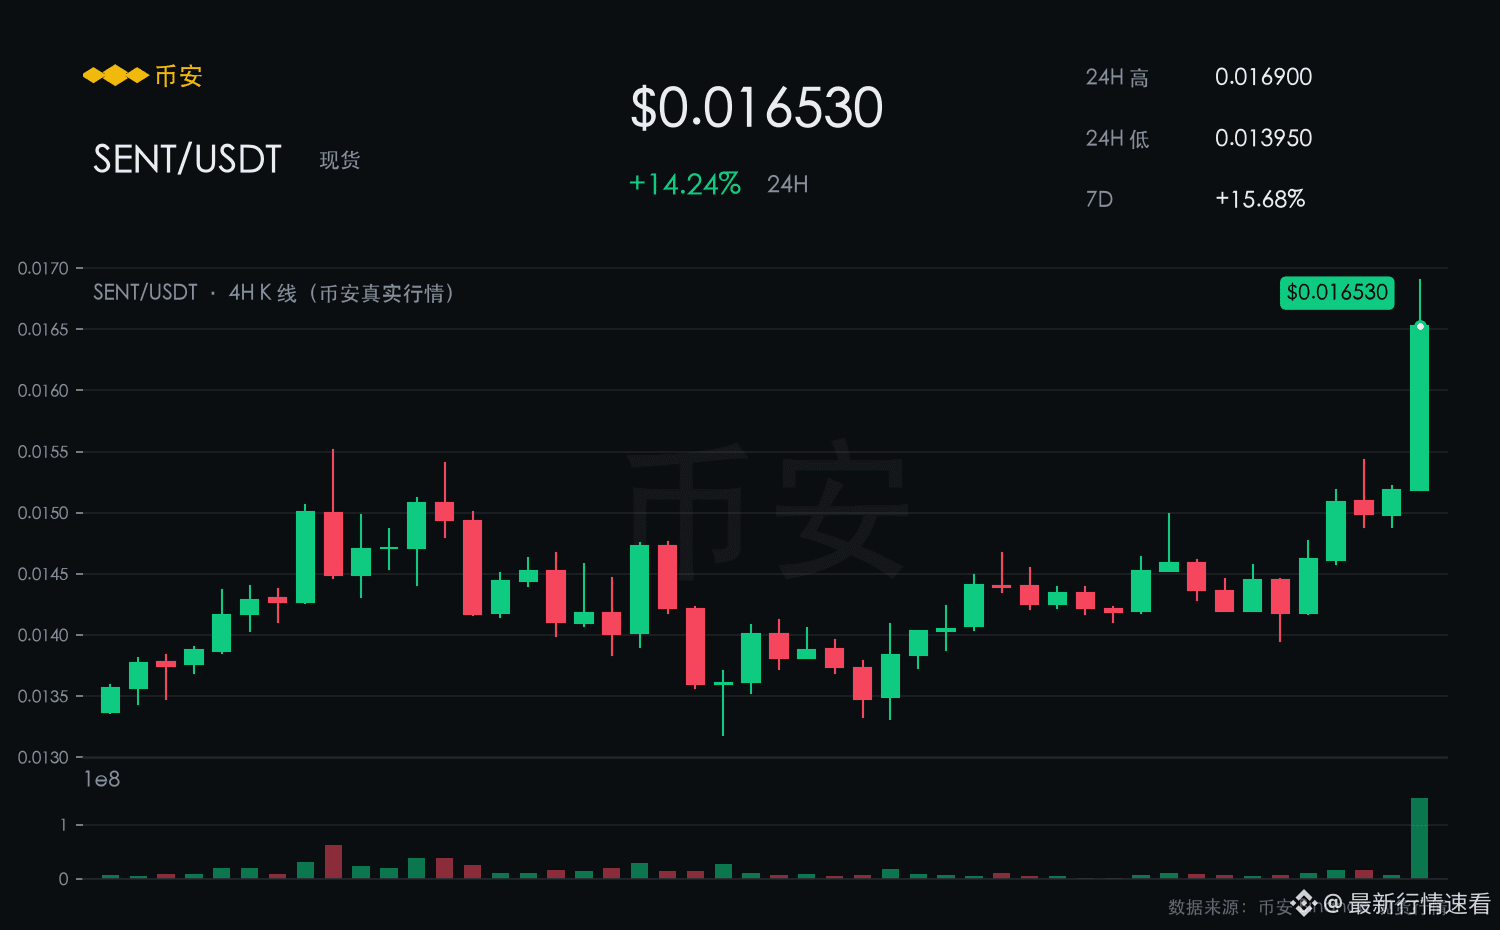
SENT spot report 0.0165, up 14.24% in 24 hours, up 15.68% over 7 days, with an intraday range of 0.0140–0.0169.
In a market where it underperforms when others rise and stays put, SENT goes the opposite way—if the last 24 hours are green, that’s the attitude.
As long as 0.0140 isn’t lost, the current pullback counts as a strong consolidation.
Short-term bias is bullish.
【Bullish Reasons】
A single-day gain of 14.24% isn’t outrageous, but paired with the 7-day 15.68% slope, the trend is right.
Near-term resistance is at 0.0169; if volume breaks through, then follow along.
$SENT #SENT
【See the Rise】
SENT spot report 0.0165, up 14.24% in 24 hours, up 15.68% over 7 days, with an intraday range of 0.0140–0.0169.
In a market where it underperforms when others rise and stays put, SENT goes the opposite way—if the last 24 hours are green, that’s the attitude.
As long as 0.0140 isn’t lost, the current pullback counts as a strong consolidation.
Short-term bias is bullish.
【Bullish Reasons】
A single-day gain of 14.24% isn’t outrageous, but paired with the 7-day 15.68% slope, the trend is right.
Near-term resistance is at 0.0169; if volume breaks through, then follow along.
$SENT #SENT
SENT spot report 0.0165, up 14.24% in 24 hours, up 15.68% over 7 days, with an intraday range of 0.0140–0.0169.
In a market where it underperforms when others rise and stays put, SENT goes the opposite way—if the last 24 hours are green, that’s the attitude.
As long as 0.0140 isn’t lost, the current pullback counts as a strong consolidation.
Short-term bias is bullish.
【Bullish Reasons】
A single-day gain of 14.24% isn’t outrageous, but paired with the 7-day 15.68% slope, the trend is right.
Near-term resistance is at 0.0169; if volume breaks through, then follow along.
$SENT #SENT
1
·
--
【Watch Decline】
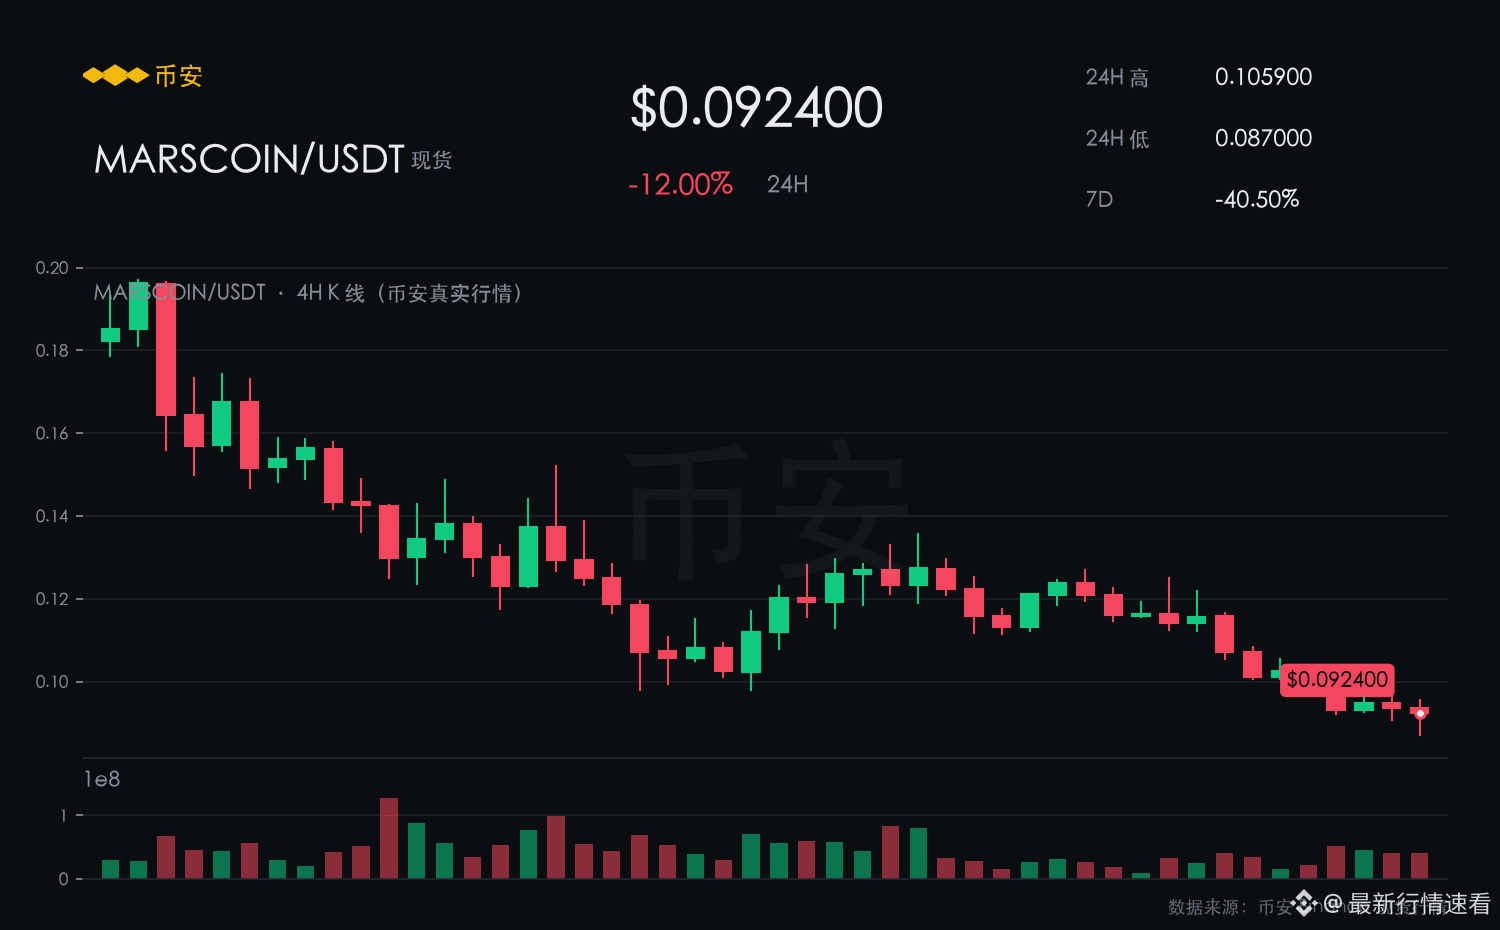
MARSCOIN is currently reported at 0.0925. It is down 11.99% over the past 24 hours and still down 40.44% over the last 7 days, with an intraday range of 0.0870–0.1059.
MARSCOIN intraday range: 0.0870–0.1059. The rebound has lacked volume, and the 7-day candles are still closing red.
The rebound is on shrinking volume, while the down move is on increasing volume; the volume-price structure is bearish.
In the short term, it is likely to be bearish.
【Bearish Rationale】
The 11.99% drop over the last 24 hours indicates that aggressive sell pressure has not exhausted.
Unless the rebound breaks above 0.1059 with volume, it is still treated as weak consolidation.
$MARSCOIN #MARSCOIN
【Watch Decline】
MARSCOIN is currently reported at 0.0925. It is down 11.99% over the past 24 hours and still down 40.44% over the last 7 days, with an intraday range of 0.0870–0.1059.
MARSCOIN intraday range: 0.0870–0.1059. The rebound has lacked volume, and the 7-day candles are still closing red.
The rebound is on shrinking volume, while the down move is on increasing volume; the volume-price structure is bearish.
In the short term, it is likely to be bearish.
【Bearish Rationale】
The 11.99% drop over the last 24 hours indicates that aggressive sell pressure has not exhausted.
Unless the rebound breaks above 0.1059 with volume, it is still treated as weak consolidation.
$MARSCOIN #MARSCOIN
MARSCOIN is currently reported at 0.0925. It is down 11.99% over the past 24 hours and still down 40.44% over the last 7 days, with an intraday range of 0.0870–0.1059.
MARSCOIN intraday range: 0.0870–0.1059. The rebound has lacked volume, and the 7-day candles are still closing red.
The rebound is on shrinking volume, while the down move is on increasing volume; the volume-price structure is bearish.
In the short term, it is likely to be bearish.
【Bearish Rationale】
The 11.99% drop over the last 24 hours indicates that aggressive sell pressure has not exhausted.
Unless the rebound breaks above 0.1059 with volume, it is still treated as weak consolidation.
$MARSCOIN #MARSCOIN
19
·
--
【See Decline】
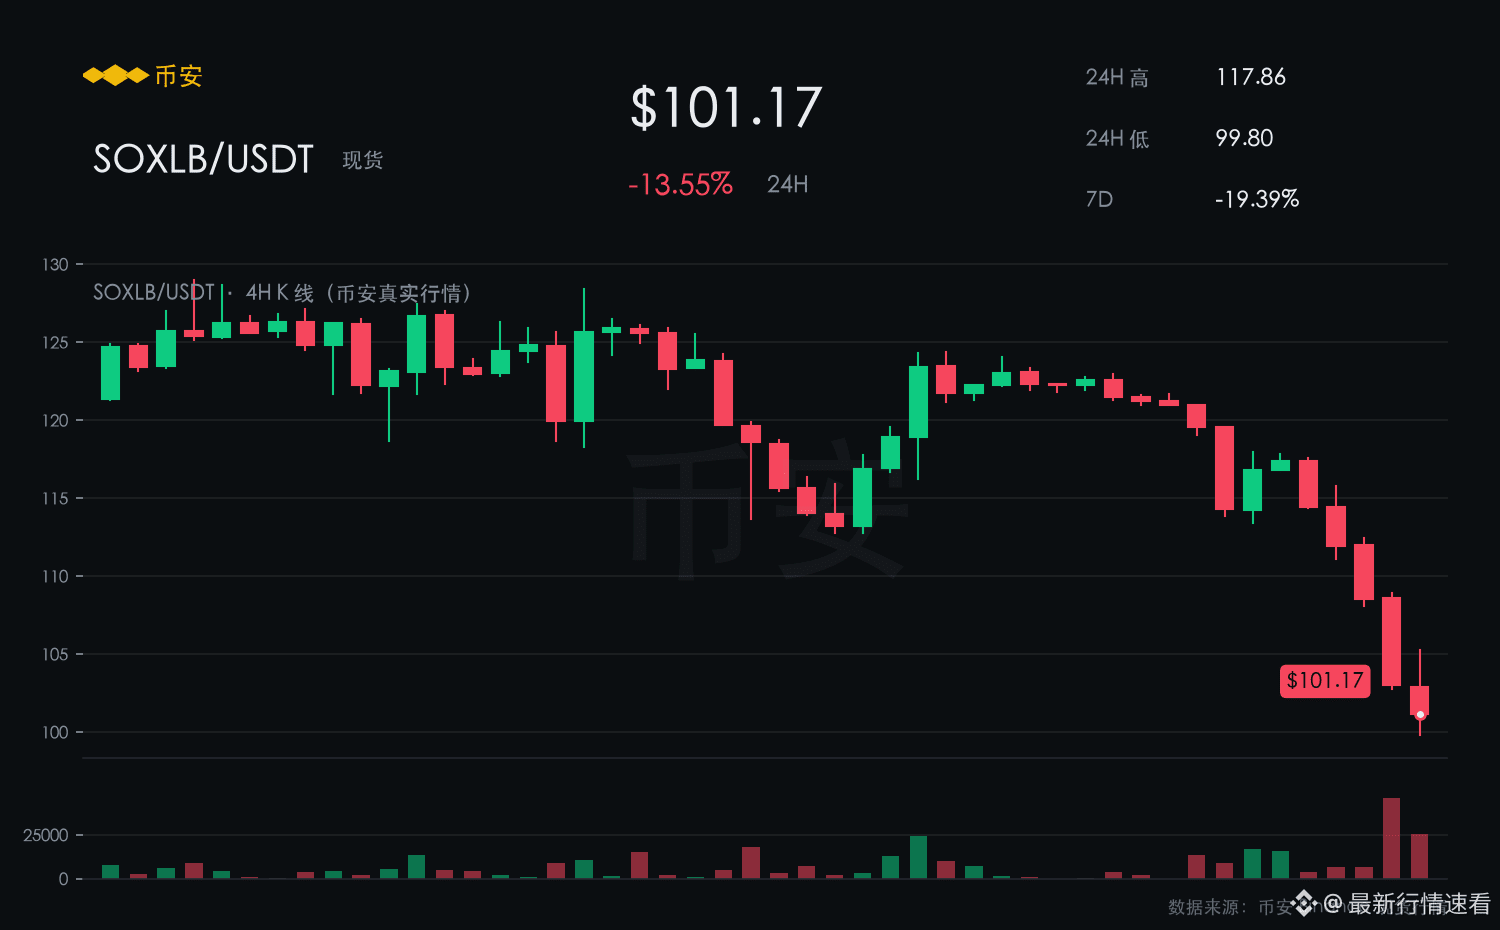
SOXLB is currently reported at 101.11, down 13.60% over the past 24 hours; still down 19.44% over the past 7 days, with an intraday range of 99.800–117.86.
SOXLB’s intraday range is 99.800–117.86; the rebound lacks volume, and the 7-day candles are still closing lower.
The support at 99.800 hasn’t been tested with real money, so confidence is insufficient.
In the short term, it leans bearish.
【Reasons for Bearish View】
Catching up after a trend gap hurts the most; SOXLB’s 7-day decline of 19.44% hasn’t fully played out yet.
As long as the rebound does not build volume above 117.86, treat it as a weak consolidation.
$SOXLB #SOXLB
【See Decline】
SOXLB is currently reported at 101.11, down 13.60% over the past 24 hours; still down 19.44% over the past 7 days, with an intraday range of 99.800–117.86.
SOXLB’s intraday range is 99.800–117.86; the rebound lacks volume, and the 7-day candles are still closing lower.
The support at 99.800 hasn’t been tested with real money, so confidence is insufficient.
In the short term, it leans bearish.
【Reasons for Bearish View】
Catching up after a trend gap hurts the most; SOXLB’s 7-day decline of 19.44% hasn’t fully played out yet.
As long as the rebound does not build volume above 117.86, treat it as a weak consolidation.
$SOXLB #SOXLB
SOXLB is currently reported at 101.11, down 13.60% over the past 24 hours; still down 19.44% over the past 7 days, with an intraday range of 99.800–117.86.
SOXLB’s intraday range is 99.800–117.86; the rebound lacks volume, and the 7-day candles are still closing lower.
The support at 99.800 hasn’t been tested with real money, so confidence is insufficient.
In the short term, it leans bearish.
【Reasons for Bearish View】
Catching up after a trend gap hurts the most; SOXLB’s 7-day decline of 19.44% hasn’t fully played out yet.
As long as the rebound does not build volume above 117.86, treat it as a weak consolidation.
$SOXLB #SOXLB
4
·
--
【See Drop】
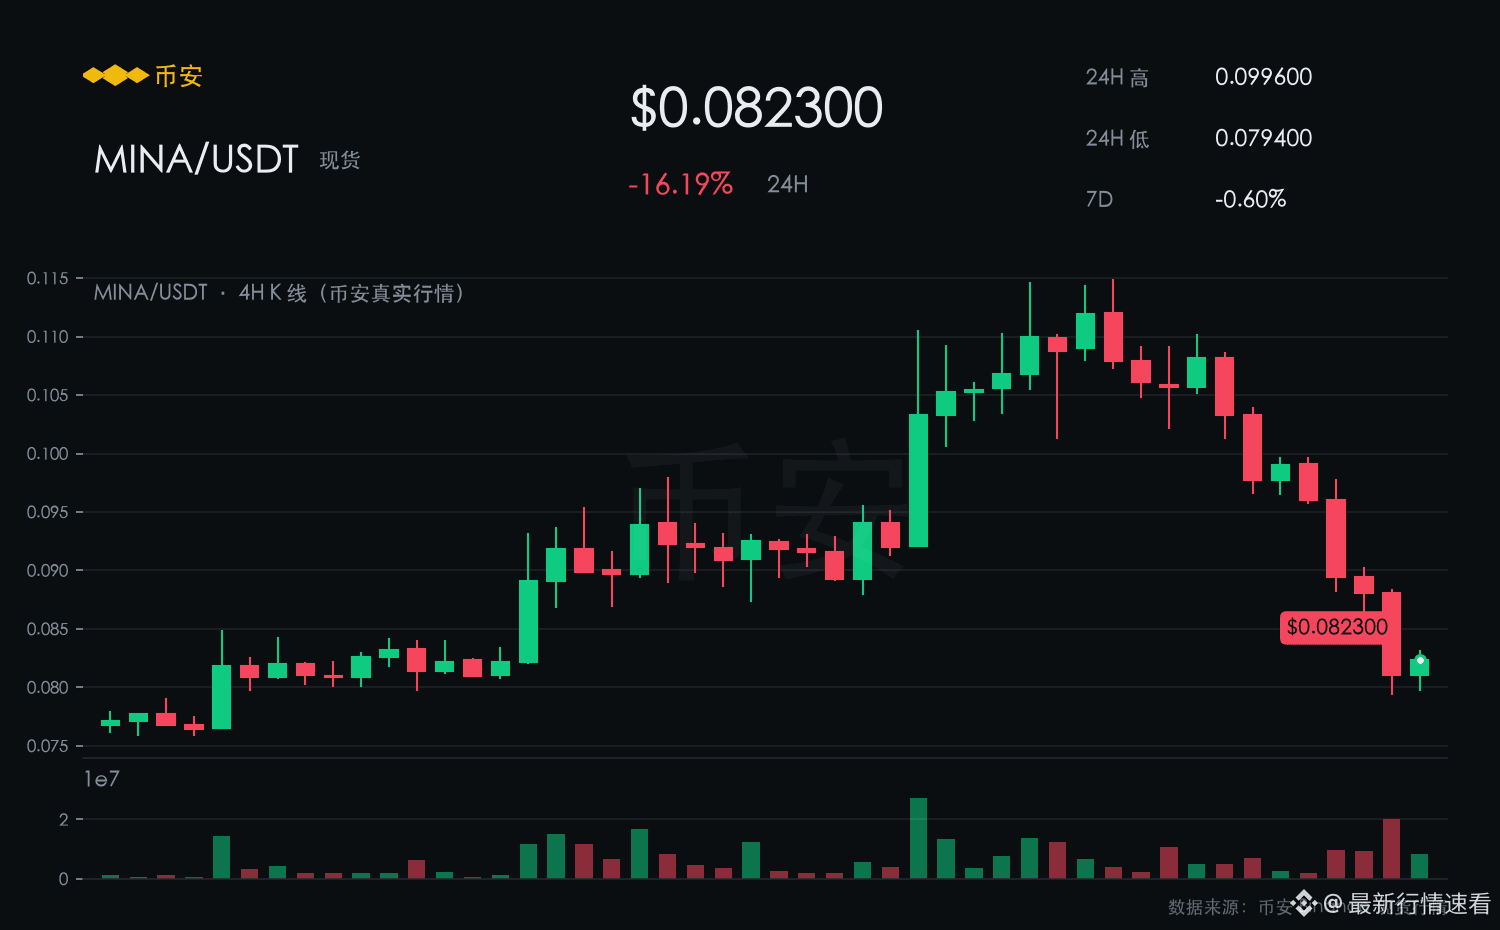
MINA is currently quoted at 0.0823, down 16.19% over the past 24 hours, still down 0.60% over the past 7 days, with intraday range 0.0794–0.0996.
MINA’s intraday range is 0.0794–0.0996; rebounds have low volume, and the 7-day trendline is still closing in the red.
The support at 0.0794 has not been tested with real money yet, so confidence is insufficient.
In the short term, the bias is bearish.
【Reasons for Bearish Outlook】
The 24-hour drop of 16.19% indicates that aggressive sell orders have not yet exhausted.
Once 0.0794 breaks, it will continue to search for support lower down.
$MINA #MINA
【See Drop】
MINA is currently quoted at 0.0823, down 16.19% over the past 24 hours, still down 0.60% over the past 7 days, with intraday range 0.0794–0.0996.
MINA’s intraday range is 0.0794–0.0996; rebounds have low volume, and the 7-day trendline is still closing in the red.
The support at 0.0794 has not been tested with real money yet, so confidence is insufficient.
In the short term, the bias is bearish.
【Reasons for Bearish Outlook】
The 24-hour drop of 16.19% indicates that aggressive sell orders have not yet exhausted.
Once 0.0794 breaks, it will continue to search for support lower down.
$MINA #MINA
MINA is currently quoted at 0.0823, down 16.19% over the past 24 hours, still down 0.60% over the past 7 days, with intraday range 0.0794–0.0996.
MINA’s intraday range is 0.0794–0.0996; rebounds have low volume, and the 7-day trendline is still closing in the red.
The support at 0.0794 has not been tested with real money yet, so confidence is insufficient.
In the short term, the bias is bearish.
【Reasons for Bearish Outlook】
The 24-hour drop of 16.19% indicates that aggressive sell orders have not yet exhausted.
Once 0.0794 breaks, it will continue to search for support lower down.
$MINA #MINA
3
·
--
【Look Down】
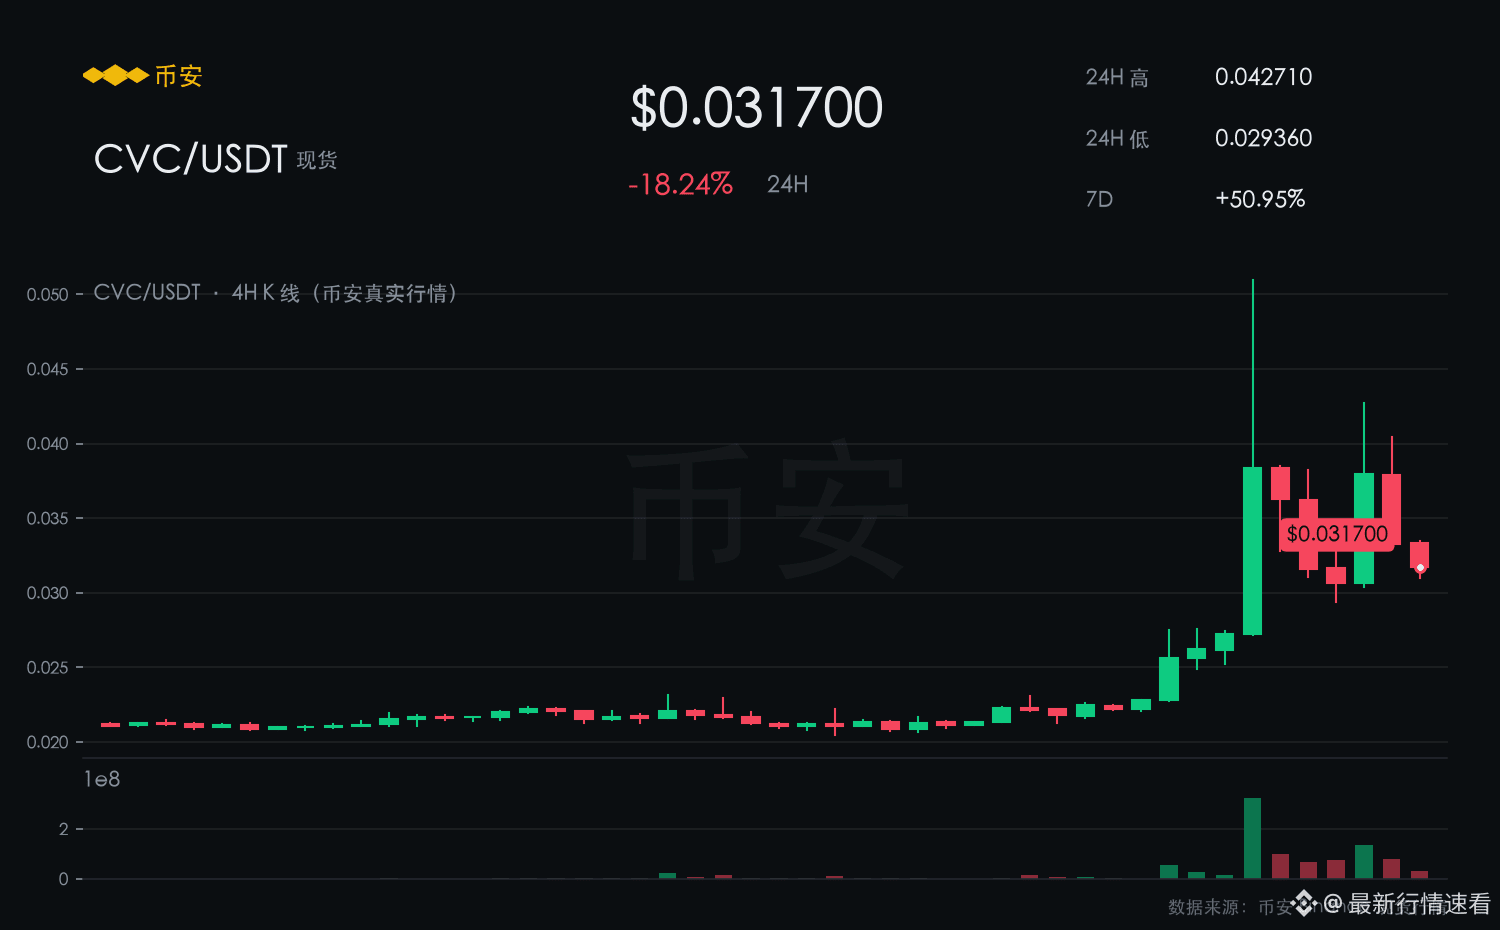
CVC spot price is 0.0317, down 18.32% in the last 24 hours, still down 50.95% over the past 7 days, with an intraday range of 0.0294–0.0427.
CVC is down 18.32% over the last 24 hours; when it rebounds to around 0.0427, it gets pushed back down. There is a high density of trapped orders above.
The rebound is on lower volume while the decline is on higher volume—volume-price structure is bearish.
In the short term, it leans bearish.
【Reasons for Bearish View】
Catching up laggards is the most painful; CVC’s 7-day drop of 50.95% hasn’t flushed out yet.
Unless the rebound comes with strong volume and breaks above 0.0427, treat it as weak consolidation.
$CVC #CVC
【Look Down】
CVC spot price is 0.0317, down 18.32% in the last 24 hours, still down 50.95% over the past 7 days, with an intraday range of 0.0294–0.0427.
CVC is down 18.32% over the last 24 hours; when it rebounds to around 0.0427, it gets pushed back down. There is a high density of trapped orders above.
The rebound is on lower volume while the decline is on higher volume—volume-price structure is bearish.
In the short term, it leans bearish.
【Reasons for Bearish View】
Catching up laggards is the most painful; CVC’s 7-day drop of 50.95% hasn’t flushed out yet.
Unless the rebound comes with strong volume and breaks above 0.0427, treat it as weak consolidation.
$CVC #CVC
CVC spot price is 0.0317, down 18.32% in the last 24 hours, still down 50.95% over the past 7 days, with an intraday range of 0.0294–0.0427.
CVC is down 18.32% over the last 24 hours; when it rebounds to around 0.0427, it gets pushed back down. There is a high density of trapped orders above.
The rebound is on lower volume while the decline is on higher volume—volume-price structure is bearish.
In the short term, it leans bearish.
【Reasons for Bearish View】
Catching up laggards is the most painful; CVC’s 7-day drop of 50.95% hasn’t flushed out yet.
Unless the rebound comes with strong volume and breaks above 0.0427, treat it as weak consolidation.
$CVC #CVC
46
·
--
【See Rise】
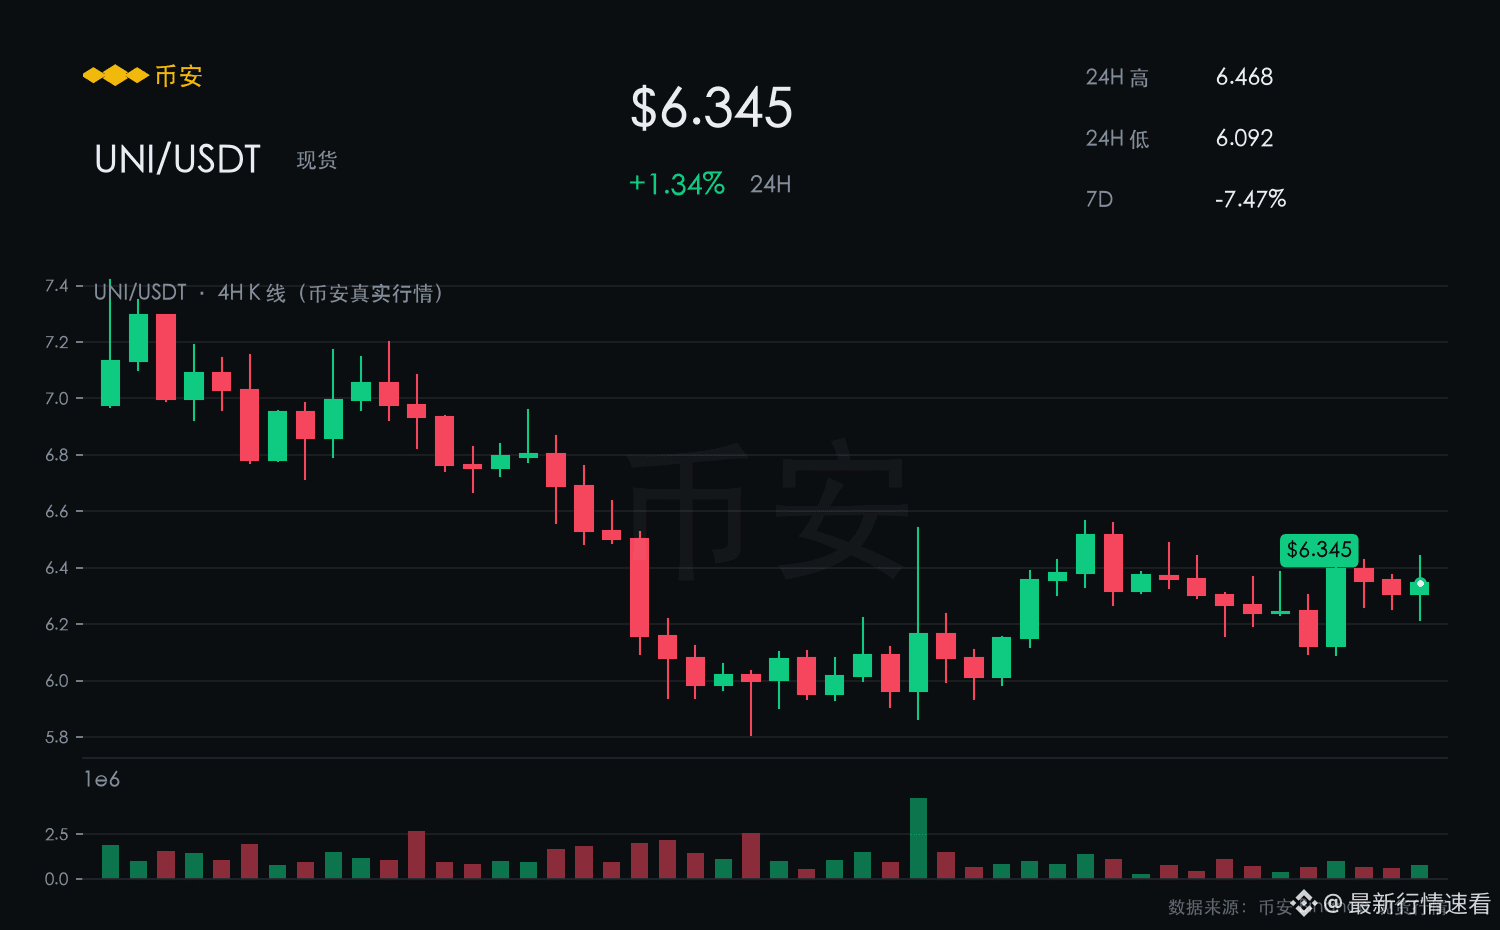
UNI is currently reported at 6.345, up 1.34% over the past 24 hours. The 7-day increase is 7.47%, with an intraday range of 6.092–6.468.
In a market where it’s falling without rising, UNI goes against the trend—turning red over 24 hours is the attitude.
The support at 6.092 has held firm after two rounds of testing.
In the short term, it is leaning bullish.
【Bullish Rationale】
A 7-day gain of 7.47% is solid hard currency in the current market—pullbacks look more like accumulation.
For the rebound, first look at the intraday high of 6.468. After an effective breakout, it will open up new room.
$UNI #UNI
【See Rise】
UNI is currently reported at 6.345, up 1.34% over the past 24 hours. The 7-day increase is 7.47%, with an intraday range of 6.092–6.468.
In a market where it’s falling without rising, UNI goes against the trend—turning red over 24 hours is the attitude.
The support at 6.092 has held firm after two rounds of testing.
In the short term, it is leaning bullish.
【Bullish Rationale】
A 7-day gain of 7.47% is solid hard currency in the current market—pullbacks look more like accumulation.
For the rebound, first look at the intraday high of 6.468. After an effective breakout, it will open up new room.
$UNI #UNI
UNI is currently reported at 6.345, up 1.34% over the past 24 hours. The 7-day increase is 7.47%, with an intraday range of 6.092–6.468.
In a market where it’s falling without rising, UNI goes against the trend—turning red over 24 hours is the attitude.
The support at 6.092 has held firm after two rounds of testing.
In the short term, it is leaning bullish.
【Bullish Rationale】
A 7-day gain of 7.47% is solid hard currency in the current market—pullbacks look more like accumulation.
For the rebound, first look at the intraday high of 6.468. After an effective breakout, it will open up new room.
$UNI #UNI
14
·
--
【See Up】
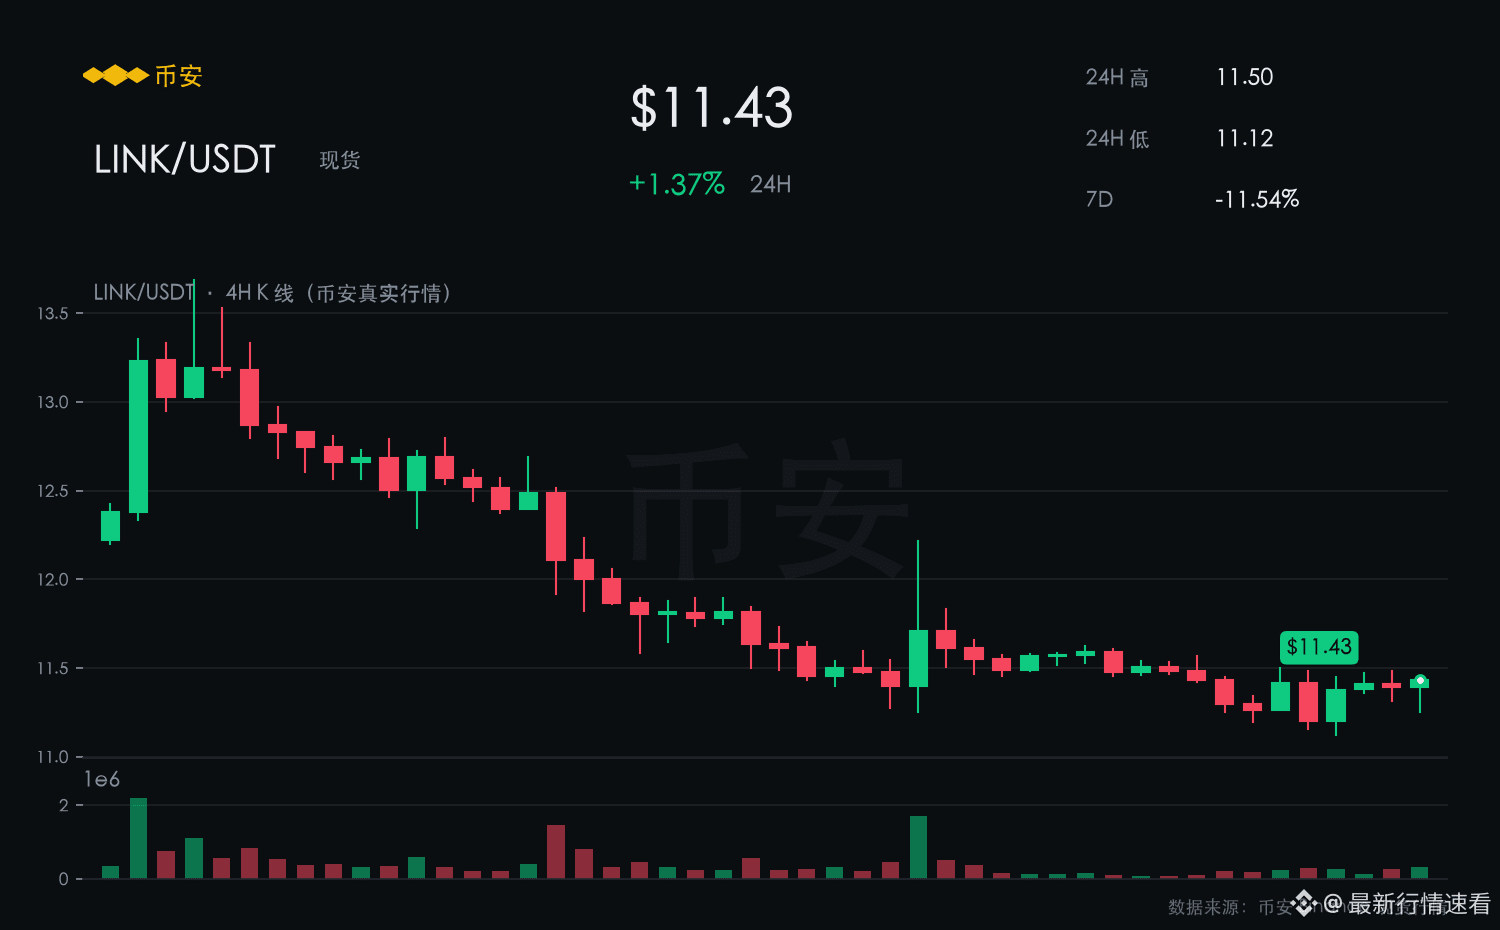
LINK current price 11.432, up 1.37% in the past 24 hours, with a 7-day increase of 11.54%, trading range today 11.121–11.502.
In a market where it’s the opposite—following the downside but not the upside—LINK does the reverse; a green candle in the last 24 hours is the stance.
At the 11.121 level, it has been tested multiple times without breaking; the pullback and rebound are very decisive.
In the short term, it leans bullish.
【Bullish Reasons】
The 7-day gain of 11.54% is a hard-currency level move in the current market; the pullback looks more like buildup.
For the rebound, first watch today’s high at 11.502—after a valid breakout, it opens up new space.
$LINK #LINK
【See Up】
LINK current price 11.432, up 1.37% in the past 24 hours, with a 7-day increase of 11.54%, trading range today 11.121–11.502.
In a market where it’s the opposite—following the downside but not the upside—LINK does the reverse; a green candle in the last 24 hours is the stance.
At the 11.121 level, it has been tested multiple times without breaking; the pullback and rebound are very decisive.
In the short term, it leans bullish.
【Bullish Reasons】
The 7-day gain of 11.54% is a hard-currency level move in the current market; the pullback looks more like buildup.
For the rebound, first watch today’s high at 11.502—after a valid breakout, it opens up new space.
$LINK #LINK
LINK current price 11.432, up 1.37% in the past 24 hours, with a 7-day increase of 11.54%, trading range today 11.121–11.502.
In a market where it’s the opposite—following the downside but not the upside—LINK does the reverse; a green candle in the last 24 hours is the stance.
At the 11.121 level, it has been tested multiple times without breaking; the pullback and rebound are very decisive.
In the short term, it leans bullish.
【Bullish Reasons】
The 7-day gain of 11.54% is a hard-currency level move in the current market; the pullback looks more like buildup.
For the rebound, first watch today’s high at 11.502—after a valid breakout, it opens up new space.
$LINK #LINK
28
·
--
【See the rise】
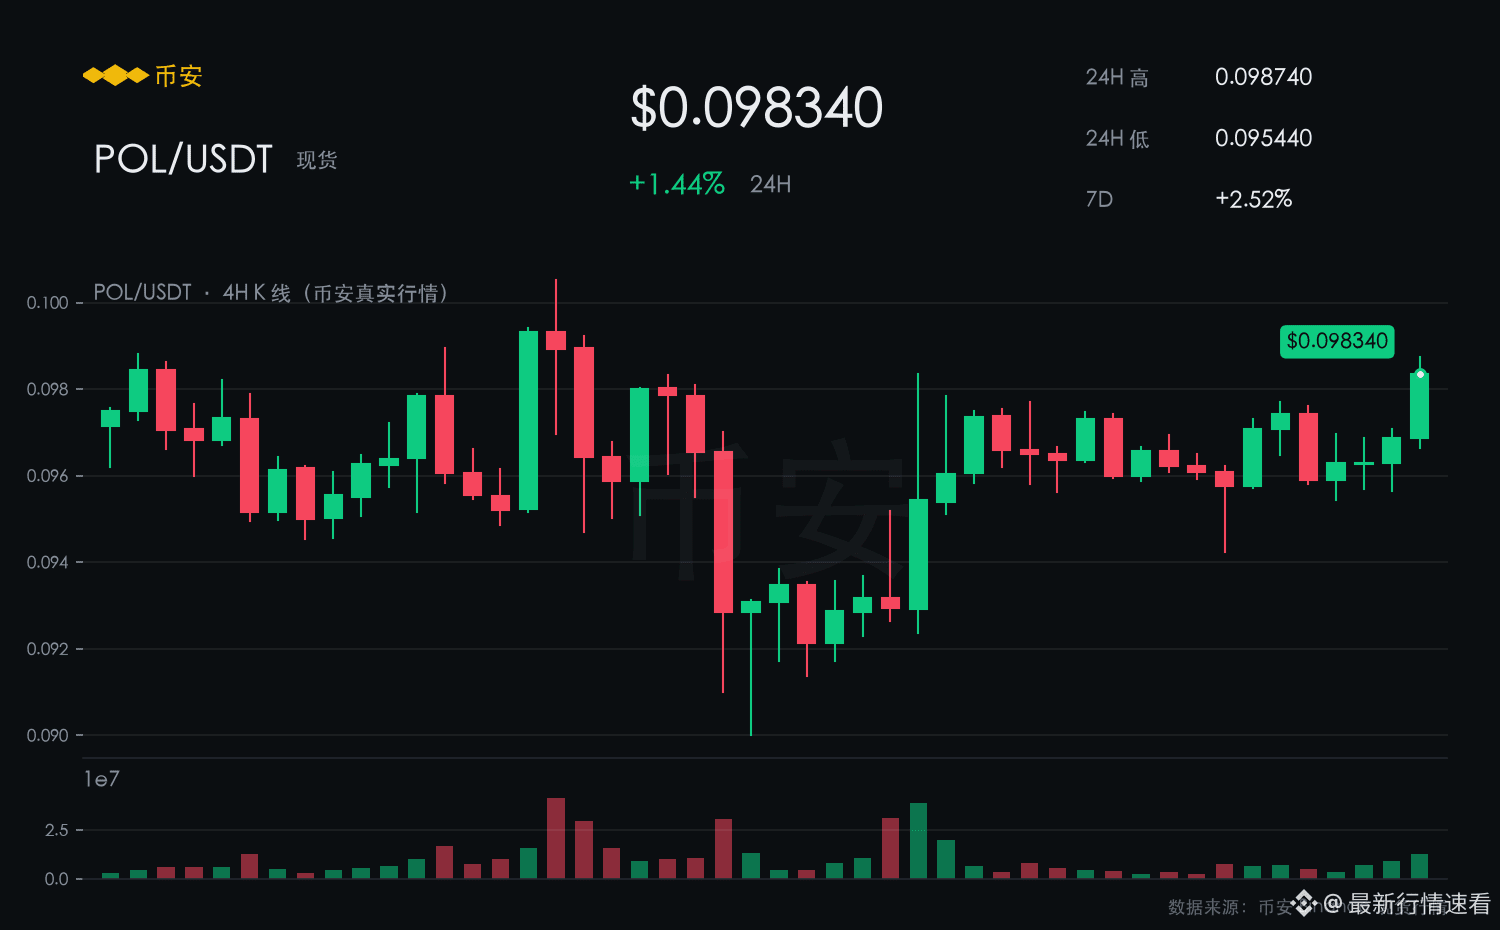
POL is currently reported at 0.0983, up 1.44% over the past 24 hours, with a 7-day increase of 2.52%, ranging from 0.0954–0.0987 during the day.
In a market where some follow down but don’t chase up, POL goes the other way—when the last 24 hours close is green, that’s the attitude.
At 0.0954, the price has repeatedly been tested without breaking; pullbacks are met with strong follow-through.
In the short term, it leans bullish.
【Bullish reasons】
A single-day gain of 1.44% isn’t extreme, but paired with a 7-day slope of 2.52%, the trend is right.
If it holds above 0.0954, the next target is 0.0987.
$POL #POL
【See the rise】
POL is currently reported at 0.0983, up 1.44% over the past 24 hours, with a 7-day increase of 2.52%, ranging from 0.0954–0.0987 during the day.
In a market where some follow down but don’t chase up, POL goes the other way—when the last 24 hours close is green, that’s the attitude.
At 0.0954, the price has repeatedly been tested without breaking; pullbacks are met with strong follow-through.
In the short term, it leans bullish.
【Bullish reasons】
A single-day gain of 1.44% isn’t extreme, but paired with a 7-day slope of 2.52%, the trend is right.
If it holds above 0.0954, the next target is 0.0987.
$POL #POL
POL is currently reported at 0.0983, up 1.44% over the past 24 hours, with a 7-day increase of 2.52%, ranging from 0.0954–0.0987 during the day.
In a market where some follow down but don’t chase up, POL goes the other way—when the last 24 hours close is green, that’s the attitude.
At 0.0954, the price has repeatedly been tested without breaking; pullbacks are met with strong follow-through.
In the short term, it leans bullish.
【Bullish reasons】
A single-day gain of 1.44% isn’t extreme, but paired with a 7-day slope of 2.52%, the trend is right.
If it holds above 0.0954, the next target is 0.0987.
$POL #POL
1
·
--
[Watch Rise]
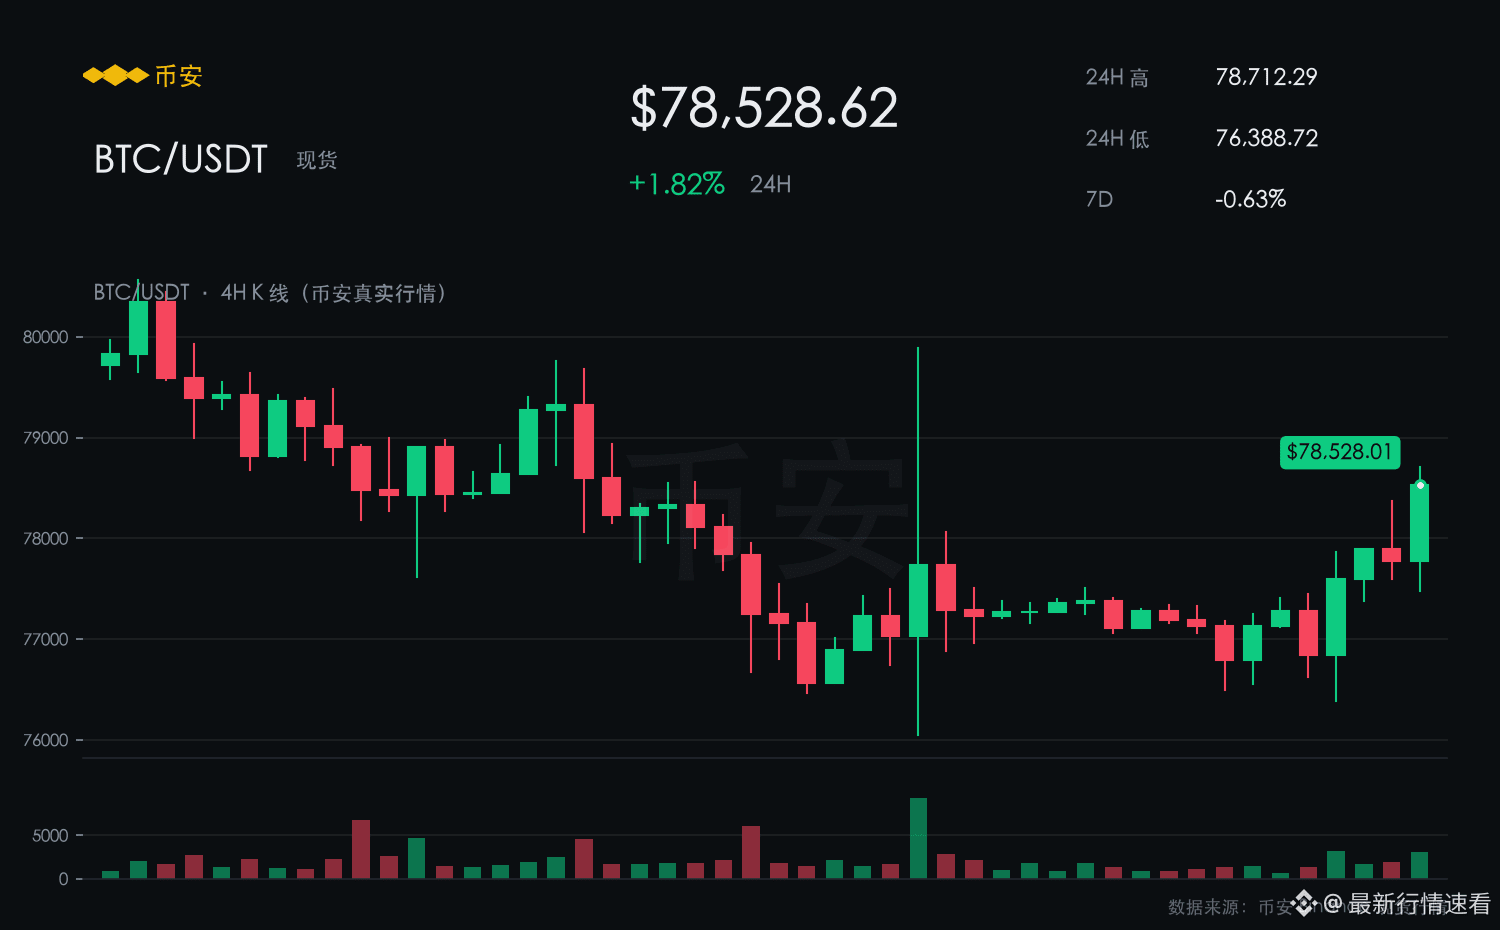
BTC is currently at 78,538.3, up 1.84% over the past 24 hours, with a 7-day gain of 0.62%, and intraday range of 76,388.7–78,712.3.
In a market where others follow down but not up, BTC does the opposite—turning the red in 24 hours is the attitude.
Below, 76,388.7 support was tested twice and held.
In the short term, the bias is bullish.
[Why Bullish]
A 1.84% gain over 24 hours combined with a 0.62% rise over 7 days, with continuous capital inflows—it’s not just a one-day spike.
Once it holds above 76,388.7, the next target is 78,712.3.
$BTC #BTC
[Watch Rise]
BTC is currently at 78,538.3, up 1.84% over the past 24 hours, with a 7-day gain of 0.62%, and intraday range of 76,388.7–78,712.3.
In a market where others follow down but not up, BTC does the opposite—turning the red in 24 hours is the attitude.
Below, 76,388.7 support was tested twice and held.
In the short term, the bias is bullish.
[Why Bullish]
A 1.84% gain over 24 hours combined with a 0.62% rise over 7 days, with continuous capital inflows—it’s not just a one-day spike.
Once it holds above 76,388.7, the next target is 78,712.3.
$BTC #BTC
BTC is currently at 78,538.3, up 1.84% over the past 24 hours, with a 7-day gain of 0.62%, and intraday range of 76,388.7–78,712.3.
In a market where others follow down but not up, BTC does the opposite—turning the red in 24 hours is the attitude.
Below, 76,388.7 support was tested twice and held.
In the short term, the bias is bullish.
[Why Bullish]
A 1.84% gain over 24 hours combined with a 0.62% rise over 7 days, with continuous capital inflows—it’s not just a one-day spike.
Once it holds above 76,388.7, the next target is 78,712.3.
$BTC #BTC
113
·
--
【See Rise】
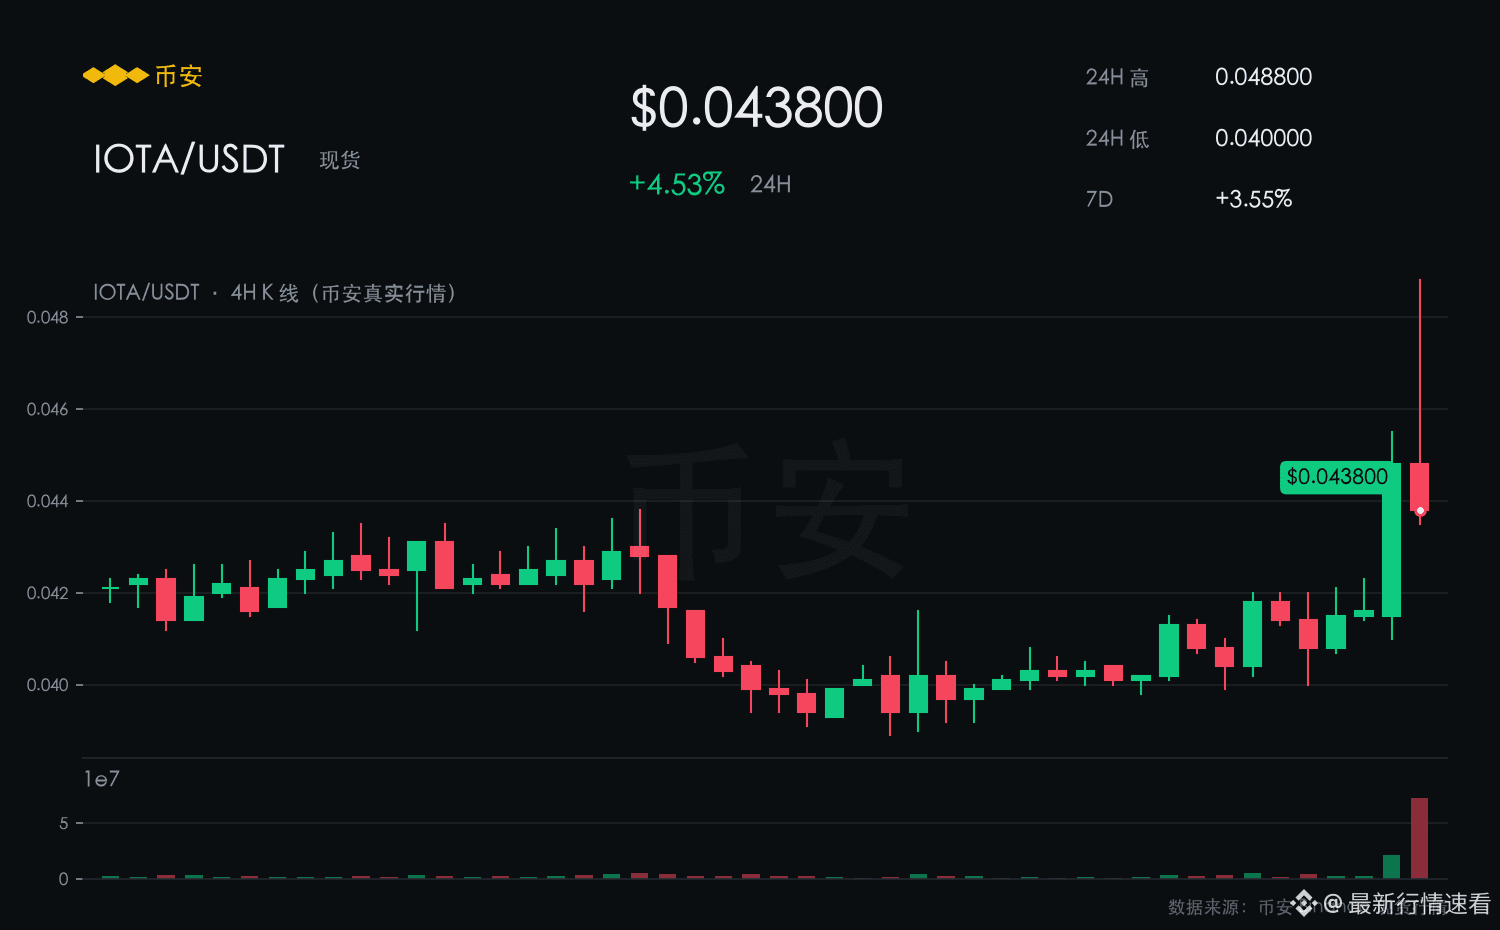
IOTA is currently quoted at 0.0439, up 4.77% over the past 24 hours, with a 7-day gain of 3.78%, and trading range today of 0.0400–0.0488.
This pullback in IOTA has shown clear resilience; its short-term strength ranks among the top in the market.
As long as 0.0400 holds, the current pullback is still a strong consolidation.
In the short term, the bias is bullish.
【Bullish Reasons】
A 7-day gain of 3.78% is solid “hard currency” in today’s market, and the pullback looks more like accumulation.
For the rebound, first target the intraday high at 0.0488. Once it breaks effectively, it will open up fresh upside space.
$IOTA #IOTA
【See Rise】
IOTA is currently quoted at 0.0439, up 4.77% over the past 24 hours, with a 7-day gain of 3.78%, and trading range today of 0.0400–0.0488.
This pullback in IOTA has shown clear resilience; its short-term strength ranks among the top in the market.
As long as 0.0400 holds, the current pullback is still a strong consolidation.
In the short term, the bias is bullish.
【Bullish Reasons】
A 7-day gain of 3.78% is solid “hard currency” in today’s market, and the pullback looks more like accumulation.
For the rebound, first target the intraday high at 0.0488. Once it breaks effectively, it will open up fresh upside space.
$IOTA #IOTA
IOTA is currently quoted at 0.0439, up 4.77% over the past 24 hours, with a 7-day gain of 3.78%, and trading range today of 0.0400–0.0488.
This pullback in IOTA has shown clear resilience; its short-term strength ranks among the top in the market.
As long as 0.0400 holds, the current pullback is still a strong consolidation.
In the short term, the bias is bullish.
【Bullish Reasons】
A 7-day gain of 3.78% is solid “hard currency” in today’s market, and the pullback looks more like accumulation.
For the rebound, first target the intraday high at 0.0488. Once it breaks effectively, it will open up fresh upside space.
$IOTA #IOTA
23
·
--
【See Rise】
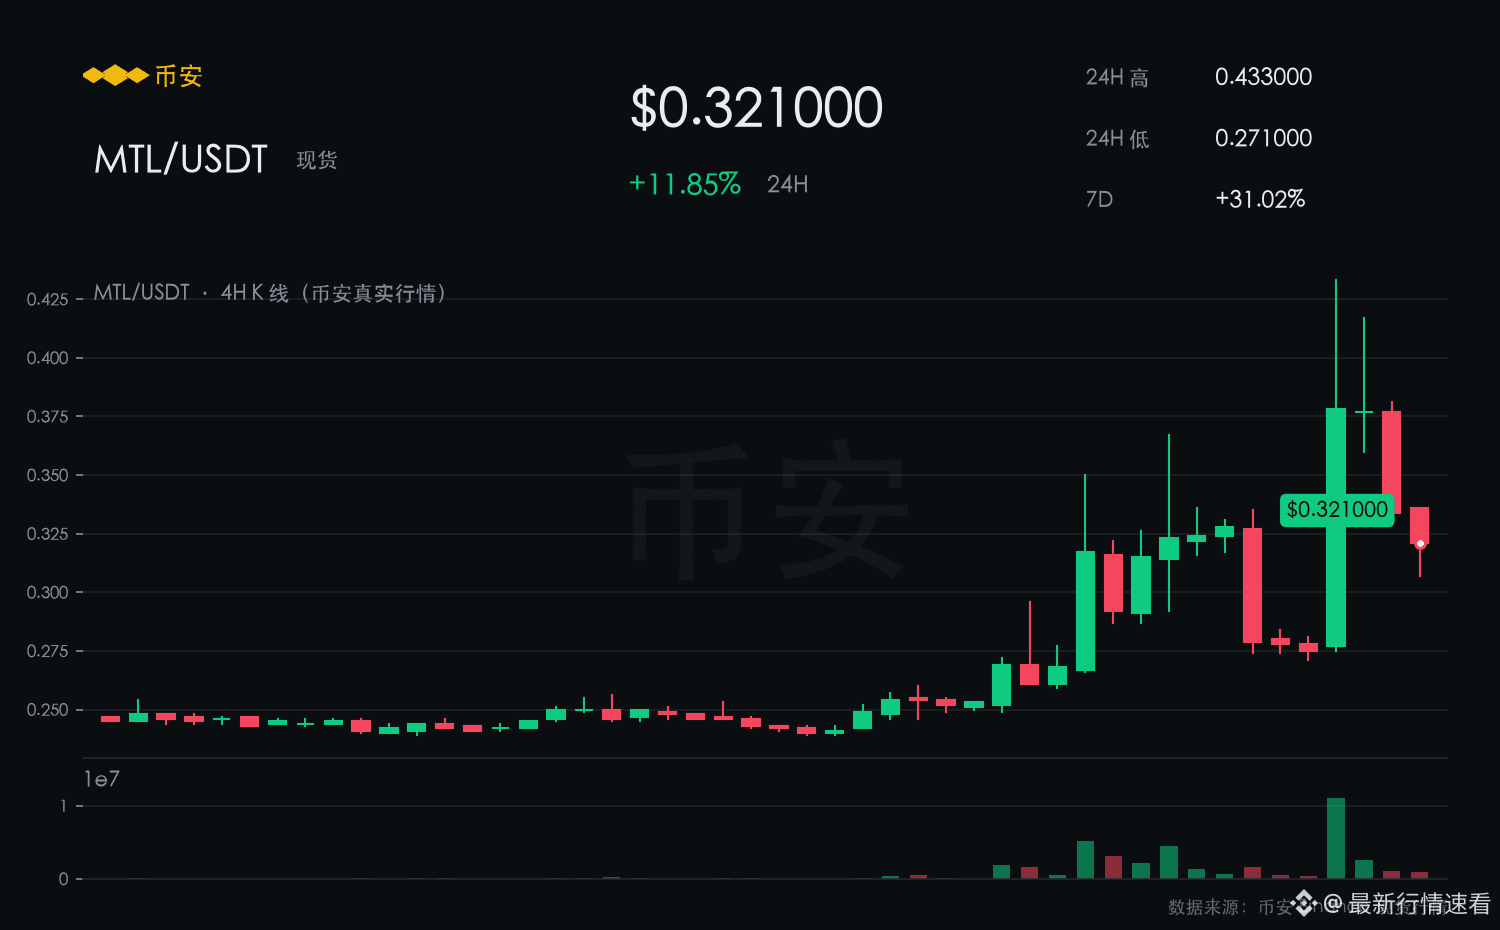
MTL current price 0.3210, up 11.85% in the past 24 hours, with a 7-day increase of 31.02%, trading range today 0.2710–0.4330.
In a market where it goes down but not up, MTL does the opposite—turning red in the last 24 hours is the attitude.
At the 0.2710 level, it has repeatedly been retested without breaking; the pullback has strong follow-through.
Bulls in the short term.
【Bullish Reasons】
A single-day gain of 11.85% isn’t outrageous, but combined with a 31.02% slope over 7 days, the trend is right.
Near-term resistance is at 0.4330; if it breaks through on increased volume, then follow along.
$MTL #MTL
【See Rise】
MTL current price 0.3210, up 11.85% in the past 24 hours, with a 7-day increase of 31.02%, trading range today 0.2710–0.4330.
In a market where it goes down but not up, MTL does the opposite—turning red in the last 24 hours is the attitude.
At the 0.2710 level, it has repeatedly been retested without breaking; the pullback has strong follow-through.
Bulls in the short term.
【Bullish Reasons】
A single-day gain of 11.85% isn’t outrageous, but combined with a 31.02% slope over 7 days, the trend is right.
Near-term resistance is at 0.4330; if it breaks through on increased volume, then follow along.
$MTL #MTL
MTL current price 0.3210, up 11.85% in the past 24 hours, with a 7-day increase of 31.02%, trading range today 0.2710–0.4330.
In a market where it goes down but not up, MTL does the opposite—turning red in the last 24 hours is the attitude.
At the 0.2710 level, it has repeatedly been retested without breaking; the pullback has strong follow-through.
Bulls in the short term.
【Bullish Reasons】
A single-day gain of 11.85% isn’t outrageous, but combined with a 31.02% slope over 7 days, the trend is right.
Near-term resistance is at 0.4330; if it breaks through on increased volume, then follow along.
$MTL #MTL
·
--
【See Decline】
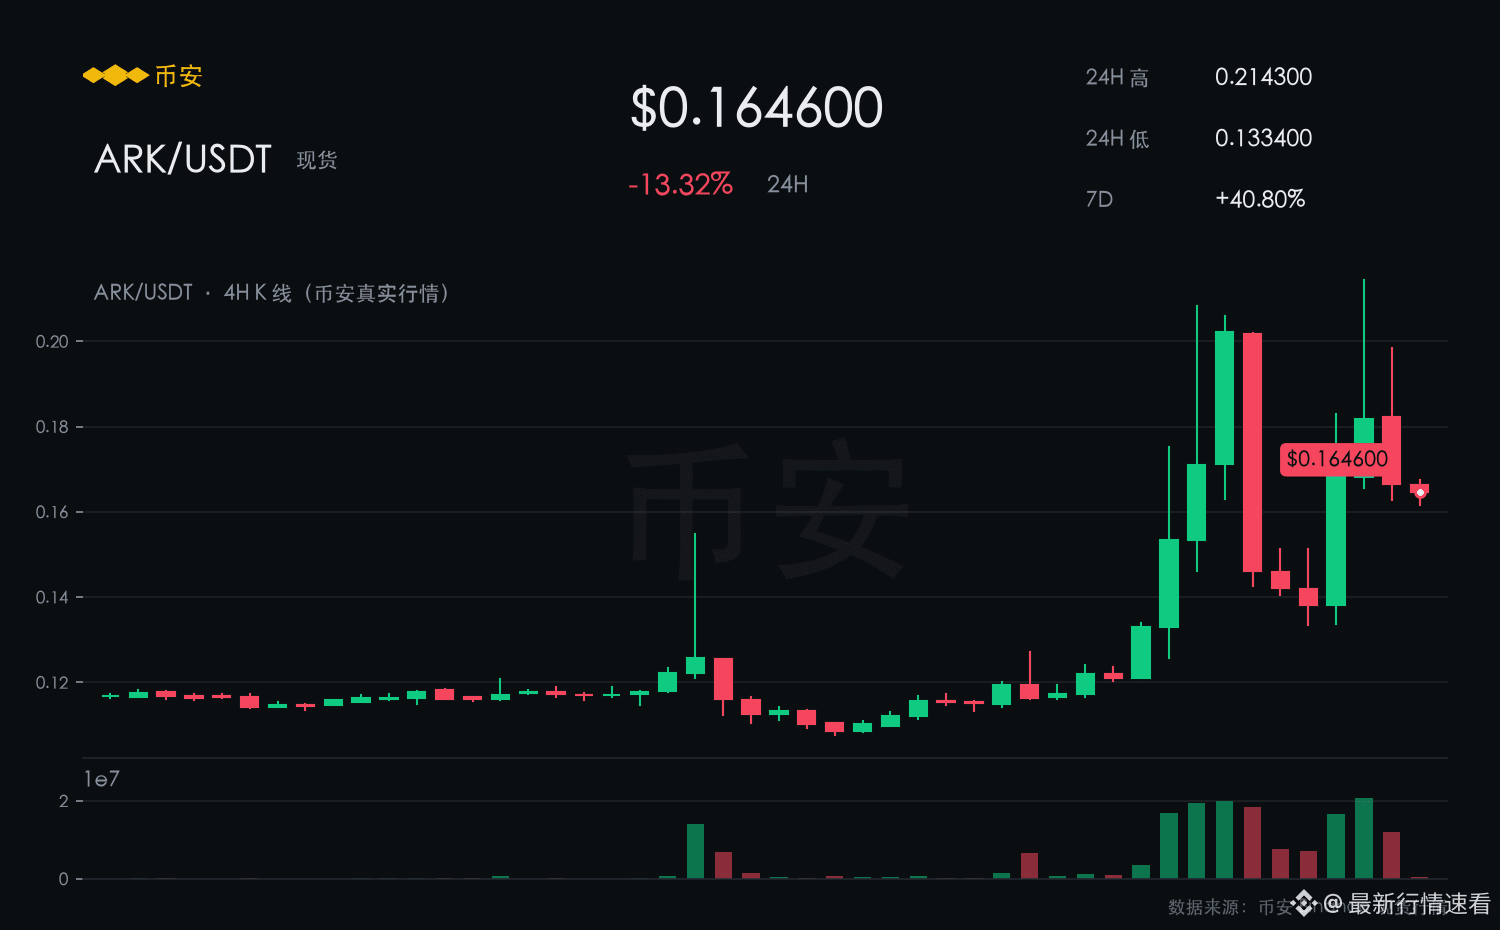
ARK is currently reported at 0.1646, down 13.37% over the past 24 hours. It is still down 40.80% over 7 days, with an intraday range of 0.1334–0.2143。
ARK is down 13.37% over the past 24 hours. After rebounding to around 0.2143, it was pushed back down again—there is a high density of trapped orders overhead.
The rebound is on shrinking volume while the selloff is on expanding volume; the volume-price structure is bearish.
In the short term, it leans toward a bearish outlook.
【Reasons for Bearish View】
A 13.37% drop over 24 hours indicates that the aggressive selling has not yet exhausted.
For now, first watch whether 0.1334 can hold. If it breaks, don’t catch a falling knife.
$ARK #ARK
【See Decline】
ARK is currently reported at 0.1646, down 13.37% over the past 24 hours. It is still down 40.80% over 7 days, with an intraday range of 0.1334–0.2143。
ARK is down 13.37% over the past 24 hours. After rebounding to around 0.2143, it was pushed back down again—there is a high density of trapped orders overhead.
The rebound is on shrinking volume while the selloff is on expanding volume; the volume-price structure is bearish.
In the short term, it leans toward a bearish outlook.
【Reasons for Bearish View】
A 13.37% drop over 24 hours indicates that the aggressive selling has not yet exhausted.
For now, first watch whether 0.1334 can hold. If it breaks, don’t catch a falling knife.
$ARK #ARK
ARK is currently reported at 0.1646, down 13.37% over the past 24 hours. It is still down 40.80% over 7 days, with an intraday range of 0.1334–0.2143。
ARK is down 13.37% over the past 24 hours. After rebounding to around 0.2143, it was pushed back down again—there is a high density of trapped orders overhead.
The rebound is on shrinking volume while the selloff is on expanding volume; the volume-price structure is bearish.
In the short term, it leans toward a bearish outlook.
【Reasons for Bearish View】
A 13.37% drop over 24 hours indicates that the aggressive selling has not yet exhausted.
For now, first watch whether 0.1334 can hold. If it breaks, don’t catch a falling knife.
$ARK #ARK
39
·
--
【Watch Drop】
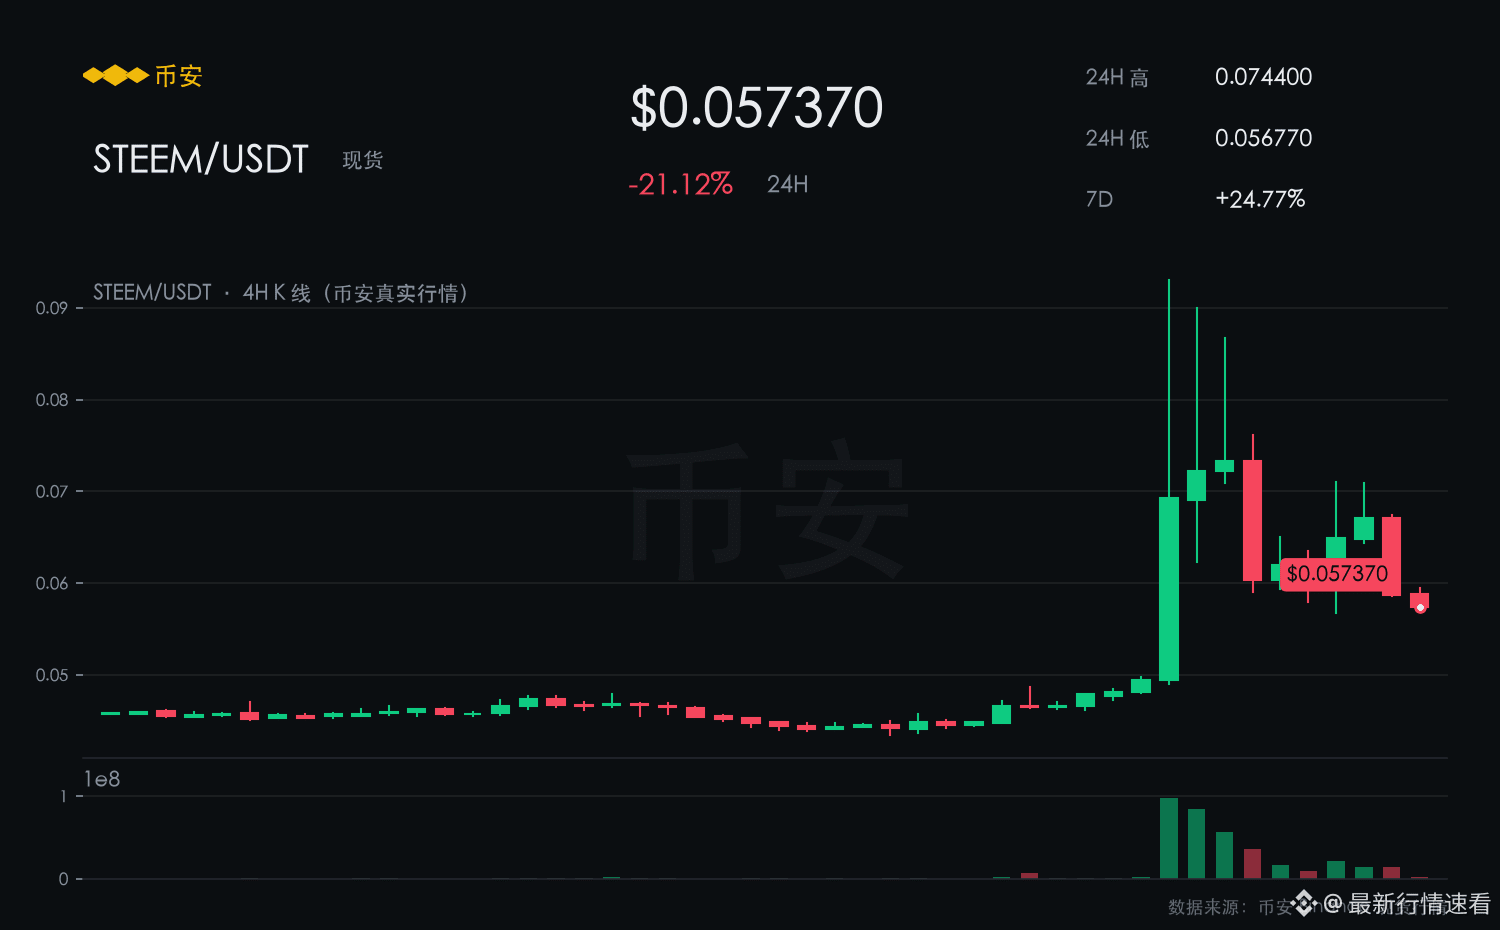
STEEM current price 0.0574, down 21.12% over the past 24 hours, still down 24.77% over 7 days, with an intraday range of 0.0568–0.0744.
STEEM intraday range 0.0568–0.0744; the rebound lacks volume, and the 7-day candles are still closing bearish.
The support at 0.0568 hasn’t been tested with real buying and selling volume, so confidence is low.
In the short term, it leans bearish.
【Bearish Rationale】
Against the weekly backdrop of -24.77% over 7 days, a small single-day bullish candle can only be treated as a weak rebound.
For the short term, first see whether 0.0568 can hold; if it breaks, don’t catch a falling knife.
$STEEM #STEEM
【Watch Drop】
STEEM current price 0.0574, down 21.12% over the past 24 hours, still down 24.77% over 7 days, with an intraday range of 0.0568–0.0744.
STEEM intraday range 0.0568–0.0744; the rebound lacks volume, and the 7-day candles are still closing bearish.
The support at 0.0568 hasn’t been tested with real buying and selling volume, so confidence is low.
In the short term, it leans bearish.
【Bearish Rationale】
Against the weekly backdrop of -24.77% over 7 days, a small single-day bullish candle can only be treated as a weak rebound.
For the short term, first see whether 0.0568 can hold; if it breaks, don’t catch a falling knife.
$STEEM #STEEM
STEEM current price 0.0574, down 21.12% over the past 24 hours, still down 24.77% over 7 days, with an intraday range of 0.0568–0.0744.
STEEM intraday range 0.0568–0.0744; the rebound lacks volume, and the 7-day candles are still closing bearish.
The support at 0.0568 hasn’t been tested with real buying and selling volume, so confidence is low.
In the short term, it leans bearish.
【Bearish Rationale】
Against the weekly backdrop of -24.77% over 7 days, a small single-day bullish candle can only be treated as a weak rebound.
For the short term, first see whether 0.0568 can hold; if it breaks, don’t catch a falling knife.
$STEEM #STEEM
9
·
--
【Looking Down】
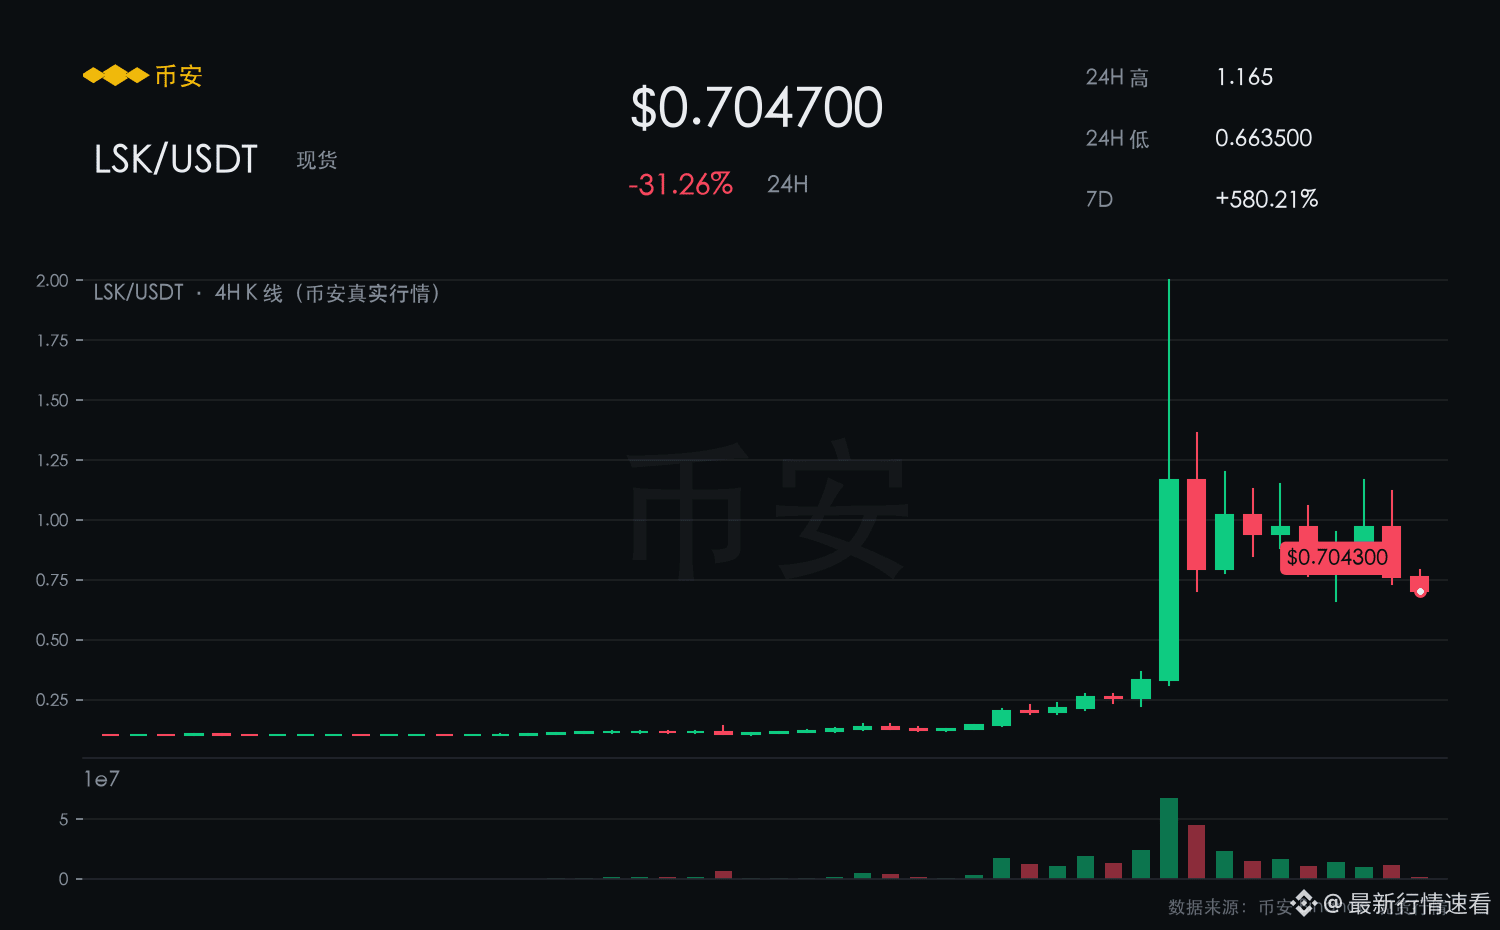
LSK is currently at 0.7043, down 31.29% over the past 24 hours, still down 579.83% over the last 7 days, with an intraday range of 0.6635–1.165.
LSK is down 31.29% in the past 24 hours. The rebound back to around 1.165 was pushed back down, with a high density of sell/lock-up orders above.
A single-day rebound has not reversed the weakness on the weekly chart, and selling pressure continues to be released.
In the short term, it is biased bearish.
【Bearish Rationale】
The 31.29% drop over 24 hours indicates that active sell pressure has not yet exhausted.
For the short term, first watch whether 0.6635 can hold. If it breaks, don’t catch the falling knife.
$LSK #LSK
【Looking Down】
LSK is currently at 0.7043, down 31.29% over the past 24 hours, still down 579.83% over the last 7 days, with an intraday range of 0.6635–1.165.
LSK is down 31.29% in the past 24 hours. The rebound back to around 1.165 was pushed back down, with a high density of sell/lock-up orders above.
A single-day rebound has not reversed the weakness on the weekly chart, and selling pressure continues to be released.
In the short term, it is biased bearish.
【Bearish Rationale】
The 31.29% drop over 24 hours indicates that active sell pressure has not yet exhausted.
For the short term, first watch whether 0.6635 can hold. If it breaks, don’t catch the falling knife.
$LSK #LSK
LSK is currently at 0.7043, down 31.29% over the past 24 hours, still down 579.83% over the last 7 days, with an intraday range of 0.6635–1.165.
LSK is down 31.29% in the past 24 hours. The rebound back to around 1.165 was pushed back down, with a high density of sell/lock-up orders above.
A single-day rebound has not reversed the weakness on the weekly chart, and selling pressure continues to be released.
In the short term, it is biased bearish.
【Bearish Rationale】
The 31.29% drop over 24 hours indicates that active sell pressure has not yet exhausted.
For the short term, first watch whether 0.6635 can hold. If it breaks, don’t catch the falling knife.
$LSK #LSK
26
·
--
【See Gains】
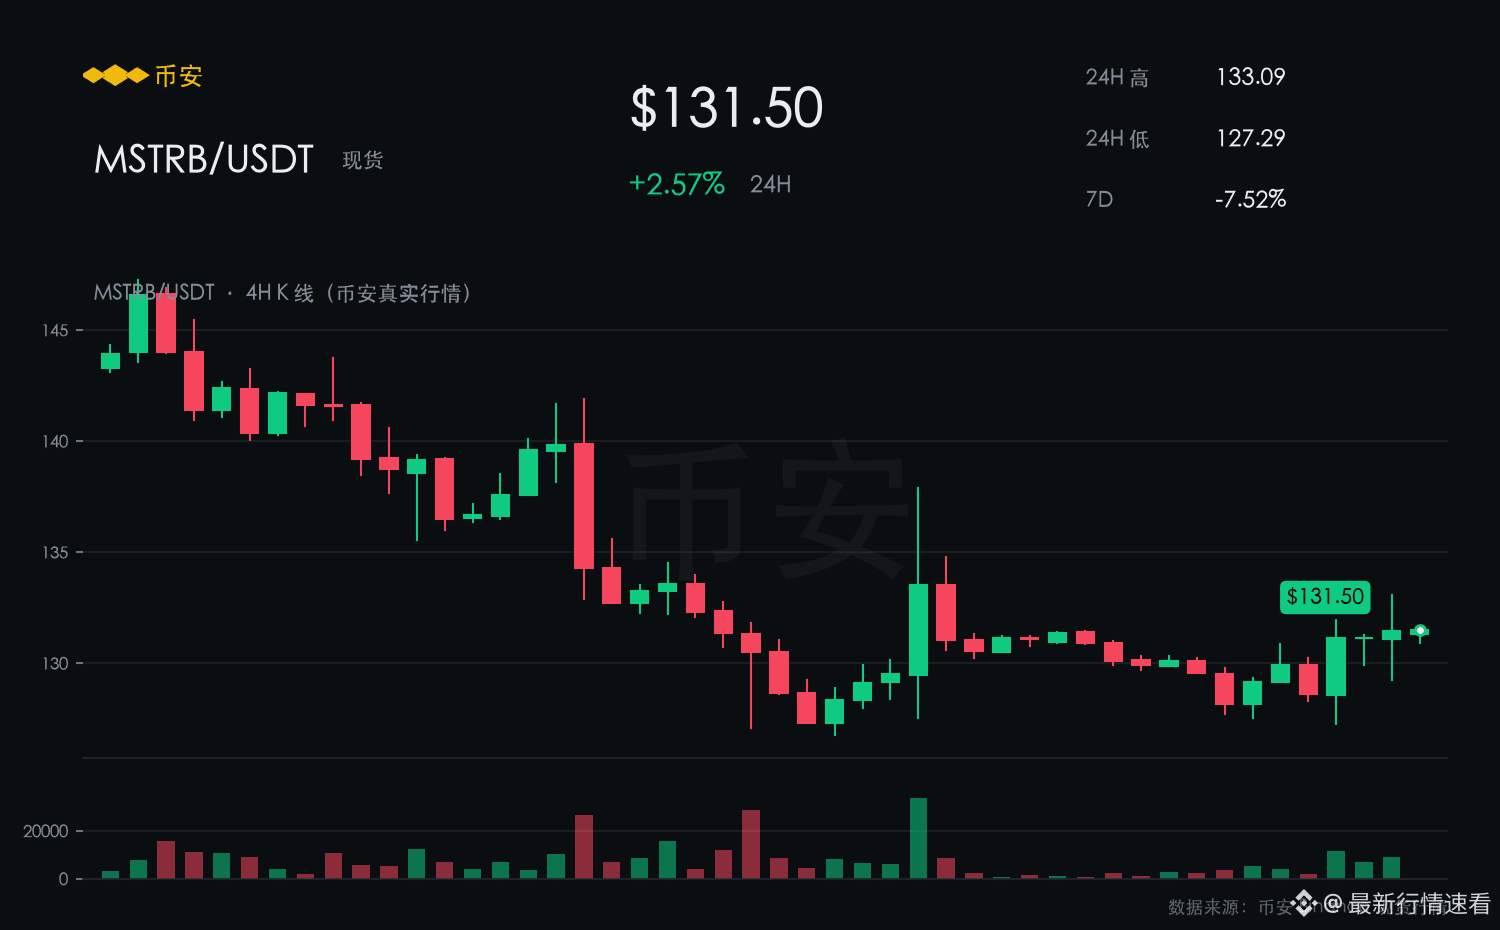
MSTRB is currently reported at 131.50, up 2.57% over the past 24 hours. The 7-day increase is 7.52%, with an intraday range of 127.29–133.09.
The price has been consolidating within the 127.29–133.09 range during the day; the lows have been gradually rising, showing signs of bullish control.
Support at 127.29 below has held up through two rounds of testing.
In the short term, it is biased bullish.
【Bullish Rationale】
A one-day gain of 2.57% isn’t particularly dramatic, but paired with a 7-day slope of 7.52%, the trend is correct.
The near-term resistance is at 133.09—if volume increases and it breaks through, then follow-through should follow.
$MSTRB #MSTRB
【See Gains】
MSTRB is currently reported at 131.50, up 2.57% over the past 24 hours. The 7-day increase is 7.52%, with an intraday range of 127.29–133.09.
The price has been consolidating within the 127.29–133.09 range during the day; the lows have been gradually rising, showing signs of bullish control.
Support at 127.29 below has held up through two rounds of testing.
In the short term, it is biased bullish.
【Bullish Rationale】
A one-day gain of 2.57% isn’t particularly dramatic, but paired with a 7-day slope of 7.52%, the trend is correct.
The near-term resistance is at 133.09—if volume increases and it breaks through, then follow-through should follow.
$MSTRB #MSTRB
MSTRB is currently reported at 131.50, up 2.57% over the past 24 hours. The 7-day increase is 7.52%, with an intraday range of 127.29–133.09.
The price has been consolidating within the 127.29–133.09 range during the day; the lows have been gradually rising, showing signs of bullish control.
Support at 127.29 below has held up through two rounds of testing.
In the short term, it is biased bullish.
【Bullish Rationale】
A one-day gain of 2.57% isn’t particularly dramatic, but paired with a 7-day slope of 7.52%, the trend is correct.
The near-term resistance is at 133.09—if volume increases and it breaks through, then follow-through should follow.
$MSTRB #MSTRB
14
·
--
【See Rise】
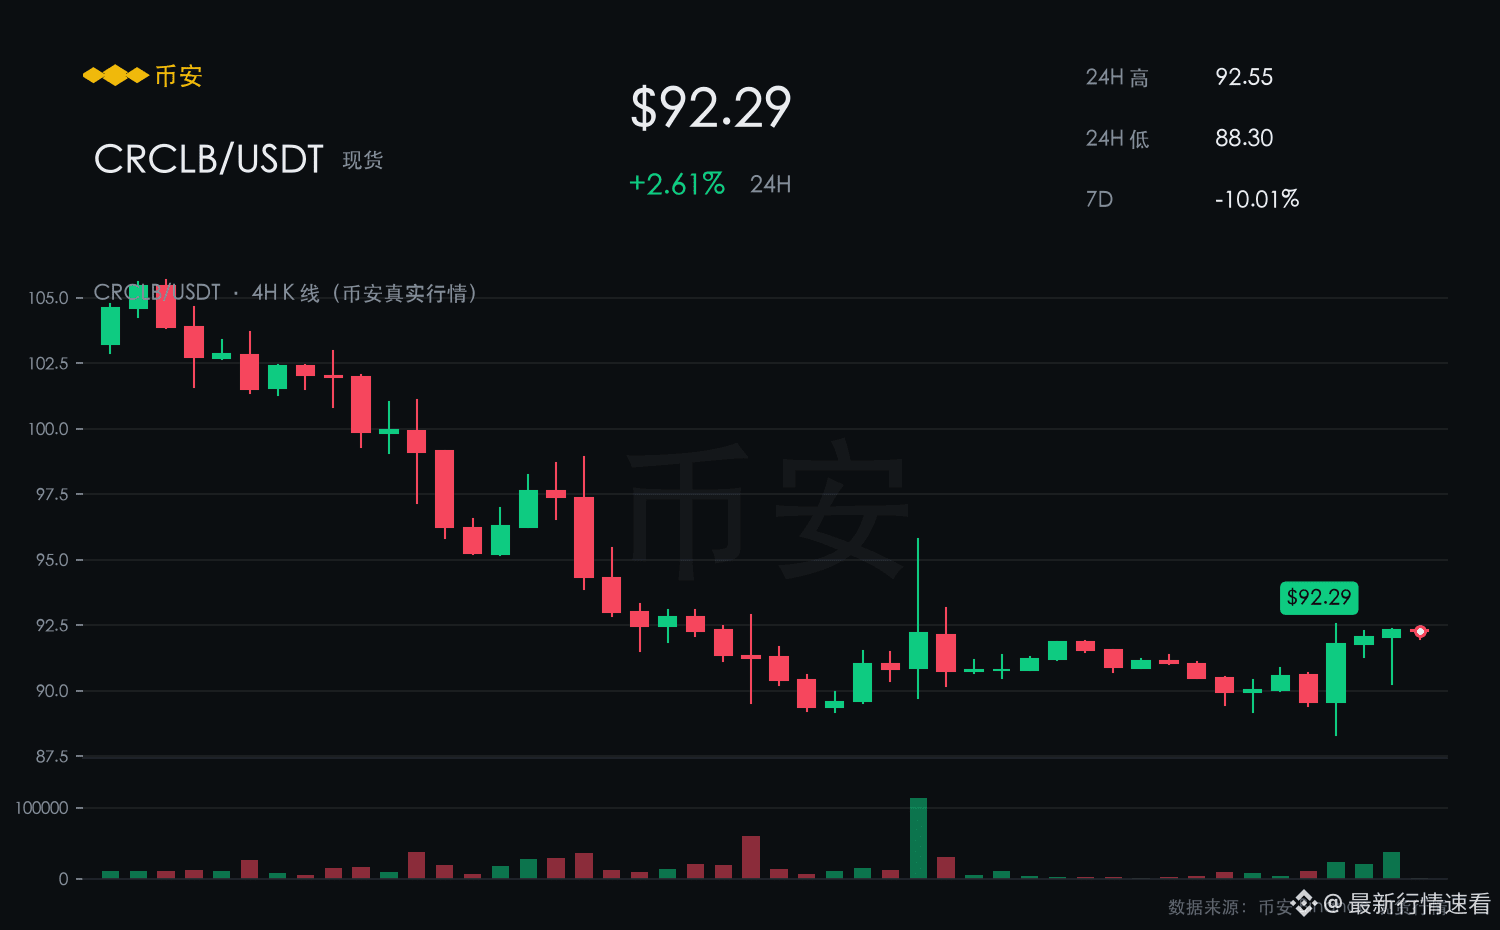
CRCLB is currently quoted at 92.280, up 2.60% over the past 24 hours, with a 7-day gain of 10.02%, and a trading range of 88.300–92.550 intraday.
This pullback for CRCLB clearly shows strong downside resilience, and its short-term strength ranks among the top in the market.
As long as 88.300 holds, the current pullback can be regarded as a strong consolidation.
In the near term, it leans bullish.
【Bullish Rationale】
A 7-day gain of 10.02% is solid, reliable “hard currency” strength within the current market conditions, and the pullback looks more like building momentum.
For the rebound, first look at the intraday high of 92.550; after an effective break, it will open up new room.
$CRCLB #CRCLB
【See Rise】
CRCLB is currently quoted at 92.280, up 2.60% over the past 24 hours, with a 7-day gain of 10.02%, and a trading range of 88.300–92.550 intraday.
This pullback for CRCLB clearly shows strong downside resilience, and its short-term strength ranks among the top in the market.
As long as 88.300 holds, the current pullback can be regarded as a strong consolidation.
In the near term, it leans bullish.
【Bullish Rationale】
A 7-day gain of 10.02% is solid, reliable “hard currency” strength within the current market conditions, and the pullback looks more like building momentum.
For the rebound, first look at the intraday high of 92.550; after an effective break, it will open up new room.
$CRCLB #CRCLB
CRCLB is currently quoted at 92.280, up 2.60% over the past 24 hours, with a 7-day gain of 10.02%, and a trading range of 88.300–92.550 intraday.
This pullback for CRCLB clearly shows strong downside resilience, and its short-term strength ranks among the top in the market.
As long as 88.300 holds, the current pullback can be regarded as a strong consolidation.
In the near term, it leans bullish.
【Bullish Rationale】
A 7-day gain of 10.02% is solid, reliable “hard currency” strength within the current market conditions, and the pullback looks more like building momentum.
For the rebound, first look at the intraday high of 92.550; after an effective break, it will open up new room.
$CRCLB #CRCLB
38
·
--
[Seeing Increase]
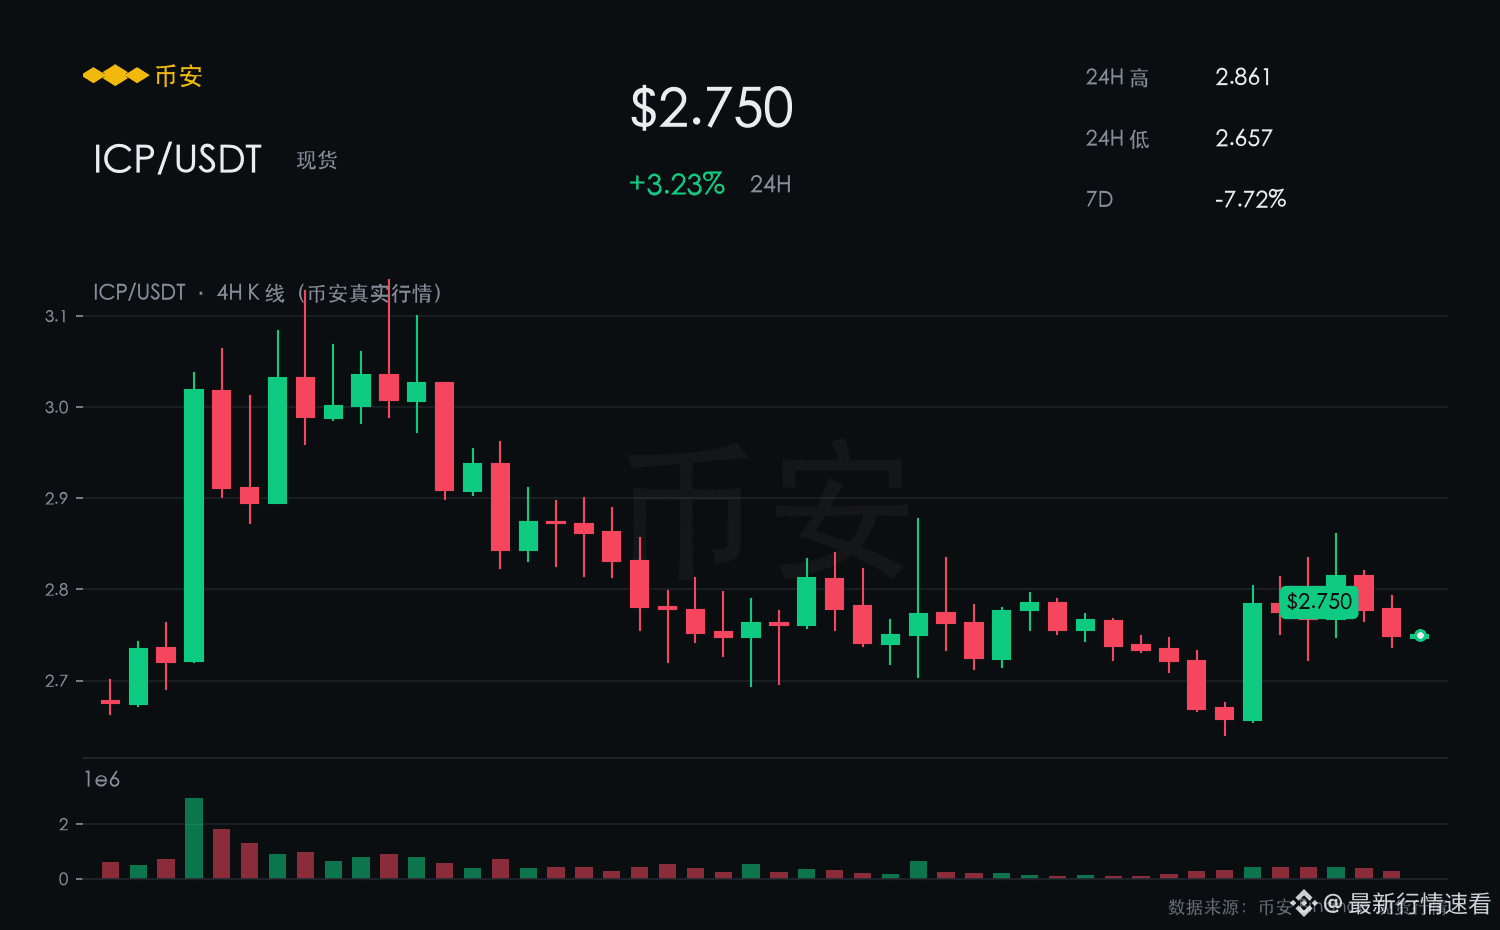
ICP current quote 2.750, up 3.23% in the past 24 hours, up 7.72% over 7 days, trading range today 2.657–2.861.
In a market where it tends to fall but not rise, ICP goes against the grain—seeing a red candle in the past 24 hours is the attitude.
The 2.657 level has been tested and failed to break multiple times; the pullback has been met with strong support.
In the short term, the bias is bullish.
[Reasons for a Bullish View]
A 3.23% gain over 24 hours combined with a 7.72% rise over 7 days suggests continuous capital inflow—it’s not just a one-day spike.
For the rebound, first watch the intraday high of 2.861; once it breaks through effectively, it opens up new room.
$ICP #ICP
[Seeing Increase]
ICP current quote 2.750, up 3.23% in the past 24 hours, up 7.72% over 7 days, trading range today 2.657–2.861.
In a market where it tends to fall but not rise, ICP goes against the grain—seeing a red candle in the past 24 hours is the attitude.
The 2.657 level has been tested and failed to break multiple times; the pullback has been met with strong support.
In the short term, the bias is bullish.
[Reasons for a Bullish View]
A 3.23% gain over 24 hours combined with a 7.72% rise over 7 days suggests continuous capital inflow—it’s not just a one-day spike.
For the rebound, first watch the intraday high of 2.861; once it breaks through effectively, it opens up new room.
$ICP #ICP
ICP current quote 2.750, up 3.23% in the past 24 hours, up 7.72% over 7 days, trading range today 2.657–2.861.
In a market where it tends to fall but not rise, ICP goes against the grain—seeing a red candle in the past 24 hours is the attitude.
The 2.657 level has been tested and failed to break multiple times; the pullback has been met with strong support.
In the short term, the bias is bullish.
[Reasons for a Bullish View]
A 3.23% gain over 24 hours combined with a 7.72% rise over 7 days suggests continuous capital inflow—it’s not just a one-day spike.
For the rebound, first watch the intraday high of 2.861; once it breaks through effectively, it opens up new room.
$ICP #ICP
2
·
--
【See Rise】
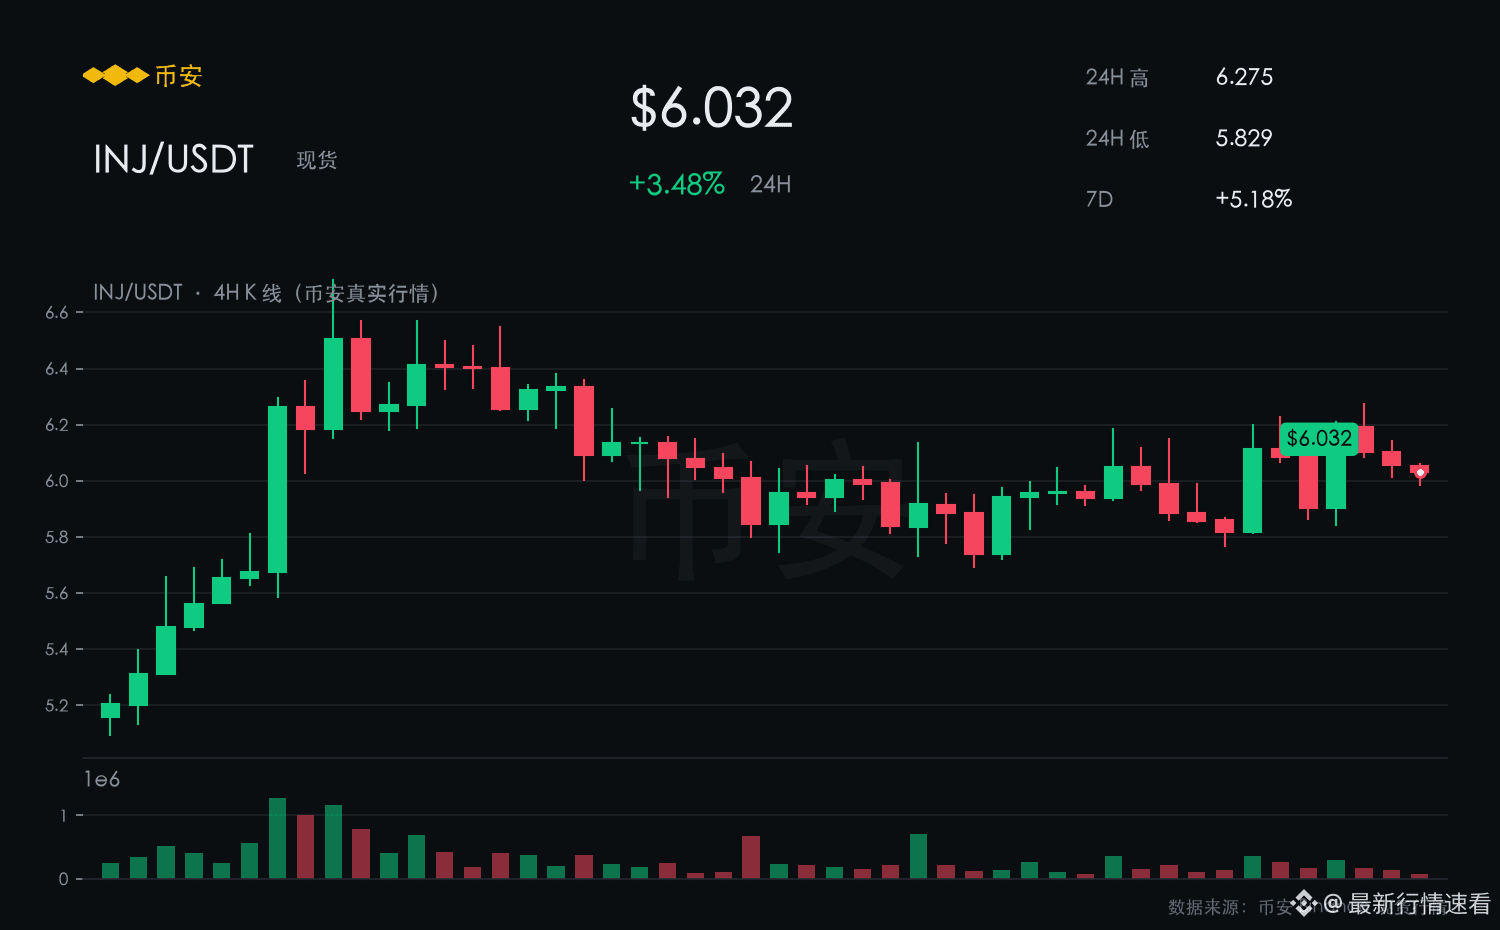
INJ is currently quoted at 6.032; it is up 3.48% over the last 24 hours and up 5.18% over the past 7 days, with an intraday range of 5.829–6.275.
The price has been ranging within 5.829–6.275 intraday; the lows are gradually rising, showing clear signs of bullish control.
The support at 5.829 has held after two tests.
In the short term, the bias is bullish.
【Bullish Reasons】
The 24-hour gain of 3.48% aligns with the 7-day gain of 5.18%, indicating continuous capital inflow rather than a one-day spike.
After holding above 5.829, the next target is 6.275.
$INJ #INJ
【See Rise】
INJ is currently quoted at 6.032; it is up 3.48% over the last 24 hours and up 5.18% over the past 7 days, with an intraday range of 5.829–6.275.
The price has been ranging within 5.829–6.275 intraday; the lows are gradually rising, showing clear signs of bullish control.
The support at 5.829 has held after two tests.
In the short term, the bias is bullish.
【Bullish Reasons】
The 24-hour gain of 3.48% aligns with the 7-day gain of 5.18%, indicating continuous capital inflow rather than a one-day spike.
After holding above 5.829, the next target is 6.275.
$INJ #INJ
INJ is currently quoted at 6.032; it is up 3.48% over the last 24 hours and up 5.18% over the past 7 days, with an intraday range of 5.829–6.275.
The price has been ranging within 5.829–6.275 intraday; the lows are gradually rising, showing clear signs of bullish control.
The support at 5.829 has held after two tests.
In the short term, the bias is bullish.
【Bullish Reasons】
The 24-hour gain of 3.48% aligns with the 7-day gain of 5.18%, indicating continuous capital inflow rather than a one-day spike.
After holding above 5.829, the next target is 6.275.
$INJ #INJ
5
·
--
【See Increase】
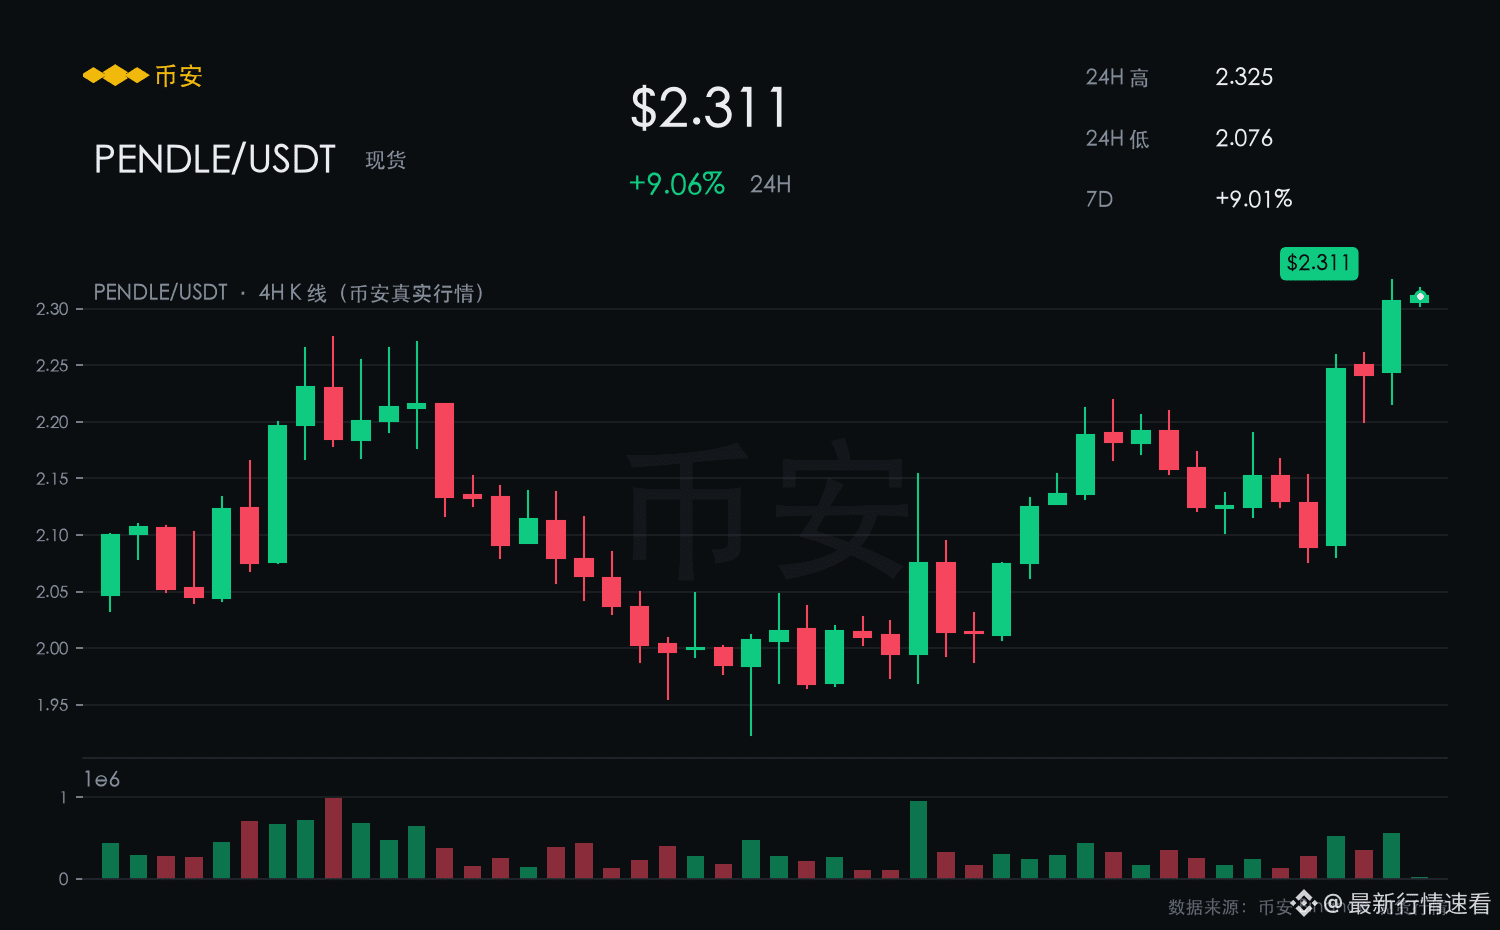
PENDLE is currently 2.311, up 9.06% over the past 24 hours, with a 7-day gain of 9.01%, ranging intraday from 2.076–2.325.
During the market’s bottoming phase, PENDLE can still stay green for the past 24 hours, indicating independent capital is propping it up.
As long as 2.076 holds, the current pullback can be considered a strong consolidation.
Bullish in the short term.
【Reasons for Bullishness】
A single-day gain of 9.06% isn’t extraordinary, but combined with the 7-day 9.01% slope, the trend is right.
Near-term resistance is at 2.325—if it breaks higher on increased volume, then follow along.
$PENDLE #PENDLE
【See Increase】
PENDLE is currently 2.311, up 9.06% over the past 24 hours, with a 7-day gain of 9.01%, ranging intraday from 2.076–2.325.
During the market’s bottoming phase, PENDLE can still stay green for the past 24 hours, indicating independent capital is propping it up.
As long as 2.076 holds, the current pullback can be considered a strong consolidation.
Bullish in the short term.
【Reasons for Bullishness】
A single-day gain of 9.06% isn’t extraordinary, but combined with the 7-day 9.01% slope, the trend is right.
Near-term resistance is at 2.325—if it breaks higher on increased volume, then follow along.
$PENDLE #PENDLE
PENDLE is currently 2.311, up 9.06% over the past 24 hours, with a 7-day gain of 9.01%, ranging intraday from 2.076–2.325.
During the market’s bottoming phase, PENDLE can still stay green for the past 24 hours, indicating independent capital is propping it up.
As long as 2.076 holds, the current pullback can be considered a strong consolidation.
Bullish in the short term.
【Reasons for Bullishness】
A single-day gain of 9.06% isn’t extraordinary, but combined with the 7-day 9.01% slope, the trend is right.
Near-term resistance is at 2.325—if it breaks higher on increased volume, then follow along.
$PENDLE #PENDLE
9
·
--
【Look for Gains】
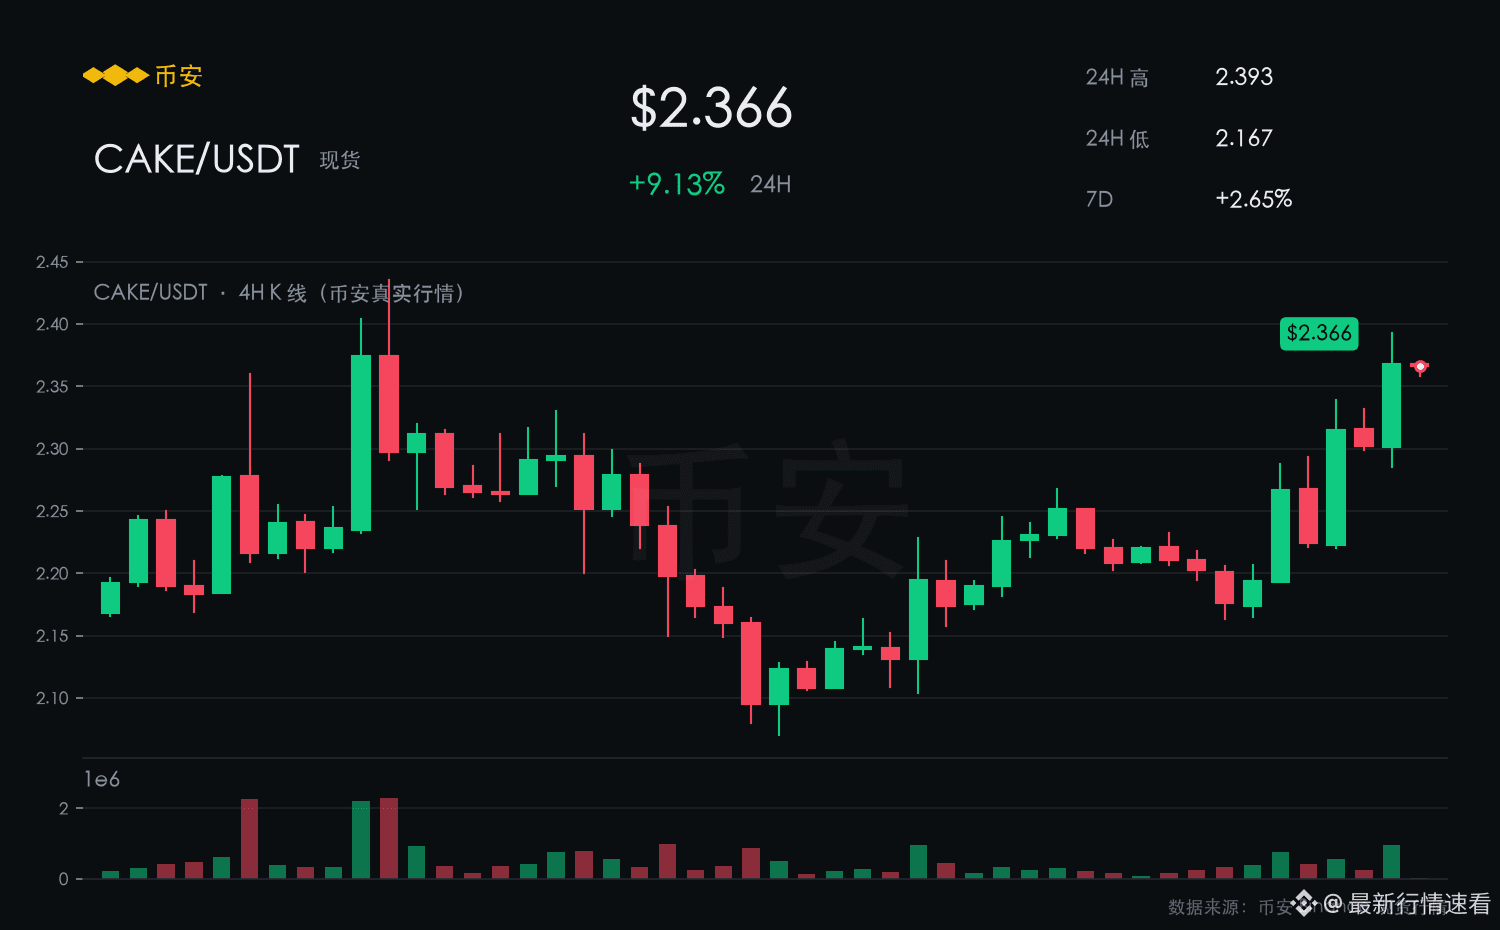
CAKE is currently reported at 2.365; up 9.09% over the past 24 hours, and up 2.60% over the past 7 days, with an intraday range of 2.167–2.393.
In a market where prices follow it down but don’t follow it up, CAKE is moving the opposite way—going green over 24 hours shows the attitude.
As long as 2.167 holds and isn’t lost, the current pullback counts as a strong consolidation.
In the short term, it’s leaning bullish.
【Bullish Reasons】
A 7-day gain of 2.60% is hard currency in today’s market conditions; pullbacks look more like accumulation.
For the rebound, first target the intraday high at 2.393—once that’s broken effectively, it will open up new room.
$CAKE #CAKE
【Look for Gains】
CAKE is currently reported at 2.365; up 9.09% over the past 24 hours, and up 2.60% over the past 7 days, with an intraday range of 2.167–2.393.
In a market where prices follow it down but don’t follow it up, CAKE is moving the opposite way—going green over 24 hours shows the attitude.
As long as 2.167 holds and isn’t lost, the current pullback counts as a strong consolidation.
In the short term, it’s leaning bullish.
【Bullish Reasons】
A 7-day gain of 2.60% is hard currency in today’s market conditions; pullbacks look more like accumulation.
For the rebound, first target the intraday high at 2.393—once that’s broken effectively, it will open up new room.
$CAKE #CAKE
CAKE is currently reported at 2.365; up 9.09% over the past 24 hours, and up 2.60% over the past 7 days, with an intraday range of 2.167–2.393.
In a market where prices follow it down but don’t follow it up, CAKE is moving the opposite way—going green over 24 hours shows the attitude.
As long as 2.167 holds and isn’t lost, the current pullback counts as a strong consolidation.
In the short term, it’s leaning bullish.
【Bullish Reasons】
A 7-day gain of 2.60% is hard currency in today’s market conditions; pullbacks look more like accumulation.
For the rebound, first target the intraday high at 2.393—once that’s broken effectively, it will open up new room.
$CAKE #CAKE
19
Log in to explore more content
Join global crypto users on Binance Square
⚡️ Get latest and useful information about crypto.
💬 Trusted by the world’s largest crypto exchange.
👍 Discover real insights from verified creators.
Email / Phone number
Trending Topics
BitcoinReboundsTo$79K
25 views
24 Discussing
🚨 $BTC is pushing higher.
Bitcoin is trading around $78,804, up roughly 1.9%, after reclaiming the $78K area. The next level to watch is the intraday high near $78,905.
A clean break above that level could open the way toward $79K–$80K. If BTC gets rejected, support sits around $78,300, then $77,975.
Bulls have momentum, but BTC needs to hold above $78K.
#Bitcoin #BTC #CryptoTrading #CryptoMarket #CryptoAnalysis
PulseON
·2 Likes
·716 views
FedHikeOddsRiseTo89%
42,519 views
763 Discussing
RLUSDSupplyHitsRecord$2.442B
1,810 views
36 Discussing