
Mike Aston villa
339 Posts

Mike Aston villa
Report
Block User
2 Following
0 Followers
2 Liked
Posts
All
Quotes
A new $ARB 24-hour low has appeared.
24h: -6.07%, current price: 0.1531, previous low: 0.1536.
Structurally, a new low means the bulls’ line of defense has been breached. First, watch whether a rebound can reclaim the previous low; if it can’t, weakness is likely to continue, while reclaiming it could signal a false breakdown. What key level do you have in mind?
A new $ARB 24-hour low has appeared.
24h: -6.07%, current price: 0.1531, previous low: 0.1536.
Structurally, a new low means the bulls’ line of defense has been breached. First, watch whether a rebound can reclaim the previous low; if it can’t, weakness is likely to continue, while reclaiming it could signal a false breakdown. What key level do you have in mind?
24h: -6.07%, current price: 0.1531, previous low: 0.1536.
Structurally, a new low means the bulls’ line of defense has been breached. First, watch whether a rebound can reclaim the previous low; if it can’t, weakness is likely to continue, while reclaiming it could signal a false breakdown. What key level do you have in mind?
53
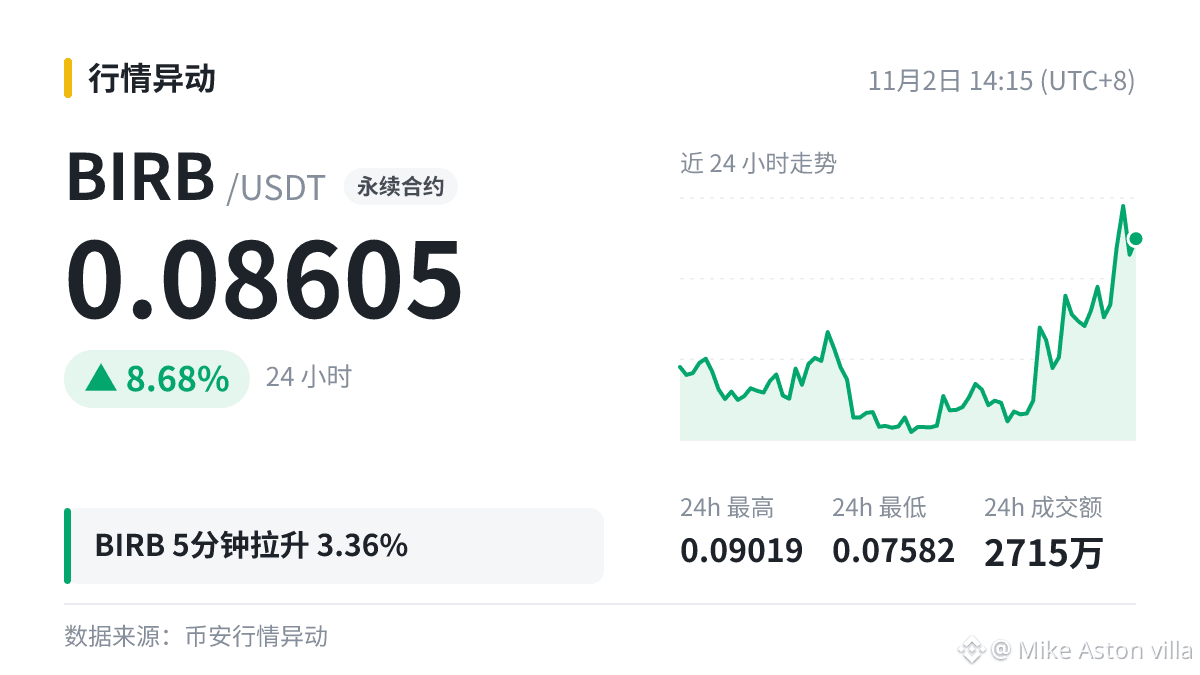
$BIRB 5-minute spike of 3.36%, at 0.08605, with a 24h range of 0.07582 ~ 0.09019.
The candle close matters more than the wick: a solid close means the direction is genuine.
Rising volume alongside price is healthy. If only the price is rising and trading volume isn't keeping up, the rally's staying power is questionable.
$BIRB 5-minute spike of 3.36%, at 0.08605, with a 24h range of 0.07582 ~ 0.09019.
The candle close matters more than the wick: a solid close means the direction is genuine.
Rising volume alongside price is healthy. If only the price is rising and trading volume isn't keeping up, the rally's staying power is questionable.
The candle close matters more than the wick: a solid close means the direction is genuine.
Rising volume alongside price is healthy. If only the price is rising and trading volume isn't keeping up, the rally's staying power is questionable.
3
More important than indicators is balance in life.
Trading is only one part of life; don't let it take up all your time.
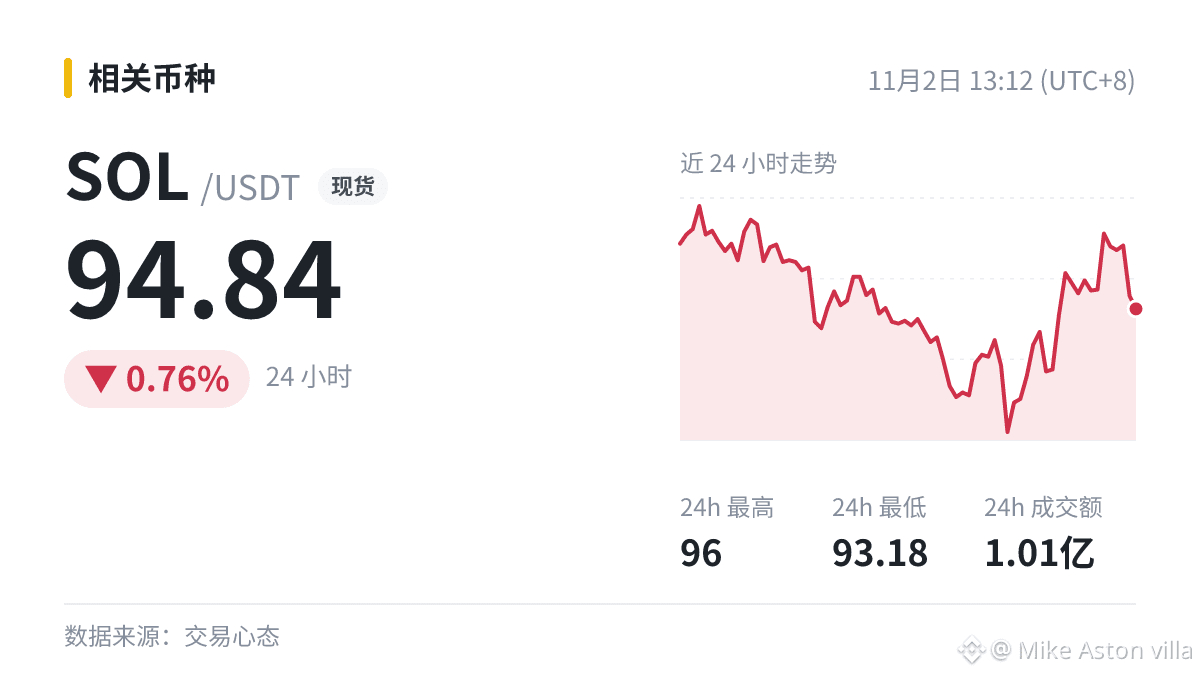
Let's check the market after chatting. $SOL Current price 94.84 (24h -0.76%).
#SOL
More important than indicators is balance in life.
Trading is only one part of life; don't let it take up all your time.
Let's check the market after chatting. $SOL Current price 94.84 (24h -0.76%).
#SOL
Trading is only one part of life; don't let it take up all your time.
Let's check the market after chatting. $SOL Current price 94.84 (24h -0.76%).
#SOL
The Square is discussing this topic: “Bitcoin spot ETFs saw net outflows of $203 million for the week”
It’s more prudent to reassess once the price retests support than to chase it the moment the news comes out.
$BTC 24h +1.21%
#BTC
The Square is discussing this topic: “Bitcoin spot ETFs saw net outflows of $203 million for the week”
It’s more prudent to reassess once the price retests support than to chase it the moment the news comes out.
$BTC 24h +1.21%
#BTC
It’s more prudent to reassess once the price retests support than to chase it the moment the news comes out.
$BTC 24h +1.21%
#BTC
1
⬇️ $WLD broke below the MA200 on the daily chart (0.3973); current price: 0.3903.
A sharp drop is often followed by a rebound, but a rebound doesn't mean a reversal. Is this a signal or just noise?
#WLD
⬇️ $WLD broke below the MA200 on the daily chart (0.3973); current price: 0.3903.
A sharp drop is often followed by a rebound, but a rebound doesn't mean a reversal. Is this a signal or just noise?
#WLD
A sharp drop is often followed by a rebound, but a rebound doesn't mean a reversal. Is this a signal or just noise?
#WLD
2
A reminder to yourself:
① Progress is usually slow, but it is happening.
② Each time you do it, put a check mark in your notebook.
$BNB Current price 713.08 (24h +1.36%)
A reminder to yourself:
① Progress is usually slow, but it is happening.
② Each time you do it, put a check mark in your notebook.
$BNB Current price 713.08 (24h +1.36%)
① Progress is usually slow, but it is happening.
② Each time you do it, put a check mark in your notebook.
$BNB Current price 713.08 (24h +1.36%)
2
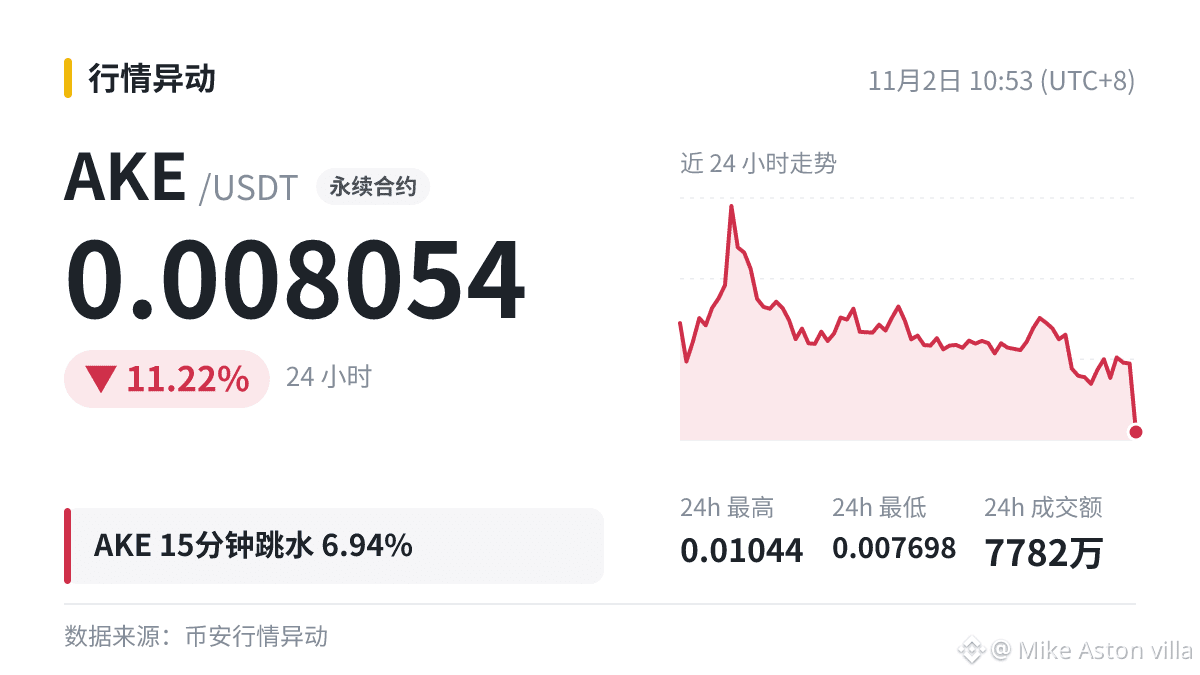
【$AKE Short-Term Decline Review】
1) The price fell 6.94% in 15 minutes, to 0.008054; 24h change: -11.22%.
2) The 24h low of 0.007698 is the nearest key support. A break below it could trigger a cascade of stop-losses.
3) 24h trading volume was $77.82 million. A high-volume decline suggests genuine selling pressure, while a low-volume decline may just reflect market sentiment.
Summary: The short-term outlook is bearish. Don’t rush to buy the dip—wait for a candlestick that signals the decline has stalled.
Are you bullish or bearish from here?
【$AKE Short-Term Decline Review】
1) The price fell 6.94% in 15 minutes, to 0.008054; 24h change: -11.22%.
2) The 24h low of 0.007698 is the nearest key support. A break below it could trigger a cascade of stop-losses.
3) 24h trading volume was $77.82 million. A high-volume decline suggests genuine selling pressure, while a low-volume decline may just reflect market sentiment.
Summary: The short-term outlook is bearish. Don’t rush to buy the dip—wait for a candlestick that signals the decline has stalled.
Are you bullish or bearish from here?
1) The price fell 6.94% in 15 minutes, to 0.008054; 24h change: -11.22%.
2) The 24h low of 0.007698 is the nearest key support. A break below it could trigger a cascade of stop-losses.
3) 24h trading volume was $77.82 million. A high-volume decline suggests genuine selling pressure, while a low-volume decline may just reflect market sentiment.
Summary: The short-term outlook is bearish. Don’t rush to buy the dip—wait for a candlestick that signals the decline has stalled.
Are you bullish or bearish from here?
2
$JCT Five consecutive bearish daily candles, down a cumulative 38.69%.
Let’s use this figure to talk about consecutive bearish candles on the daily chart.
Consecutive bullish or bearish candles on the daily chart are different from a run of same-colored candles on the 4-hour chart: each daily candle represents a full day of trading, so several consecutive candles of the same color are less common on the daily timeframe.
Runs of same-colored candles can also occur during sideways trading: several small-bodied daily candles may all be bullish or bearish, while the cumulative move remains limited. In that case, the consecutive run has limited significance.
The point of understanding an indicator is to be less intimidated by the numbers, not to use it to predict price movements.
$JCT Five consecutive bearish daily candles, down a cumulative 38.69%.
Let’s use this figure to talk about consecutive bearish candles on the daily chart.
Consecutive bullish or bearish candles on the daily chart are different from a run of same-colored candles on the 4-hour chart: each daily candle represents a full day of trading, so several consecutive candles of the same color are less common on the daily timeframe.
Runs of same-colored candles can also occur during sideways trading: several small-bodied daily candles may all be bullish or bearish, while the cumulative move remains limited. In that case, the consecutive run has limited significance.
The point of understanding an indicator is to be less intimidated by the numbers, not to use it to predict price movements.
Let’s use this figure to talk about consecutive bearish candles on the daily chart.
Consecutive bullish or bearish candles on the daily chart are different from a run of same-colored candles on the 4-hour chart: each daily candle represents a full day of trading, so several consecutive candles of the same color are less common on the daily timeframe.
Runs of same-colored candles can also occur during sideways trading: several small-bodied daily candles may all be bullish or bearish, while the cumulative move remains limited. In that case, the consecutive run has limited significance.
The point of understanding an indicator is to be less intimidated by the numbers, not to use it to predict price movements.
45
$BTC 78548.39|#FBI确认朝鲜应对币安被盗事件负责
Topics on the trending list change several times a day, but not many can really move coin prices.
$BTC 78548.39|#FBI确认朝鲜应对币安被盗事件负责
Topics on the trending list change several times a day, but not many can really move coin prices.
Topics on the trending list change several times a day, but not many can really move coin prices.
58
🚀 $FLOCK broke through the 0.04 level (for the first time in 3 days).
The current price is 0.03996, temporarily back below the level. Bulls and bears usually clash fiercely near key price levels; what matters is holding above it. Do you trust technical analysis or news more?
🚀 $FLOCK broke through the 0.04 level (for the first time in 3 days).
The current price is 0.03996, temporarily back below the level. Bulls and bears usually clash fiercely near key price levels; what matters is holding above it. Do you trust technical analysis or news more?
The current price is 0.03996, temporarily back below the level. Bulls and bears usually clash fiercely near key price levels; what matters is holding above it. Do you trust technical analysis or news more?
$SOLV 1-hour trading value rose to 19.1 times the average, while the price fell 6.36%.
After a volume spike, I look at three things:
1) Direction of the move: down
2) Whether the higher volume continues; a single volume spike can easily be a one-off
3) The high and low of the high-volume candlestick often become key short-term levels
Which way do you think it’ll go? Let me know.
#SOLV
$SOLV 1-hour trading value rose to 19.1 times the average, while the price fell 6.36%.
After a volume spike, I look at three things:
1) Direction of the move: down
2) Whether the higher volume continues; a single volume spike can easily be a one-off
3) The high and low of the high-volume candlestick often become key short-term levels
Which way do you think it’ll go? Let me know.
#SOLV
After a volume spike, I look at three things:
1) Direction of the move: down
2) Whether the higher volume continues; a single volume spike can easily be a one-off
3) The high and low of the high-volume candlestick often become key short-term levels
Which way do you think it’ll go? Let me know.
#SOLV
4
Market Notes|$ESPORTS
1h +5.6%, 4h +15.06%, 24h +83.25%
After a sharp rally, consolidation is usually steadier than continuing to surge.
Market Notes|$ESPORTS
1h +5.6%, 4h +15.06%, 24h +83.25%
After a sharp rally, consolidation is usually steadier than continuing to surge.
1h +5.6%, 4h +15.06%, 24h +83.25%
After a sharp rally, consolidation is usually steadier than continuing to surge.
18
Today's most discussed topic in the square: “Binance resumes withdrawals on the DOGE and OP networks”
$DOGE is currently trading at 0.07588. Peak popularity often coincides with the greatest disagreement. Which do you value more: technical analysis or sentiment?
#币安恢复DOGE及OP网络提现服务
Today's most discussed topic in the square: “Binance resumes withdrawals on the DOGE and OP networks”
$DOGE is currently trading at 0.07588. Peak popularity often coincides with the greatest disagreement. Which do you value more: technical analysis or sentiment?
#币安恢复DOGE及OP网络提现服务
$DOGE is currently trading at 0.07588. Peak popularity often coincides with the greatest disagreement. Which do you value more: technical analysis or sentiment?
#币安恢复DOGE及OP网络提现服务
6
A $BNB 24-hour new high has been established.
24h: +1.99%, current price: 714.5, previous high: 709.67.
Structurally, a new high means there is less selling pressure overhead, so short-term resistance is relatively low. But if the price quickly falls back below the previous high, beware of a false breakout. What do you think will happen next?
A $BNB 24-hour new high has been established.
24h: +1.99%, current price: 714.5, previous high: 709.67.
Structurally, a new high means there is less selling pressure overhead, so short-term resistance is relatively low. But if the price quickly falls back below the previous high, beware of a false breakout. What do you think will happen next?
24h: +1.99%, current price: 714.5, previous high: 709.67.
Structurally, a new high means there is less selling pressure overhead, so short-term resistance is relatively low. But if the price quickly falls back below the previous high, beware of a false breakout. What do you think will happen next?
1
$BTC Plaza Activity Watch: #FBI确认朝鲜应对币安被盗事件负责 , 127,000 views. Buzz comes before market movements, but doesn't determine their direction.
$BTC Plaza Activity Watch: #FBI确认朝鲜应对币安被盗事件负责 , 127,000 views. Buzz comes before market movements, but doesn't determine their direction.
1
$Q breached the 0.03 level.
Let's use this data to break down whole-number price levels.
Support and resistance are more like price ranges than prices precise to the decimal point. It's perfectly normal for prices to fluctuate back and forth around these levels.
When a price returns to a level after several days, people who entered around that level before may break even and exit or add to their positions, so trading activity often picks up.
Learning to read indicators is easy; the hard part is still following the rules when emotions are running high.
#Q
$Q breached the 0.03 level.
Let's use this data to break down whole-number price levels.
Support and resistance are more like price ranges than prices precise to the decimal point. It's perfectly normal for prices to fluctuate back and forth around these levels.
When a price returns to a level after several days, people who entered around that level before may break even and exit or add to their positions, so trading activity often picks up.
Learning to read indicators is easy; the hard part is still following the rules when emotions are running high.
#Q
Let's use this data to break down whole-number price levels.
Support and resistance are more like price ranges than prices precise to the decimal point. It's perfectly normal for prices to fluctuate back and forth around these levels.
When a price returns to a level after several days, people who entered around that level before may break even and exit or add to their positions, so trading activity often picks up.
Learning to read indicators is easy; the hard part is still following the rules when emotions are running high.
#Q
4
$AIN 4 hours: RSI is at 78, entering overbought territory.
While we’re on the subject, let’s talk about RSI.
“Overbought” means prices have risen a lot and quickly in recent days. It doesn’t mean too many people are buying, nor does it mean prices are about to fall.
When RSI enters the overbought or oversold zone, a more prudent response is to first consider the broader trend, recent price levels, and whether your position can withstand further volatility.
The same data can mean completely different things in different market conditions, so don’t blindly apply a rule of thumb.
#AIN
$AIN 4 hours: RSI is at 78, entering overbought territory.
While we’re on the subject, let’s talk about RSI.
“Overbought” means prices have risen a lot and quickly in recent days. It doesn’t mean too many people are buying, nor does it mean prices are about to fall.
When RSI enters the overbought or oversold zone, a more prudent response is to first consider the broader trend, recent price levels, and whether your position can withstand further volatility.
The same data can mean completely different things in different market conditions, so don’t blindly apply a rule of thumb.
#AIN
While we’re on the subject, let’s talk about RSI.
“Overbought” means prices have risen a lot and quickly in recent days. It doesn’t mean too many people are buying, nor does it mean prices are about to fall.
When RSI enters the overbought or oversold zone, a more prudent response is to first consider the broader trend, recent price levels, and whether your position can withstand further volatility.
The same data can mean completely different things in different market conditions, so don’t blindly apply a rule of thumb.
#AIN
26
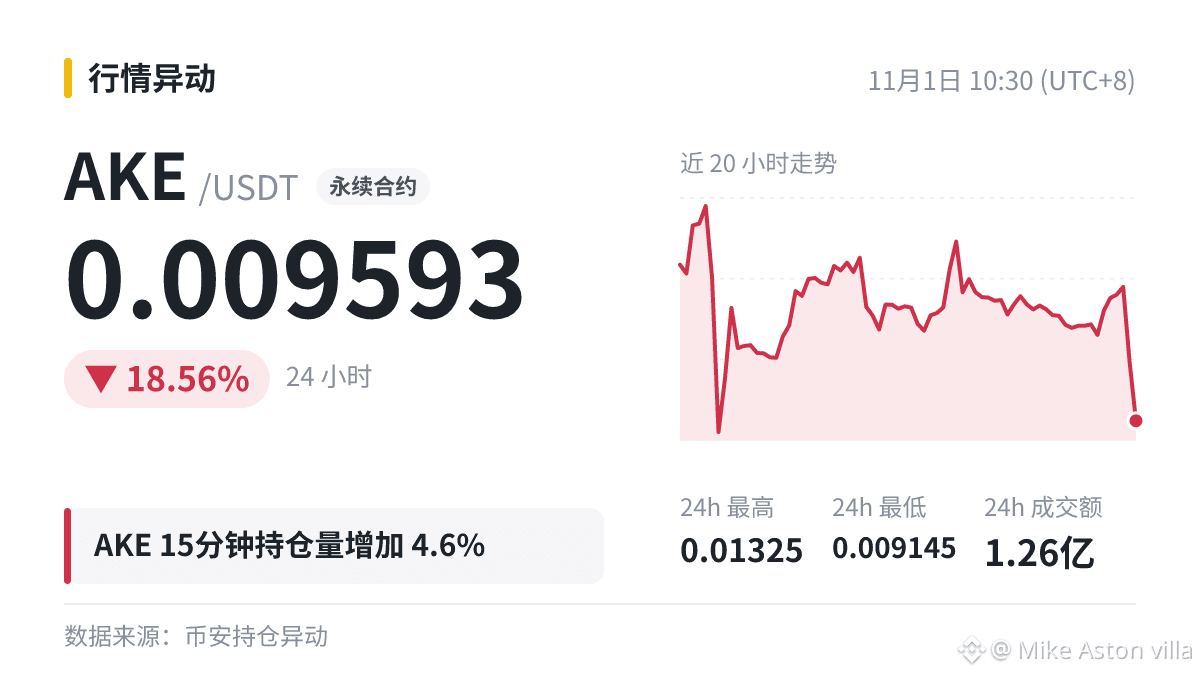
Looking only at price means missing half the picture. $AKE 15-minute open interest: +4.6%; price: -8.73%. Compare the two:
Rising open interest, falling price: new shorts are entering.
As open interest keeps climbing, watch whether the funding rate is rising too. Which side do you choose—long or short?
Looking only at price means missing half the picture. $AKE 15-minute open interest: +4.6%; price: -8.73%. Compare the two:
Rising open interest, falling price: new shorts are entering.
As open interest keeps climbing, watch whether the funding rate is rising too. Which side do you choose—long or short?
Rising open interest, falling price: new shorts are entering.
As open interest keeps climbing, watch whether the funding rate is rising too. Which side do you choose—long or short?
32
Log in to explore more content
Join global crypto users on Binance Square
⚡️ Get latest and useful information about crypto.
💬 Trusted by the world’s largest crypto exchange.
👍 Discover real insights from verified creators.
Email / Phone number
Trending Topics
USMidterms-WhatAreMarketsExpecting?
28,175 views
381 Discussing
Democratic Congressional Sweep Shakes Trump Trades in AI Stocks and Crypto
Binance News
·3 Likes
·1.6k views
USOctoberNFP-AreRateCutsStillPossible
212,788 views
1,676 Discussing
AMDBeatsExpectations-AINarrativeContinues
4,326 views
140 Discussing