

SnEmroz
Crypto Trader | Scalper | Challenge Master Sharing smart setups & Trade Psychology | Quality - Quantity I DYOR I (X- Marks_BTC )
32 Following
8.7K+ Followers
9.5K+ Liked
Posts
All
Quotes


SnEmroz
·
--
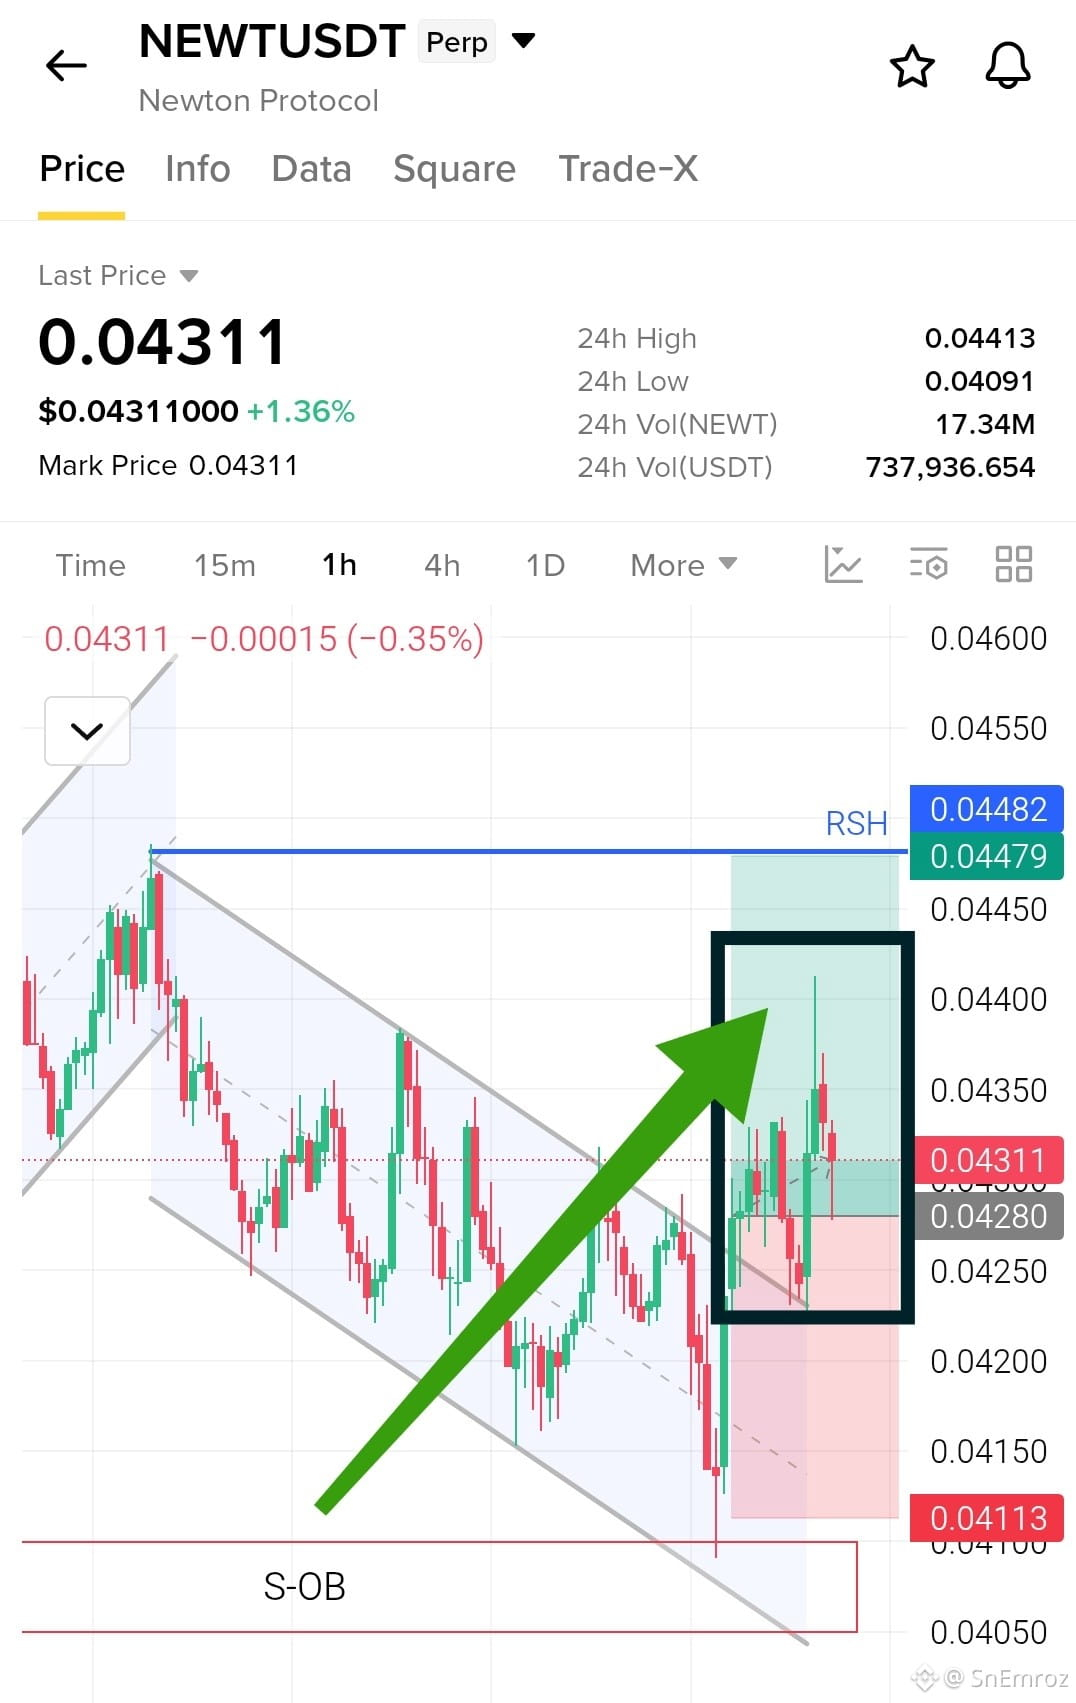
Bullish$NEWT Long Setup 1h Chart🟢
🔶 Bull Flag pattern
Price ran up in a rising channel and then slid in a falling channel, which forms the flag. It swept down to the 0.0409 low and buyers took it back fast with a long wick. Price has now pushed above the top of the flag with a green candle. If it holds above 0.0425 the way opens to 0.0448, where the flag started. If price loses 0.04113 the setup is gone.
🟢Long Entry 0.04278
✅ Take Profits
TP1 0.04350
TP2 0.04420
TP3 0.04479
❌ Stop Loss 0.04113
#newt
🔶 Bull Flag pattern
Price ran up in a rising channel and then slid in a falling channel, which forms the flag. It swept down to the 0.0409 low and buyers took it back fast with a long wick. Price has now pushed above the top of the flag with a green candle. If it holds above 0.0425 the way opens to 0.0448, where the flag started. If price loses 0.04113 the setup is gone.
🟢Long Entry 0.04278
✅ Take Profits
TP1 0.04350
TP2 0.04420
TP3 0.04479
❌ Stop Loss 0.04113
#newt
SnEmroz
·
--
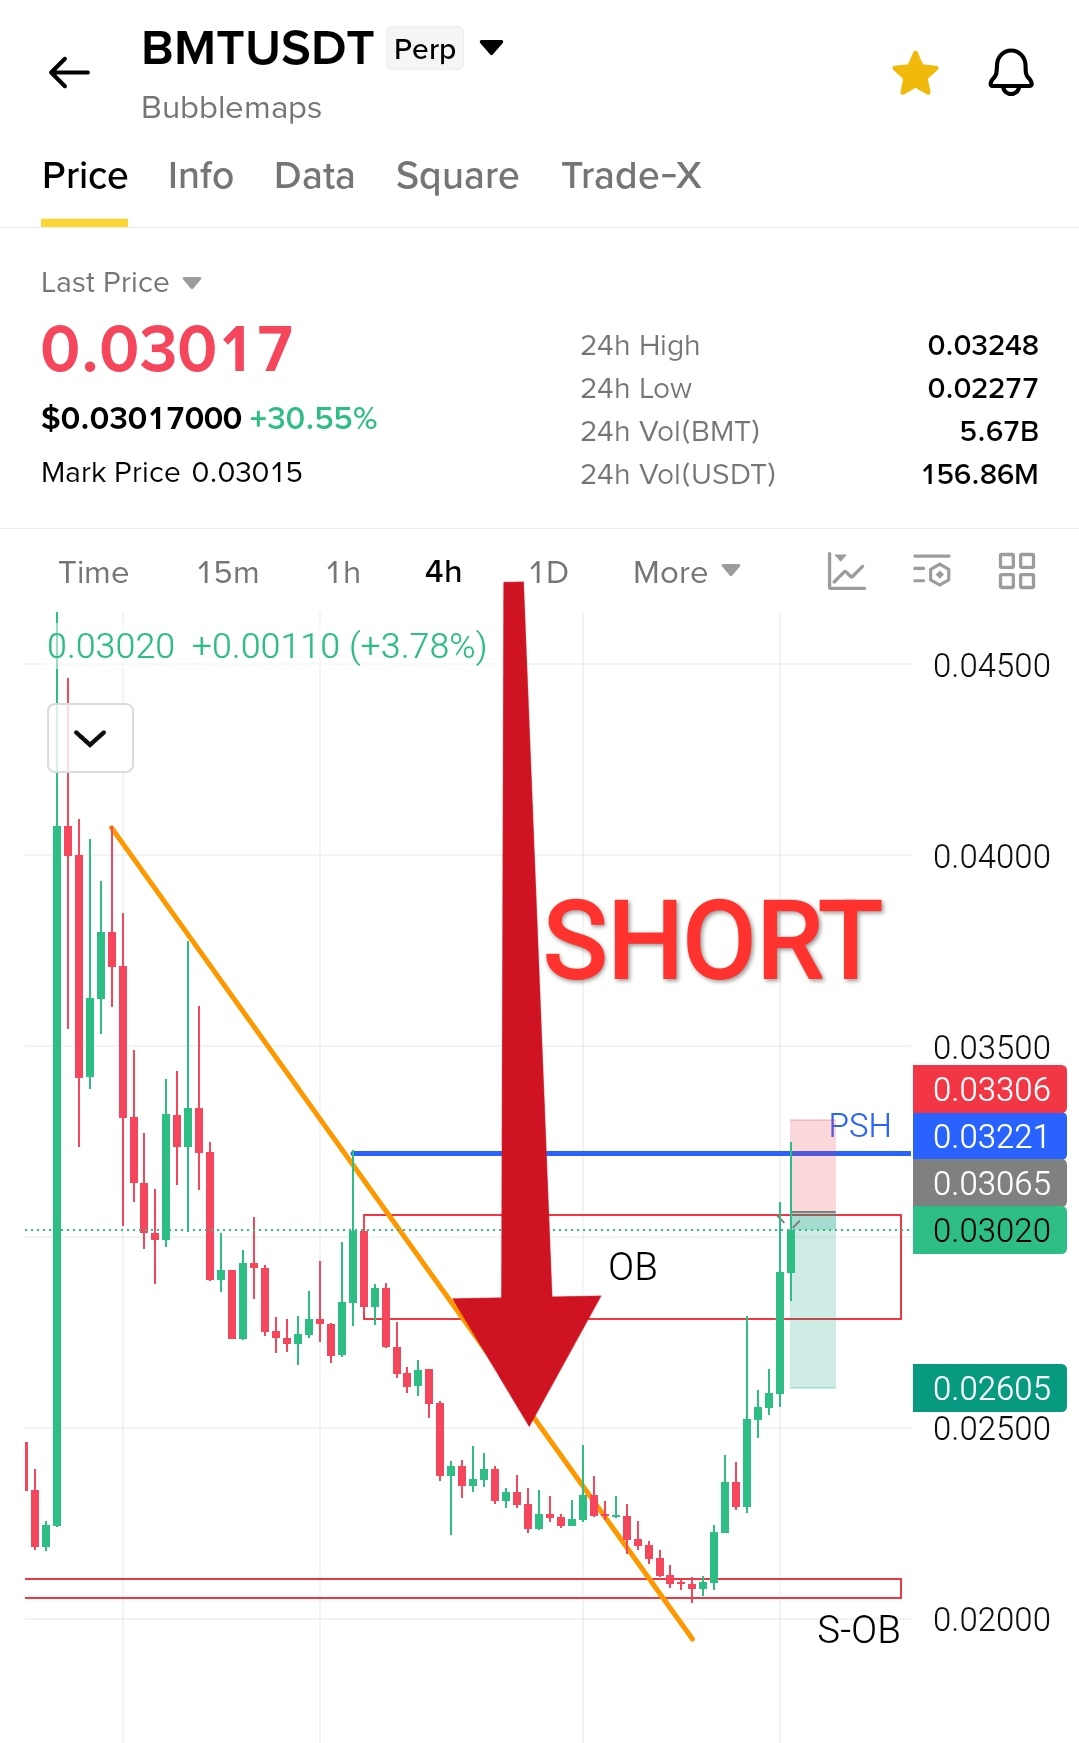
Bearish$BMT Short Setup 4h Chart🔴
🔶 Order Block rejection at PSH
Price broke the falling trendline and bounced hard from the S-OB support near 0.0205, up about 45%. It is now pushing into the OB zone where sellers acted before. The latest wick swept above the PSH at 0.0322 and got rejected, which looks like a liquidity grab. The move is stretched after a 30% pump today. If price stays under 0.0322, a drop toward 0.0290 and then 0.0275 is likely. A 4h close above 0.0331 breaks the setup.
🔴Short Entry 0.03020
✅ Take Profits
TP1 0.02900
TP2 0.02750
TP3 0.02605
❌ Stop Loss 0.03306
#bmt
🔶 Order Block rejection at PSH
Price broke the falling trendline and bounced hard from the S-OB support near 0.0205, up about 45%. It is now pushing into the OB zone where sellers acted before. The latest wick swept above the PSH at 0.0322 and got rejected, which looks like a liquidity grab. The move is stretched after a 30% pump today. If price stays under 0.0322, a drop toward 0.0290 and then 0.0275 is likely. A 4h close above 0.0331 breaks the setup.
🔴Short Entry 0.03020
✅ Take Profits
TP1 0.02900
TP2 0.02750
TP3 0.02605
❌ Stop Loss 0.03306
#bmt
Log in to explore more content