

Sadaf shahbaz
2.6k Posts

Sadaf shahbaz
Report
Block User
Crypto Trader & Market Analyst | Daily market insights, price action & smart money concepts | Education over hype
Open Trade

XRP Holder
Occasional Trader
2.1 Years
25 Following
402 Followers
2.6K+ Liked
Posts
Portfolio
All
Quotes
·
--
🚨 PCE DATA ALERT — VOLATILITY INCOMING! ⚡📊
Today’s PCE inflation data could trigger the next major move in the crypto market!
🎯 Expected PCE: 3.6%
📉 If PCE comes in ABOVE 3.6%:
Higher inflation could increase selling pressure and push crypto prices lower.
🚀 If PCE comes in AT OR BELOW 3.6%:
Markets could react positively, potentially triggering a short squeeze across crypto.
👀 Keep an eye on $AIN , $BEAT and $IDOL — volatility could create some interesting opportunities!
Which way are you betting: DUMP 📉 or SQUEEZE 🚀? Drop your thoughts below! 👇
#PCE #FedWatch #CryptoMarket #cryptotrading
⚠️ Market expectations are not guaranteed outcomes. Trade carefully and DYOR.

604
·
--
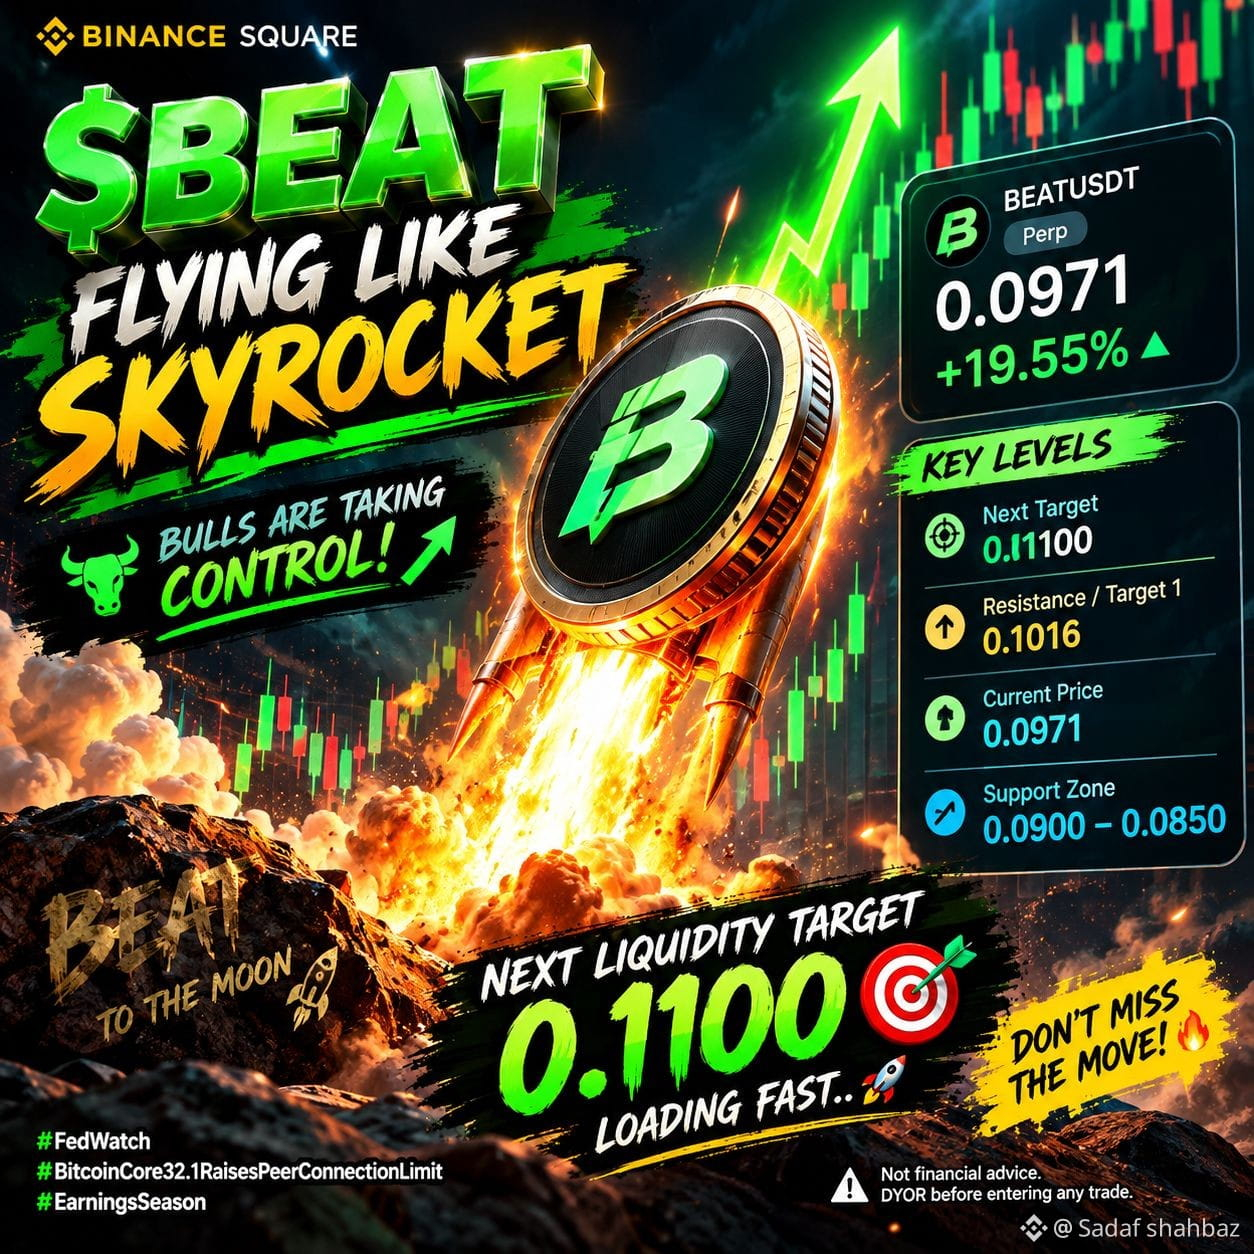
🚀 $BEAT | Bulls Are Taking Control! 🟢🔥
$BEAT is showing strong bullish momentum! 💥 After climbing from 0.0746 to 0.1016 USDT, the price is now trading around 0.0971 USDT, up +19.55% in 24 hours. 📈
🎯 Key Levels I'm Watching:
🟢 Current Price: 0.0971 USDT
🚀 Resistance / Target 1: 0.1016 USDT
🔥 Next Target: 0.1100 USDT
📊 Support Zone: 0.0900–0.0850 USDT
Can $BEAT break above 0.1016 and make a run toward 0.1100? 👀
Momentum looks promising, but watch for profit-taking and a possible pullback before chasing the move. Always manage your risk.
💬 Are you bullish on $BEAT, or expecting a correction first? Drop your thoughts below! 👇
#BEAT #CryptoTrading #FedWatch #BitcoinCore #EarningsSeason
🚀 $BEAT | Bulls Are Taking Control! 🟢🔥
$BEAT is showing strong bullish momentum! 💥 After climbing from 0.0746 to 0.1016 USDT, the price is now trading around 0.0971 USDT, up +19.55% in 24 hours. 📈
🎯 Key Levels I'm Watching:
🟢 Current Price: 0.0971 USDT
🚀 Resistance / Target 1: 0.1016 USDT
🔥 Next Target: 0.1100 USDT
📊 Support Zone: 0.0900–0.0850 USDT
Can $BEAT break above 0.1016 and make a run toward 0.1100? 👀
Momentum looks promising, but watch for profit-taking and a possible pullback before chasing the move. Always manage your risk.
💬 Are you bullish on $BEAT , or expecting a correction first? Drop your thoughts below! 👇
#BEAT #CryptoTrading #FedWatch #BitcoinCore #EarningsSeason
40
·
--
🚀 Boooooooom 💥
Trending Token
$IDOL +66.82% 🔥
IDOLUSDT
Perp
0.014113
+66.82%
🚀 Boooooooom 💥
Trending Token
$IDOL +66.82% 🔥
IDOLUSDT
Perp
0.014113
+66.82%
Trending Token
$IDOL +66.82% 🔥
IDOLUSDT
Perp
0.014113
+66.82%
125
·
--
🚨 BITCOIN PUSHES PAST $80,992! 🚀
Crypto clawed back some ground on Oct 28. $BTC is at $80,992 (+1.56%) and $ETH is up to $2,356 (+2.18%). 📈
But the mood is cautious ⏳ All eyes are on the Fed's rate decision.
📊$ BTC 24h range: $79,506 – $81,300
📊 ETH 24h range: $2,297 – $2,369
💡 Rate cuts tend to fuel risk assets. Will today be the spark?
🤔 Bullish or bearish after the Fed? Drop your call below! 👇
#Bitcoin #Ethereum #Binance #FedDecision #BinanceSquare

101
·
--
$PEPE Technical Analysis | 4H Chart 📈
PEPE is currently trading at 0.00000452 USDT, up +3.20% in the last 24 hours. The price has crossed above all three key moving averages (MA7, MA25, and MA99), signaling emerging bullish momentum.
📊 Key Technical Levels
🟢 Support: 0.00000425 — a key support zone aligned with MA99and the 24H low.
🔴 Resistance: 0.00000459 (24H high), followed by 0.00000486 and 0.00000511.
📈 RSI(6): 73.6 — Buying pressure is strong, but with RSI approaching the overbought zone, a minor pullback remains possible.
💰 24H Trading Volume: 25.28M USDT — Market interest remains strong.
🔥 Will $PEPE break above 0.00000459 and continue its bullish run, or will sellers trigger a pullback?
🔥 Will $PEPE break above 0.00000459 and continue its bullish run, or will sellers trigger a pullback?
Share your thoughts in the comments! 👇
#PEPE #PEPEArmy #CryptoAnalysis #TechnicalAnalysis

95
·
--
🚀 $AIN LONG SETUP — MASSIVE 2.8X+ MOVE! 🔥
We spotted $AIN near $0.045–$0.047, and look where it is now! 🤯
📈 Current Price: $0.12936 (+227.66%)
🎯 Our Targets: $0.052 → $0.060 → $0.070 — ALL HIT!
💥 24H High: $0.13250
📊 Massive volume confirms explosive momentum!
$AIN has delivered an incredible move, but RSI near 100 signals extreme overbought conditions. Stay alert for volatility and avoid chasing blindly.
Who caught this rally with us? 👇
#AIN #BinanceSquare #Altcoins #DYOR

416
·
--
🚀 $QNT Eyes $300! 🔥
$QNT/USDT Perp is surging at $214.73 (+16.76%)! 📈 Bullish momentum is building, and $300 is the next big target on my radar. 🎯
Can $QNT make another explosive move? 👀💚
#QNT #crypto #BinanceSquare #cpi
⚠️ Speculative outlook — NFA. DYOR.
🚀 $QNT Eyes $300! 🔥
$QNT /USDT Perp is surging at $214.73 (+16.76%)! 📈 Bullish momentum is building, and $300 is the next big target on my radar. 🎯
Can $QNT make another explosive move? 👀💚
#QNT #crypto #BinanceSquare #cpi
⚠️ Speculative outlook — NFA. DYOR.
$QNT /USDT Perp is surging at $214.73 (+16.76%)! 📈 Bullish momentum is building, and $300 is the next big target on my radar. 🎯
Can $QNT make another explosive move? 👀💚
#QNT #crypto #BinanceSquare #cpi
⚠️ Speculative outlook — NFA. DYOR.

225
·
--
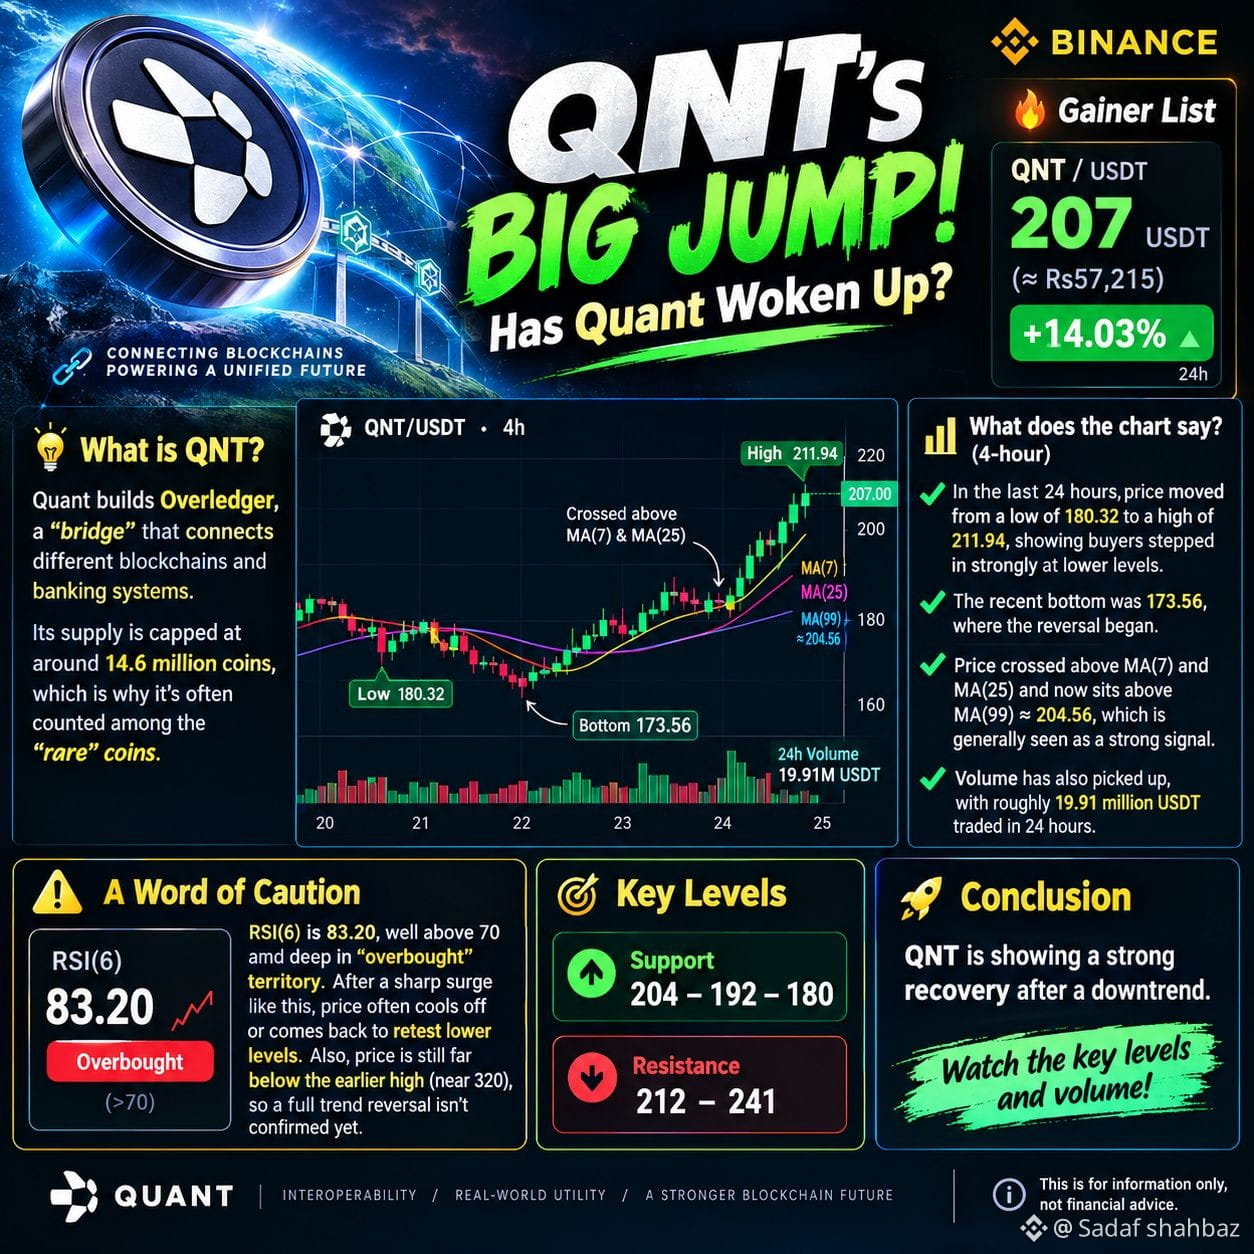
🚀 QNT's Big Jump: Has Quant Woken Up?
Today, Quant ($QNT ) is among the most-watched coins on Binance. The price is 207 USDT (about Rs57,215), up +14.03% in 24 hours, which has landed it on the "Gainer" list.
What is $QNT ?
Quant builds Overledger, a "bridge" that connects different blockchains and banking systems. Its supply is capped at roughly 14.6 million coins, which is why it's often counted among the "rare" coins.
What does the chart say? (4-hour)
In the last 24 hours, price moved from a low of 180.32 to a high of 211.94, showing buyers stepped in strongly at lower levels.
The recent bottom was 173.56, where the reversal began.
Price crossed above MA(7) and MA(25) and now sits above MA(99) ≈ 204.56, which is generally seen as a strong signal.
Volume has also picked up, with roughly 19.91 million USDT traded in 24 hours.
⚠️ A Word of Caution
RSI(6) is 83.20, well above 70 and deep in "overbought" territory. After a sharp surge like this, price often cools off or comes back to retest lower levels. Also, price is still far below the earlier high (near 320), so a full trend reversal isn't confirmed yet.
Key Levels
🟢 Support: 204 – 192 – 180
🔴 Resistance: 212 – 241
Conclusion
$QNT is showing a strong recovery after a downtrend.
This is for information only, not financial advice.
2
423
·
--
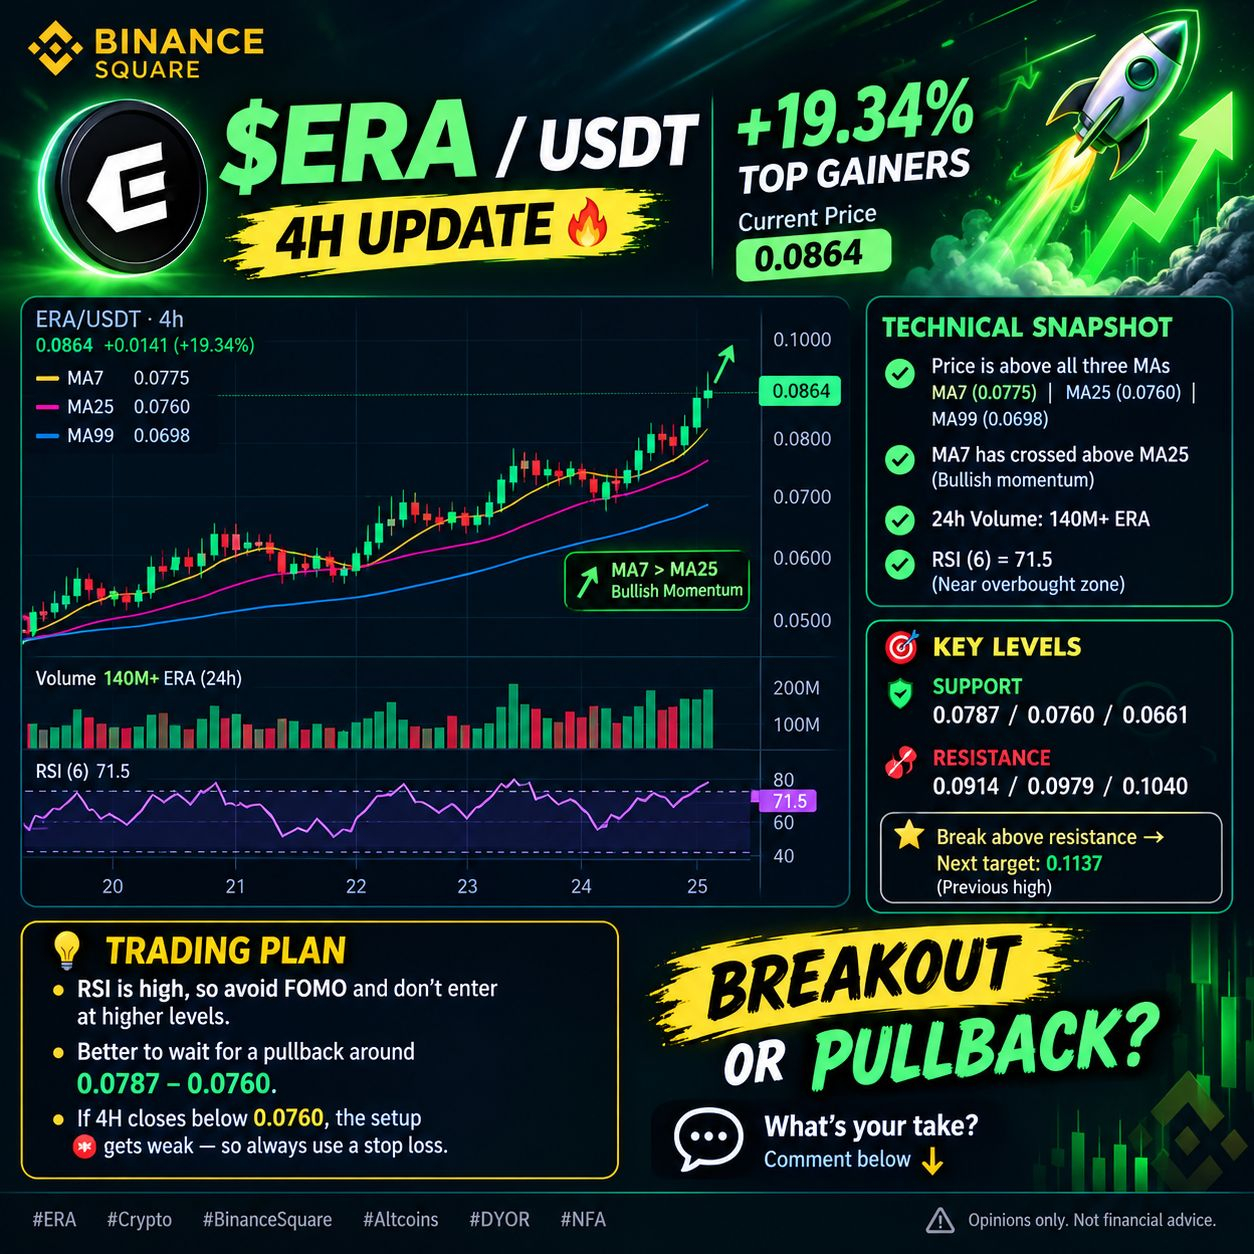
🚀 $ERA / USDT – Bullish Momentum Building! 🔥
$ERA is up +19.34%, trading at 0.0864 USDT on the 4H chart.
📊 Bullish Signals:
✅ Price is above MA7 (0.0775), MA25 (0.0760) and MA99 (0.0698).
✅ MA7 has crossed above MA25, signaling bullish momentum.
✅ 24H volume exceeds 140M ERA.
⚠️ RSI(6) at 71.5 — approaching overbought territory.
🎯 Key Levels
- Support: 0.0787 / 0.0760 / 0.0661
- Resistance: 0.0914 / 0.0979 / 0.1040
- Next Target: 0.1137 if resistance breaks.
🧠 Trading Plan: Avoid FOMO at higher prices. Watch for a pullback toward 0.0787–0.0760. A 4H close below 0.0760 could weaken the setup. Always manage risk with a stop-loss.
💬 What’s next for $ERA — breakout to 0.1137 or a healthy pullback? Share your view below! 👇
#ERA #Crypto #BinanceSquare #TradingSetup #NFA
Opinions only. Not financial advice.
173
·
--
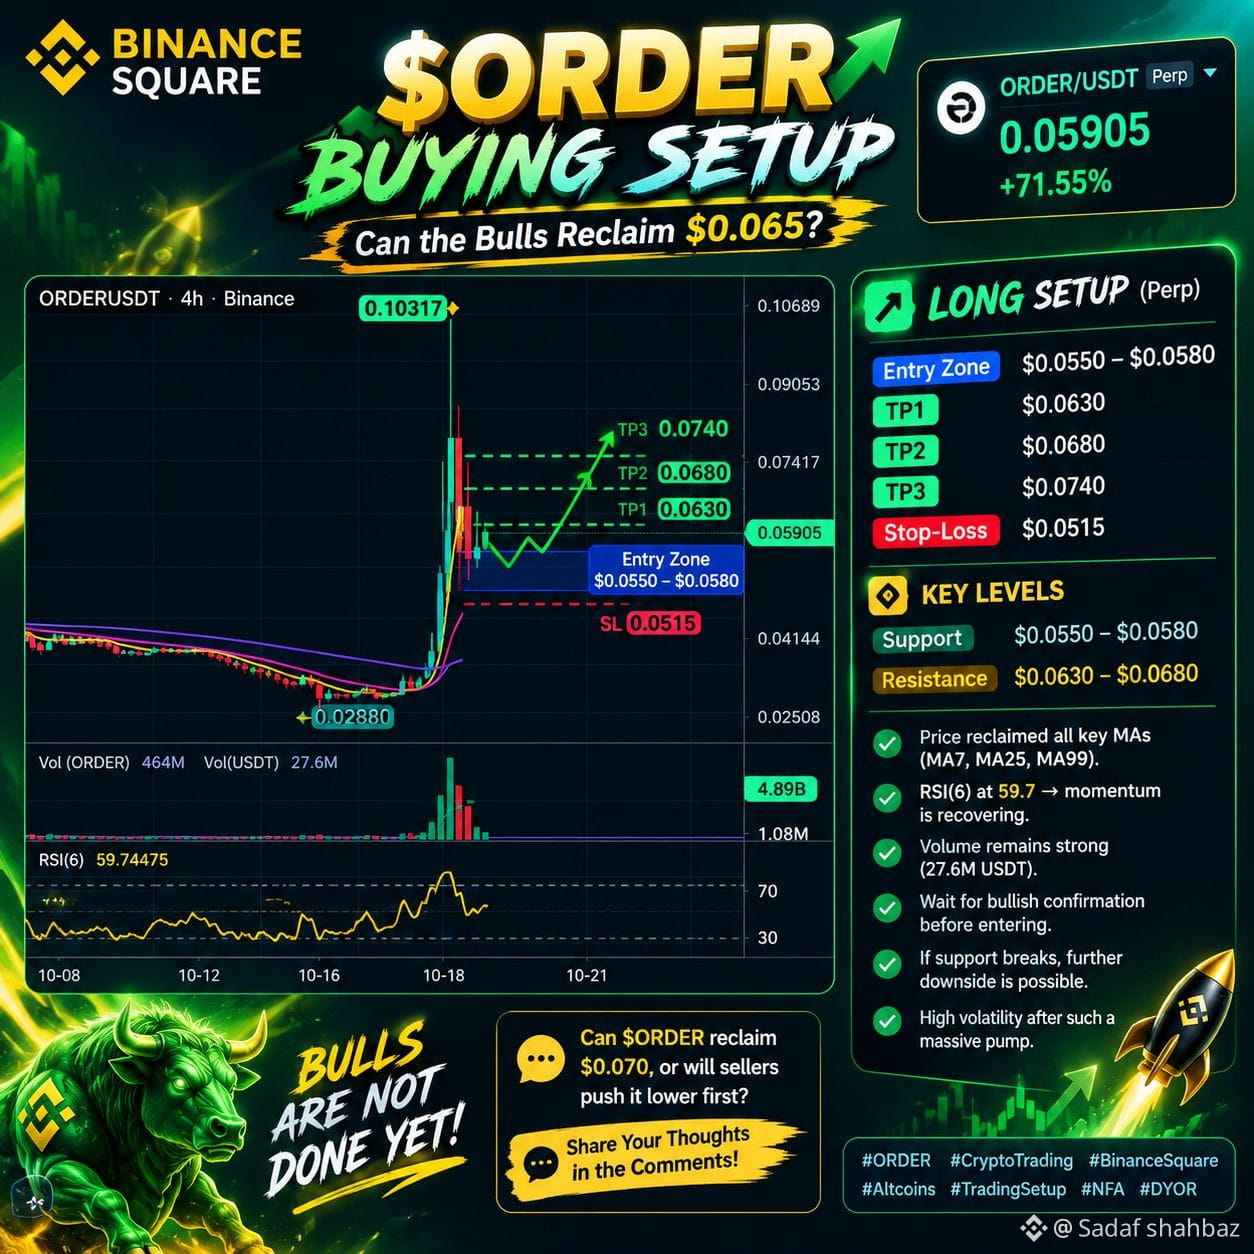
🚀 $ORDER BUYING SETUP — Can the Bulls Reclaim $0.065? 🔥
$ORDER/USDT is trading at $0.05905 (+71.55%) after an explosive breakout to $0.10317. Price is now consolidating, while RSI(6) near 59.7 suggests momentum is recovering after the sharp pullback.
📊 Potential Long Setup (Perp)
- Entry Zone: $0.0550–$0.0580
- TP1: $0.0630
- TP2: $0.0680
- TP3: $0.0740
- Stop-Loss: $0.0515
🎯 Key Levels: Support at $0.0550–$0.0580 | Resistance at $0.0630–$0.0680.
⚠️ Wait for bullish confirmation before entering. If support breaks, further downside is possible. After such a massive pump, volatility remains high.
🔥 Question: Can $ORDER reclaim $0.070, or will sellers push it lower first?
#cryptotrading #BİNANCESQUARE #Altcoins #TradingSetup #NFA
🚀 $ORDER BUYING SETUP — Can the Bulls Reclaim $0.065? 🔥
$ORDER /USDT is trading at $0.05905 (+71.55%) after an explosive breakout to $0.10317. Price is now consolidating, while RSI(6) near 59.7 suggests momentum is recovering after the sharp pullback.
📊 Potential Long Setup (Perp)
- Entry Zone: $0.0550–$0.0580
- TP1: $0.0630
- TP2: $0.0680
- TP3: $0.0740
- Stop-Loss: $0.0515
🎯 Key Levels: Support at $0.0550–$0.0580 | Resistance at $0.0630–$0.0680.
⚠️ Wait for bullish confirmation before entering. If support breaks, further downside is possible. After such a massive pump, volatility remains high.
🔥 Question: Can $ORDER reclaim $0.070, or will sellers push it lower first?
#cryptotrading #BİNANCESQUARE #Altcoins #TradingSetup #NFA
59
·
--
$TREE (Treehouse) Explosive Breakout! 🚀🌳
$TREE/USDT just delivered a powerful move. Price is at 0.0567, up 45%+ in 24 hours, and it's sitting among the top gainers.
📊 Technical Snapshot (4H Chart):
✅ Price reclaimed MA(7), MA(25) and MA(99) in a single sharp push
✅ Strong recovery from the 0.0351 low, with a 24h high of 0.0616
✅ Unusual volume spike on the 4H chart, which doesn't look like a routine move
⚠️ RSI(6) is near 96, deep in overbought territory. A pullback or consolidation here would be perfectly normal
💡 Fundamentals:
Market Cap: ~$26.7M (rank ~599)
Fully Diluted Value: ~$58.8M
24h Volume: ~$89.6M, over 300% of market cap
Circulating Supply: 455M / Max 1B
A small market cap paired with this much volume shows traders have clearly turned their attention to it.
🎯 Levels to Watch:
Support: 0.0513 / 0.0454
Resistance: 0.0616. A confirmed close above could fuel further momentum
🧠 Key Takeaway: After a vertical pump like this, don't chase in FOMO. Wait for a retracement, always use a stop-loss, and manage your own risk.
🗣️ What's your take?
Will $TREE break 0.0616 and print a new high, or do we see a retest of 0.0454 first? 👇
Drop your prediction in the comments! 🔥
👍 If you found this useful, Like and Follow for more breakdowns like this!
#TREE #Treehouse #Binance #Breakout
$TREE (Treehouse) Explosive Breakout! 🚀🌳
$TREE /USDT just delivered a powerful move. Price is at 0.0567, up 45%+ in 24 hours, and it's sitting among the top gainers.
📊 Technical Snapshot (4H Chart):
✅ Price reclaimed MA(7), MA(25) and MA(99) in a single sharp push
✅ Strong recovery from the 0.0351 low, with a 24h high of 0.0616
✅ Unusual volume spike on the 4H chart, which doesn't look like a routine move
⚠️ RSI(6) is near 96, deep in overbought territory. A pullback or consolidation here would be perfectly normal
💡 Fundamentals:
Market Cap: ~$26.7M (rank ~599)
Fully Diluted Value: ~$58.8M
24h Volume: ~$89.6M, over 300% of market cap
Circulating Supply: 455M / Max 1B
A small market cap paired with this much volume shows traders have clearly turned their attention to it.
🎯 Levels to Watch:
Support: 0.0513 / 0.0454
Resistance: 0.0616. A confirmed close above could fuel further momentum
🧠 Key Takeaway: After a vertical pump like this, don't chase in FOMO. Wait for a retracement, always use a stop-loss, and manage your own risk.
🗣️ What's your take?
Will $TREE break 0.0616 and print a new high, or do we see a retest of 0.0454 first? 👇
Drop your prediction in the comments! 🔥
👍 If you found this useful, Like and Follow for more breakdowns like this!
#TREE #Treehouse #Binance #Breakout

88
·
--
🚀 $BMT Explodes — Bulls Are Back in Action! 🔥
$BMT is showing massive bullish momentum on the 4H chart, surging from $0.01564 to a high of $0.05144. Now trading around $0.03820 (+59%), with volume heating up.
📊 Support: $0.037–$0.038
🎯 Resistance: $0.045–$0.051
Holding support could open the door to another move higher, but after this explosive rally, a pullback is also possible. I’m watching for a confirmed retest before entering. 👀
Can $BMT break $0.05 again? 🔥
#BMT #Crypto #BinanceSquareFamily #Altcoins #DYOR

150
·
--
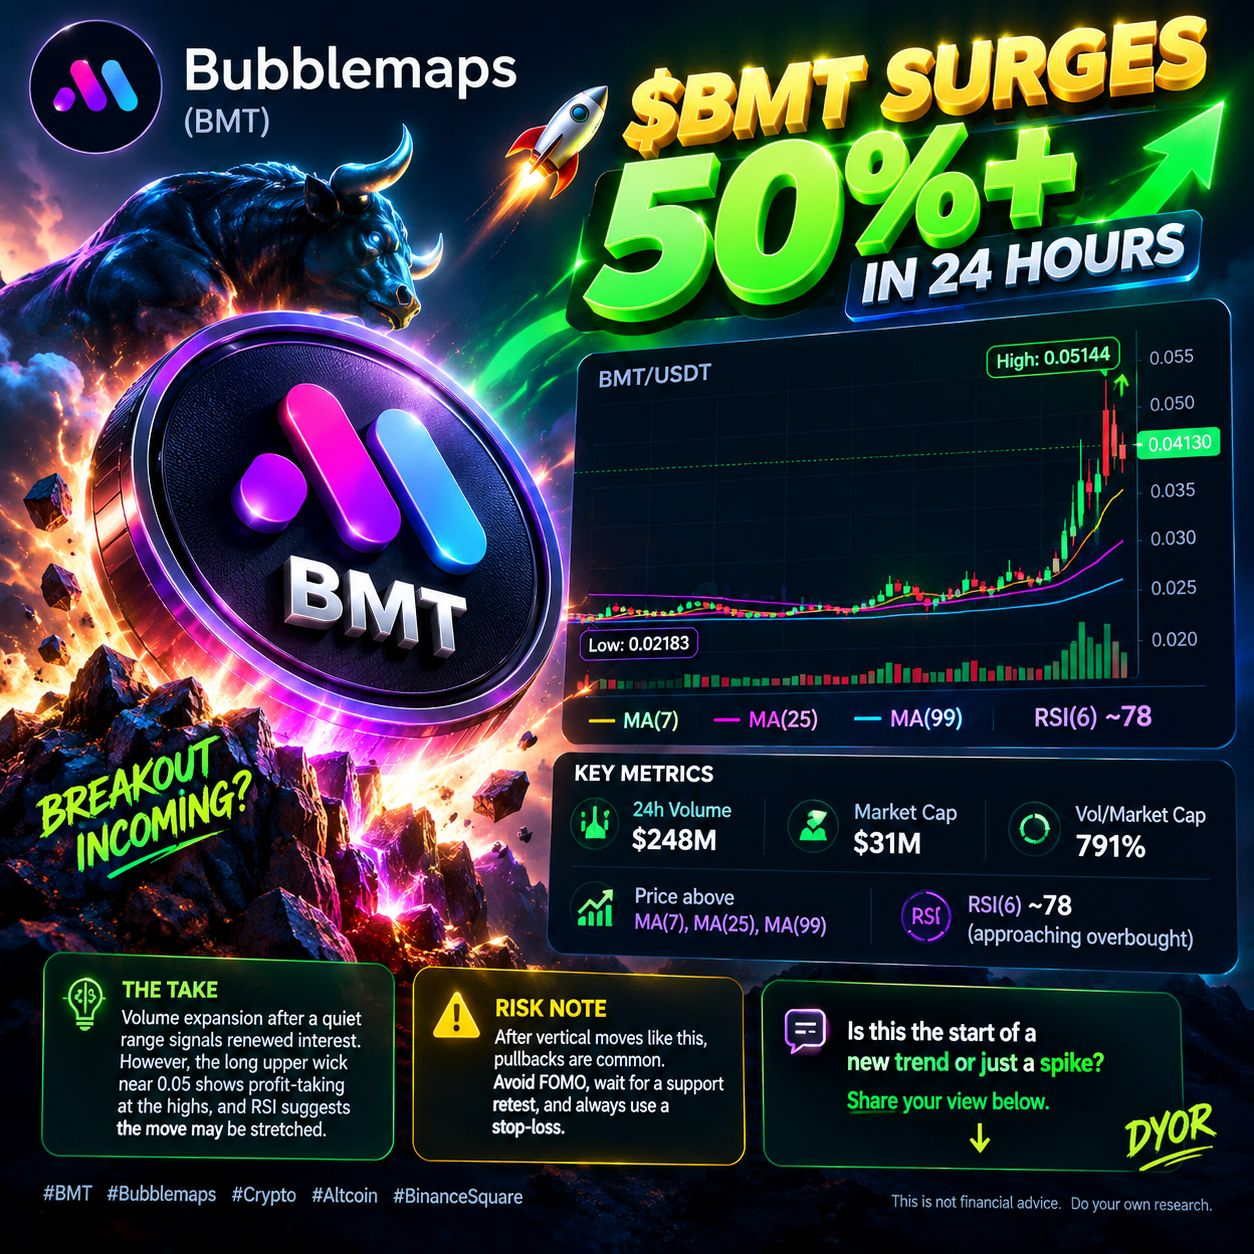
🚀 $BMT Surges 50%+ in 24 Hours
Bubblemaps ($BMT ) has broken out of a multi-day consolidation, spiking from 0.02183 to a high of 0.05144 before settling near 0.0413 (+53%).
📊 Key Metrics
• 24h Volume: $248M vs. Market Cap: $31M
• Vol/Market Cap Ratio: 791%
• Price now trades above MA(7), MA(25), and MA(99)
• RSI(6): ~78, approaching overbought territory
🧠 Take
The volume expansion after a quiet range signals renewed interest. However, the long upper wick near 0.05 shows profit-taking at the highs, and RSI suggests the move may be stretched.
⚠️ Risk Note
After vertical moves like this, pullbacks are common. Avoid FOMO, wait for a support retest, and always use a stop-loss.
💬 Is this the start of a new trend or just a spike? Share your view below. 👇
#BMT #Bubblemaps #BinanceSquare
173
·
--
$IRYS Just Went Parabolic! 🚀🔥
Hey everyone 🤗 Look at this chart 👀
$IRYS is up +511% in 24 hours.
📈 Price: 0.13359 (24h high 0.16984)
💥 24h Volume: 1.39B USDT, with 27.72B IRYS traded
🧱 It broke out from a long, quiet base around 0.01–0.02 in a single vertical move.
What the chart is telling us:
Price is far above MA(7) 0.048, MA(25) 0.025 and MA(99) 0.017, so this is a full trend break.
Volume exploded with the move, which means real participation, not just a thin pump.
⚠️ RSI(6) is at 98.7, which is extremely overbought. After a vertical candle like this, sharp pullbacks and wicks are normal.
My view: The momentum is undeniable, but the smart play is patience. Wait for a retest of support instead of chasing green candles, and always use stop-losses on perps. 🛡️
The big question: how high can $IRYS rally from here? 🤔
🎯 0.20? 🎯 0.30? Or a healthy dip first?
Drop your target in the comments 👇
#IRYS

347
·
--
Bitcoin Steadies Near $81,650 as Altcoins Rebound, $PEPE Climbs 12.5% 🚀
Bitcoin is holding firm near $81,651, defending the $80,900 to $82,000 range after a volatile week. Buyers keep stepping in near the $79,800 support and the market is stabilizing.
Why the bulls are watching:
🟢 $BTC is sitting right on its MA(7) at ~$81,634
🟢 RSI(6) is near 38, close to oversold territory where bounces often start
🟢 24h volume is a strong 13.7K BTC (~$1.12B)
🟢 A reclaim of $82.4K to $82.5K (MA25/MA99) could open the door back toward $84K and $87K
Altcoins are waking up.
🐸 $PEPE is leading the meme sector at $0.00000504, up +12.50% as risk appetite returns. If BTC holds and money rotates into alts, momentum could build fast.
The bulls aren't gone, they're reloading. 💥
#Bitcoin #BTC #PEPE #crypto

65
·
--
🐸 $PEPE at a Decision Point
$PEPE is trading at 0.00000493 (+9.56%), just under the 24h high of 0.00000504.
📊 4H view:
Price is above MA(7) and MA(25), with MA(99) at 0.00000414 as the base
RSI(6) at 84.4 is overbought, so a pullback or consolidation is possible
🎯 Levels:
Resistance: 0.00000504 to 0.00000511
Support: 0.00000454 to 0.00000445
A confirmed 4H close above 0.00000511 opens the next leg. $0.0001 would need an extraordinary rally, so it's a long-term dream for now.
Breakout or rejection? Let the chart speak first.
💬 Do you think $PEPE breaks 0.00000511 first, or retests support? 👇
#PEPE #Binance #memecoin

2
7
596
·
--
🚀 $BMT (Bubblemaps) is today's Top Gainer on Binance, up 33%+
$BMT is trading at 0.02908 USDT, up +33.15% in 24h, with a high of 0.02980 and a low of 0.02038.
📊 What the 4H chart shows
Price bounced from the 0.01564 low and has now broken above the MA(7), MA(25) and MA(99), a strong bullish structure.
Volume exploded: 629M BMT (~$16M) traded in 24h, so the move has real participation behind it.
The MA(7) has crossed above the MA(25), a classic momentum signal.
⚠️ What to watch
RSI(6) is ~77, which is in overbought territory. After a vertical move like this, a pullback or consolidation is normal.
Resistance: 0.02980 (24h high). A clean breakout with volume could open the next leg.
Support zones: 0.02490 (MA7) and 0.02080 (MA25).
💡 Smart takeaways
✅ Don't chase green candles. Wait for retests of support.
✅ Use stop-losses and size your position carefully.
✅ Confirm breakouts with volume, not just price.
📌 Bubblemaps is an on-chain analytics project, so keep an eye on project updates as well.
What's your view on $BMT : continuation or cooldown? 👇
#BMT #Bubblemaps #TopGainer #CryptoAnalysis
Always DYOR.

115
·
--
GTC/USDT: Market in the Red, Gitcoin in the Green 🚀
While the broader market is under pressure, $GTC is standing out. Price is at 0.32256 USDT, up +14.86% in 24 hours and trending on the Gainers list.
Chart Breakdown (4H)
Strong structure: Price rallied from a low of 0.083 to a high of 0.39 and is now pushing higher again after a healthy pullback.
Moving averages: Price is trading above all three MAs: MA(7) at 0.293, MA(25) at 0.304 and MA(99) at 0.232. The steadily rising MA(99) points to a solid long-term uptrend.
Dip buying: The recent retracement was followed by a sharp recovery, showing buyers stepping in quickly.
RSI(6) at 74.3: Momentum is strong, but with RSI near overbought territory, a short consolidation is possible.
Key levels: The 24h high at 0.34787 is the immediate resistance, with support around 0.30. A breakout above 0.34 could open the way toward the 0.39 high.
Takeaway: Showing strength while the market is weak is the definition of relative strength, and $GTC is delivering exactly that.
💬 What's your take? Will $GTC break 0.34 and head for 0.39, or does the elevated RSI call for a pullback first? Share your prediction in the comments 👇
#GTC

198
·
--
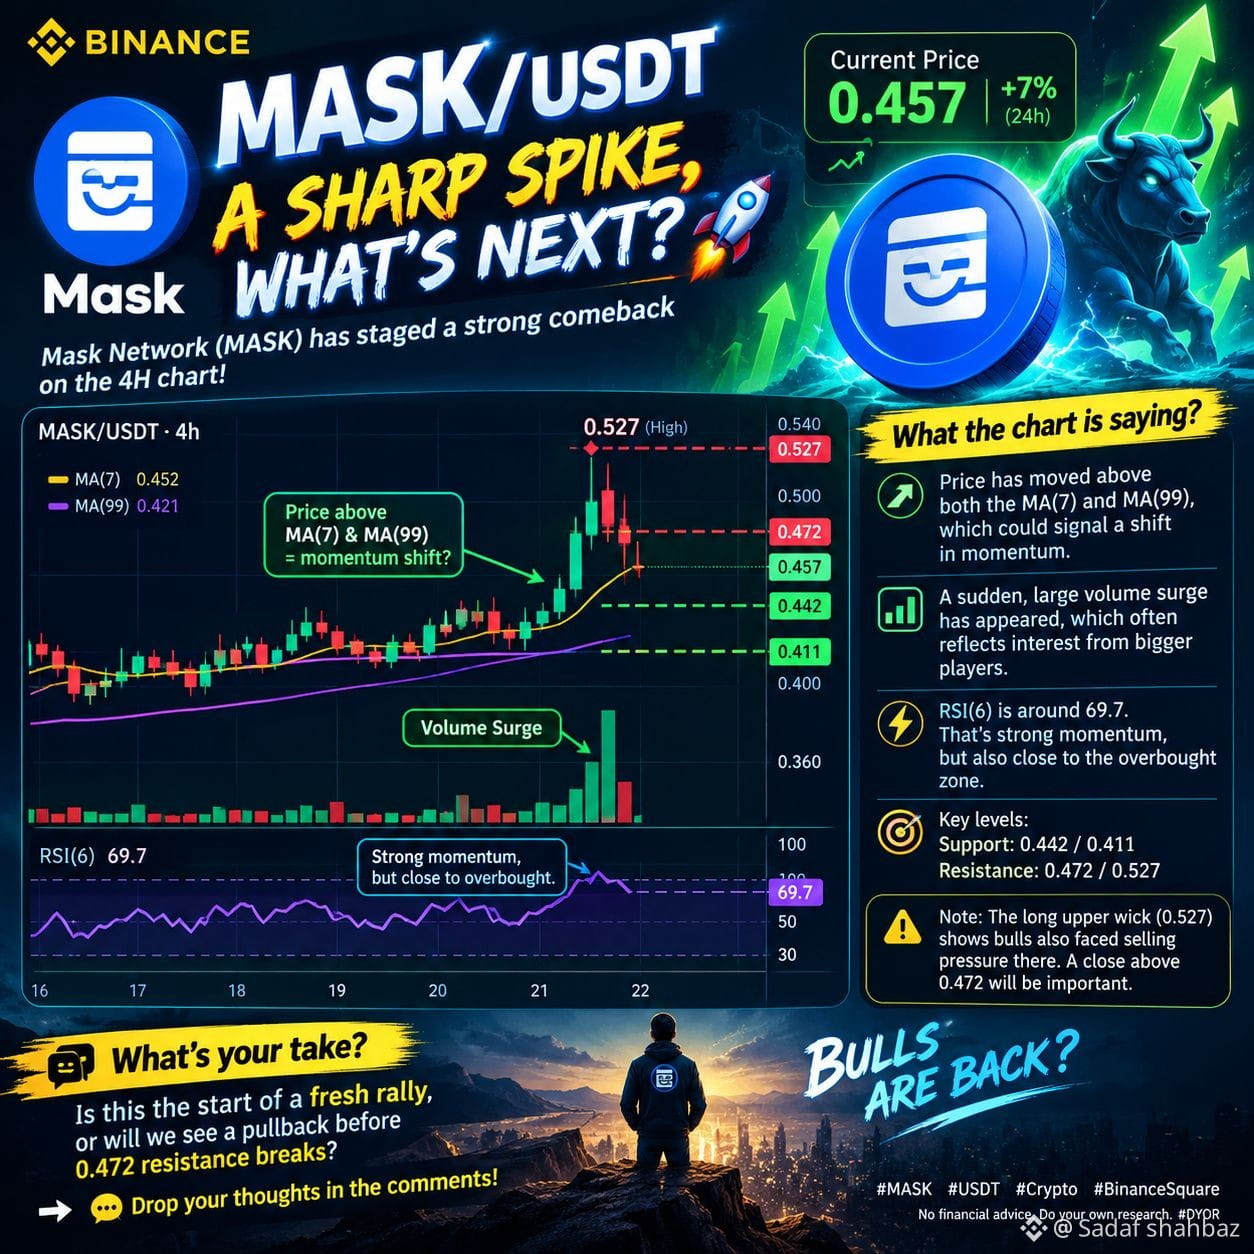
MASK/USDT: A Sharp Spike, What's Next? 🚀
Mask Network ($MASK ) has staged a strong comeback on the 4H chart. Price climbed from a low of 0.387 up to 0.527, and is now trading around 0.457, roughly +7% over 24 hours.
What is the chart saying?
📈 Price has moved above both the MA(7) and MA(99), which could signal a shift in momentum.
📊 A sudden, large volume surge has appeared, which often reflects interest from bigger players.
⚡ RSI(6) is around 69.7. That's strong momentum, but also close to the overbought zone.
🎯 Key levels: support at 0.442 / 0.411, and resistance at 0.472 / 0.527.
Note: The long upper wick (0.527) shows bulls also faced selling pressure there. A close above 0.472 will be important.
💬 What's your take? Is this the start of a fresh rally, or will we see a pullback before 0.472 resistance breaks? Drop your thoughts in the comments! 👇
#BinanceSquare #MASK #crypto #TechnicalAnalysis
2
406
·
--
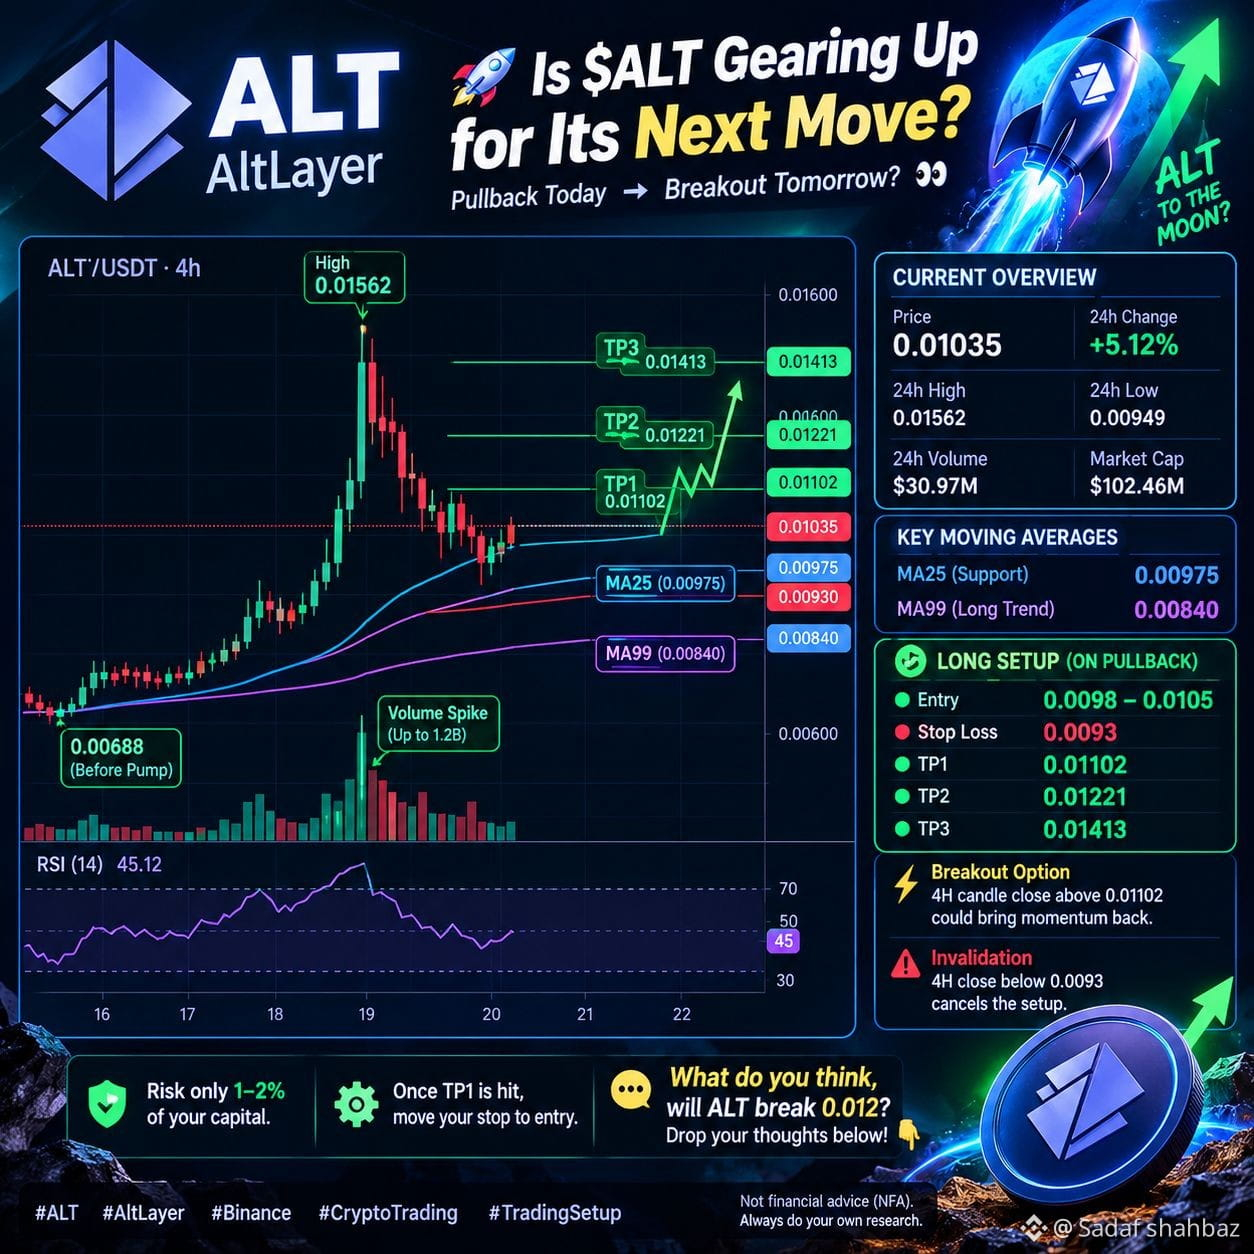
🚀 Is $ALT Gearing Up for Its Next Move? 🔥
$ALT ripped from 0.00688 to 0.01562 on a massive volume spike (up to 1.2B). Price has now cooled off to 0.01035 and RSI sits at just 45, so it's no longer overbought. 👀
📊 4H Overview
• MA25 (0.00975) is acting as support
• MA99 (0.00840) is far below, so the broader trend is still intact
• 24h Vol: $30.97M, so interest is still alive
🎯 Long Setup (on pullback)
🟢 Entry: 0.0098 – 0.0105
🛑 Stop Loss: 0.0093 (below the 24h Low)
✅ TP1: 0.01102
✅ TP2: 0.01221
✅ TP3: 0.01413
⚡ Breakout Option: A 4H candle close above 0.01102 could bring momentum back.
⚠️ Invalidation: A 4H close below 0.0093 cancels the setup.
💡 Risk only 1–2% of your capital. Once TP1 is hit, move your stop to entry.
💬 What do you think, will ALT break 0.012? Drop your thoughts below! 👇
#ALT #AltLayer #Binance #cryptotrading #TradingSetup
262
Log in to explore more content
Join global crypto users on Binance Square
⚡️ Get latest and useful information about crypto.
💬 Trusted by the world’s largest crypto exchange.
👍 Discover real insights from verified creators.
Email / Phone number
Trending Topics
FedWatch
16.1M views
37,855 Discussing
U.S. Fed leaves rates unchanged, but Warsh does not rule out a December hike
BorisBorissss
·3 Likes
·2.5k views
RussiaProposedNonCustodialWalletLimitsExcludeIntlSettlements
5 views
6 Discussing
AlphabetSharesSlide10%InLateTrading
195 views
19 Discussing