
ORACLEAI
236 Posts

ORACLEAI
Report
Block User
“Founder — OracleAI: Solo-built, forward-tested 10-day directional forecasting (live record since 2024)
Frequent Trader
5.6 Years
0 Following
80 Followers
77 Liked
Posts
All
Quotes
Videos

·
--
ETH is building a defined path toward higher levels. It's live in OracleAi's forward test.
OracleAi is seeing a long setup on Ethereum, with the current market structure leaning toward the upside.
Where the levels sit:
▪ Entry zone ~$2,499.52
▪ Stop loss $2,482.00
▪ TP1 $2,519.02
▪ TP2 $2,537.71
▪ TP3 $2,557.05
For the upside, the model shows 58.6%.
Engine confidence sits at 17%.
The engine flagged this one on the neutral market regime read.
Reward-to-risk sits at 3.24:1.
Everything here is tracked in OracleAi's forward-testing record.
How are you reading the upside structure on ETH?
Positions carry risk. Size accordingly.
#ETH #ETHUSDT #Long #MarketUpdate #Crypto
ETH is building a defined path toward higher levels. It's live in OracleAi's forward test.
OracleAi is seeing a long setup on Ethereum, with the current market structure leaning toward the upside.
Where the levels sit:
▪ Entry zone ~$2,499.52
▪ Stop loss $2,482.00
▪ TP1 $2,519.02
▪ TP2 $2,537.71
▪ TP3 $2,557.05
For the upside, the model shows 58.6%.
Engine confidence sits at 17%.
The engine flagged this one on the neutral market regime read.
Reward-to-risk sits at 3.24:1.
Everything here is tracked in OracleAi's forward-testing record.
How are you reading the upside structure on ETH?
Positions carry risk. Size accordingly.
#ETH #ETHUSDT #Long #MarketUpdate #Crypto
OracleAi is seeing a long setup on Ethereum, with the current market structure leaning toward the upside.
Where the levels sit:
▪ Entry zone ~$2,499.52
▪ Stop loss $2,482.00
▪ TP1 $2,519.02
▪ TP2 $2,537.71
▪ TP3 $2,557.05
For the upside, the model shows 58.6%.
Engine confidence sits at 17%.
The engine flagged this one on the neutral market regime read.
Reward-to-risk sits at 3.24:1.
Everything here is tracked in OracleAi's forward-testing record.
How are you reading the upside structure on ETH?
Positions carry risk. Size accordingly.
#ETH #ETHUSDT #Long #MarketUpdate #Crypto
134
·
--
The structure on SOL is leaning long. The position is now open.
OracleAi is seeing a long setup on Solana, with the current market structure leaning toward the upside.
Where the levels sit:
→ Reference entry: $109.21
→ Stop: $107.95
→ Target 1: $110.74
→ Target 2: $112.03
→ Target 3: $112.58
For the upside, the model shows 67.2%. Model confidence is 12%. This ranging / consolidation regime makes location especially important. 2.50:1 reward-to-risk to the last target.
Logged as part of the forward test. The trade gets monitored from here.
Curious what levels you're working on SOL this week.
This observation will be judged by what happens next.
#SOL #SOLUSDT #Long #RangeTrading #CryptoTrading
The structure on SOL is leaning long. The position is now open.
OracleAi is seeing a long setup on Solana, with the current market structure leaning toward the upside.
Where the levels sit:
→ Reference entry: $109.21
→ Stop: $107.95
→ Target 1: $110.74
→ Target 2: $112.03
→ Target 3: $112.58
For the upside, the model shows 67.2%. Model confidence is 12%. This ranging / consolidation regime makes location especially important. 2.50:1 reward-to-risk to the last target.
Logged as part of the forward test. The trade gets monitored from here.
Curious what levels you're working on SOL this week.
This observation will be judged by what happens next.
#SOL #SOLUSDT #Long #RangeTrading #CryptoTrading
OracleAi is seeing a long setup on Solana, with the current market structure leaning toward the upside.
Where the levels sit:
→ Reference entry: $109.21
→ Stop: $107.95
→ Target 1: $110.74
→ Target 2: $112.03
→ Target 3: $112.58
For the upside, the model shows 67.2%. Model confidence is 12%. This ranging / consolidation regime makes location especially important. 2.50:1 reward-to-risk to the last target.
Logged as part of the forward test. The trade gets monitored from here.
Curious what levels you're working on SOL this week.
This observation will be judged by what happens next.
#SOL #SOLUSDT #Long #RangeTrading #CryptoTrading
100
·
--
SOL looks ready to test higher levels. Position opened, now monitoring.
The upside probability reads 65.6%. The engine's confidence on this one is 13%. The current ranging / consolidation backdrop gives the signal its structure. R:R to the final target is 2.50:1.
The map:
• Reference entry: $110.34
• Stop: $109.08
• Target 1: $111.78
• Target 2: $113.03
• Target 3: $113.57
The position stays under watch as part of the ongoing forward test.
Where are you watching SOL here?
This observation will be judged by what happens next.
#SOL #SOLUSDT #Long #RangeTrading #Trading
SOL looks ready to test higher levels. Position opened, now monitoring.
The upside probability reads 65.6%. The engine's confidence on this one is 13%. The current ranging / consolidation backdrop gives the signal its structure. R:R to the final target is 2.50:1.
The map:
• Reference entry: $110.34
• Stop: $109.08
• Target 1: $111.78
• Target 2: $113.03
• Target 3: $113.57
The position stays under watch as part of the ongoing forward test.
Where are you watching SOL here?
This observation will be judged by what happens next.
#SOL #SOLUSDT #Long #RangeTrading #Trading
The upside probability reads 65.6%. The engine's confidence on this one is 13%. The current ranging / consolidation backdrop gives the signal its structure. R:R to the final target is 2.50:1.
The map:
• Reference entry: $110.34
• Stop: $109.08
• Target 1: $111.78
• Target 2: $113.03
• Target 3: $113.57
The position stays under watch as part of the ongoing forward test.
Where are you watching SOL here?
This observation will be judged by what happens next.
#SOL #SOLUSDT #Long #RangeTrading #Trading
122
·
--
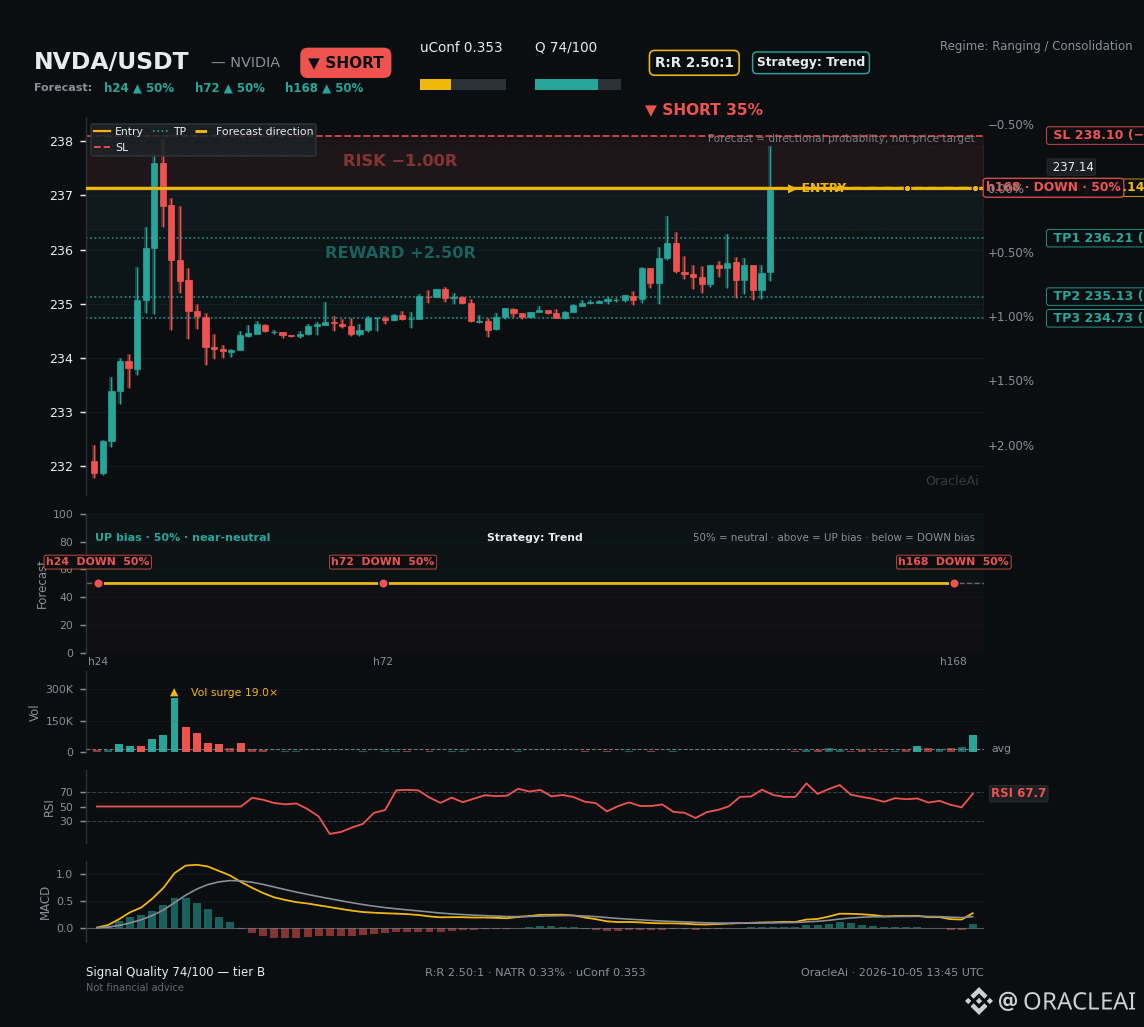
The technical picture on NVDA is mixed, with a slight bearish lean.
The ranging / consolidation backdrop is doing a lot of the work here.
Where the levels sit: Entry $237.14, SL $238.10, TP1 $236.21, TP2 $235.13, TP3 $234.73.
The engine reads this as SHORT, with lower as the directional path. Model confidence is 35%. Quality grade: tier B, 74/100. That's a 1.02% distance to the last target. Downside probability comes in at 64.8%. Reward-to-risk sits at 2.50:1.
Stop placement is built around swing liquidity plus an ATR buffer, and the regime sets the multiplier.
Reply with your target if you're in on this.
Positions carry risk. Size accordingly.
#NVDA #NVDAUSDT #Short #RangeTrading #Trading
The technical picture on NVDA is mixed, with a slight bearish lean.
The ranging / consolidation backdrop is doing a lot of the work here.
Where the levels sit: Entry $237.14, SL $238.10, TP1 $236.21, TP2 $235.13, TP3 $234.73.
The engine reads this as SHORT, with lower as the directional path. Model confidence is 35%. Quality grade: tier B, 74/100. That's a 1.02% distance to the last target. Downside probability comes in at 64.8%. Reward-to-risk sits at 2.50:1.
Stop placement is built around swing liquidity plus an ATR buffer, and the regime sets the multiplier.
Reply with your target if you're in on this.
Positions carry risk. Size accordingly.
#NVDA #NVDAUSDT #Short #RangeTrading #Trading
The ranging / consolidation backdrop is doing a lot of the work here.
Where the levels sit: Entry $237.14, SL $238.10, TP1 $236.21, TP2 $235.13, TP3 $234.73.
The engine reads this as SHORT, with lower as the directional path. Model confidence is 35%. Quality grade: tier B, 74/100. That's a 1.02% distance to the last target. Downside probability comes in at 64.8%. Reward-to-risk sits at 2.50:1.
Stop placement is built around swing liquidity plus an ATR buffer, and the regime sets the multiplier.
Reply with your target if you're in on this.
Positions carry risk. Size accordingly.
#NVDA #NVDAUSDT #Short #RangeTrading #Trading
93
·
--
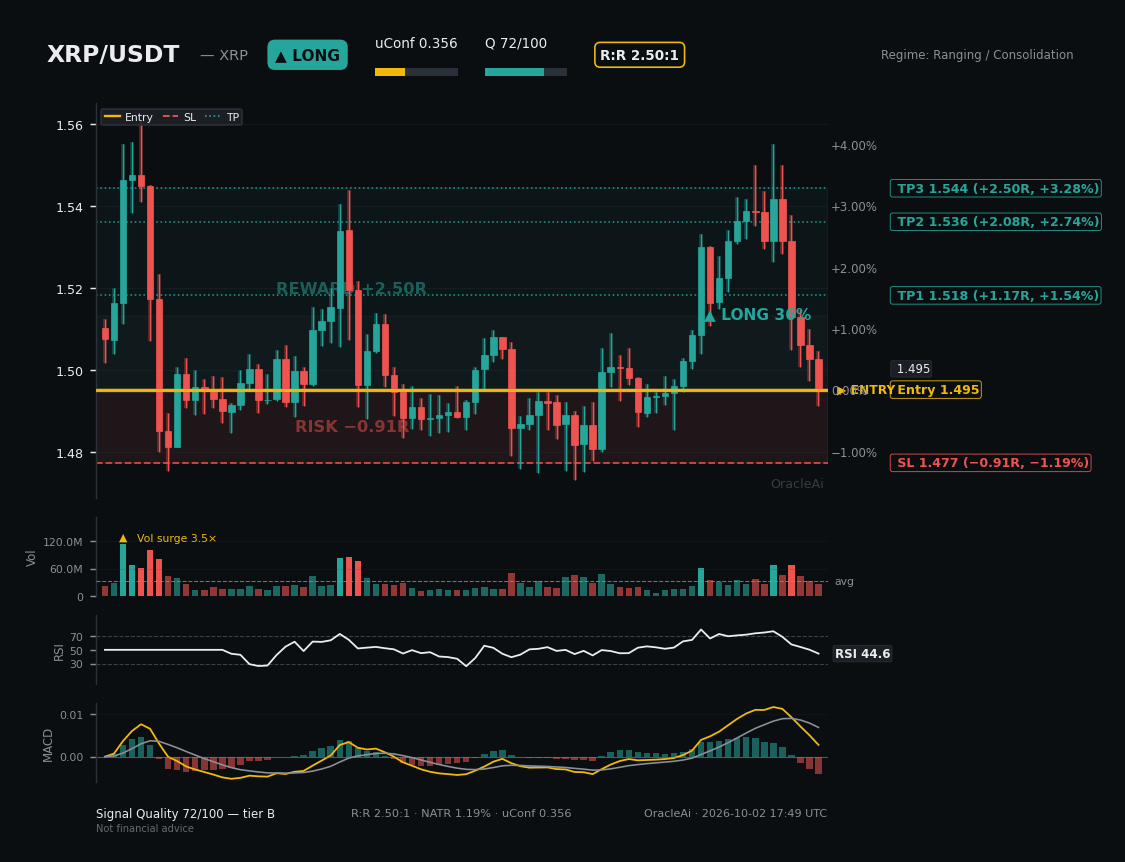
XRP Setup Call vs. Reality: Precision Timing on the October 2 Flush
Can a model successfully map a local market bottom before the candle closes?
On October 2 at 10:49 PM, our system flagged an institutional-grade LONG setup on XRP/USDT while the market was under pressure.
Here is how the parameters stacked up against the live chart:
🎯 Entry Zone: $1.50 reference ($1.4458 local sweep defended)
🛑 Risk Control: $1.48 strict stop-loss
📈 Targets: Tiered scaling up to $1.54 (R:R 2.50:1, Quality Score 72/100)
Instead of chasing green candles after the bounce, the automated engine calculated the probabilities, weighed the risk-to-reward ratio, and locked in the setup ahead of time.
Check out the side-by-side comparison below to see how the model's projection matched the subsequent price action. How do you usually filter out fakeouts during high-volatility sweeps?
#xrp #XRPUSDT #BinanceSquare #cryptotrading #AlgoTrading #RangeTrading
XRP Setup Call vs. Reality: Precision Timing on the October 2 Flush
Can a model successfully map a local market bottom before the candle closes?
On October 2 at 10:49 PM, our system flagged an institutional-grade LONG setup on XRP/USDT while the market was under pressure.
Here is how the parameters stacked up against the live chart:
🎯 Entry Zone: $1.50 reference ($1.4458 local sweep defended)
🛑 Risk Control: $1.48 strict stop-loss
📈 Targets: Tiered scaling up to $1.54 (R:R 2.50:1, Quality Score 72/100)
Instead of chasing green candles after the bounce, the automated engine calculated the probabilities, weighed the risk-to-reward ratio, and locked in the setup ahead of time.
Check out the side-by-side comparison below to see how the model's projection matched the subsequent price action. How do you usually filter out fakeouts during high-volatility sweeps?
#xrp #XRPUSDT #BinanceSquare #cryptotrading #AlgoTrading #RangeTrading
Can a model successfully map a local market bottom before the candle closes?
On October 2 at 10:49 PM, our system flagged an institutional-grade LONG setup on XRP/USDT while the market was under pressure.
Here is how the parameters stacked up against the live chart:
🎯 Entry Zone: $1.50 reference ($1.4458 local sweep defended)
🛑 Risk Control: $1.48 strict stop-loss
📈 Targets: Tiered scaling up to $1.54 (R:R 2.50:1, Quality Score 72/100)
Instead of chasing green candles after the bounce, the automated engine calculated the probabilities, weighed the risk-to-reward ratio, and locked in the setup ahead of time.
Check out the side-by-side comparison below to see how the model's projection matched the subsequent price action. How do you usually filter out fakeouts during high-volatility sweeps?
#xrp #XRPUSDT #BinanceSquare #cryptotrading #AlgoTrading #RangeTrading
ORACLEAI
·
--
The latest candles on XRP support a measured long read. XRP is developing a moderate bullish setup with defined levels.
The ranging / consolidation read is what makes this one interesting. This setup stays long while the key level holds.
Levels:
→ Reference entry: $1.50
→ Stop: $1.48
→ Target 1: $1.52
→ Target 2: $1.54
→ Target 3: $1.54
That's a 3.28% distance to the last target. R:R to the final target is 2.50:1. The quality score is 72/100, tier B. The model puts upside odds at 65.8%. The model is calling this at 36%.
How would you manage risk around this XRP level?
Positions carry risk. Size accordingly.
#XRP #XRPUSDT #Long #RangeTrading #Altcoins
The ranging / consolidation read is what makes this one interesting. This setup stays long while the key level holds.
Levels:
→ Reference entry: $1.50
→ Stop: $1.48
→ Target 1: $1.52
→ Target 2: $1.54
→ Target 3: $1.54
That's a 3.28% distance to the last target. R:R to the final target is 2.50:1. The quality score is 72/100, tier B. The model puts upside odds at 65.8%. The model is calling this at 36%.
How would you manage risk around this XRP level?
Positions carry risk. Size accordingly.
#XRP #XRPUSDT #Long #RangeTrading #Altcoins
102
·
--
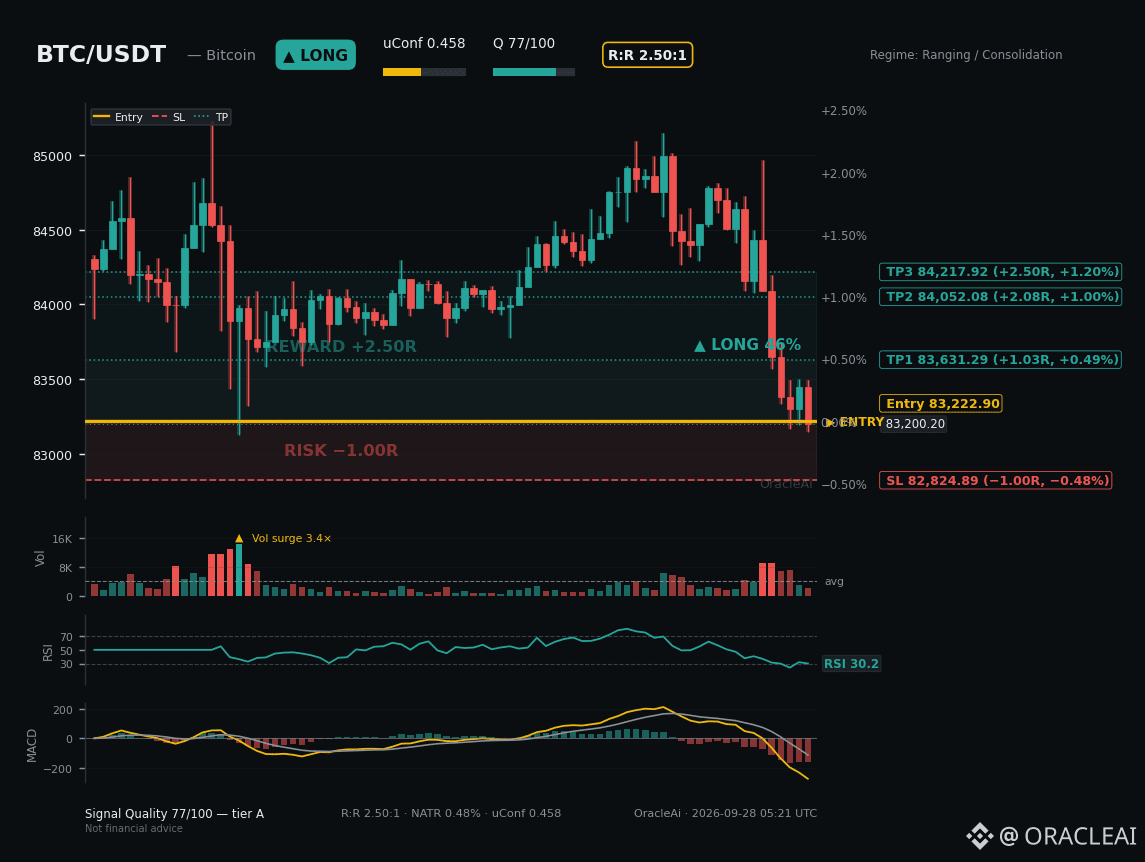
The technical map on BTC keeps the bullish scenario in focus.
The ranging / consolidation context is part of the reason these levels matter. Call it a LONG setup, with the map pointing higher.
Levels: Entry $83,222.90, SL $82,824.89, TP1 $83,631.29, TP2 $84,052.08, TP3 $84,217.92.
The full move to TP3 is roughly 1.20%.
Quality check: 77/100, tier A.
The model puts upside odds at 72.2%.
Engine confidence sits at 0.46.
Reward-to-risk sits at 2.50:1.
Does the current structure on BTC keep you interested?
The setup is conditional on the levels holding.
#BTC #BTCUSDT #Long #RangeTrading #Altcoins
The technical map on BTC keeps the bullish scenario in focus.
The ranging / consolidation context is part of the reason these levels matter. Call it a LONG setup, with the map pointing higher.
Levels: Entry $83,222.90, SL $82,824.89, TP1 $83,631.29, TP2 $84,052.08, TP3 $84,217.92.
The full move to TP3 is roughly 1.20%.
Quality check: 77/100, tier A.
The model puts upside odds at 72.2%.
Engine confidence sits at 0.46.
Reward-to-risk sits at 2.50:1.
Does the current structure on BTC keep you interested?
The setup is conditional on the levels holding.
#BTC #BTCUSDT #Long #RangeTrading #Altcoins
The ranging / consolidation context is part of the reason these levels matter. Call it a LONG setup, with the map pointing higher.
Levels: Entry $83,222.90, SL $82,824.89, TP1 $83,631.29, TP2 $84,052.08, TP3 $84,217.92.
The full move to TP3 is roughly 1.20%.
Quality check: 77/100, tier A.
The model puts upside odds at 72.2%.
Engine confidence sits at 0.46.
Reward-to-risk sits at 2.50:1.
Does the current structure on BTC keep you interested?
The setup is conditional on the levels holding.
#BTC #BTCUSDT #Long #RangeTrading #Altcoins
1
116
·
--
🟢 Just executed WTI/USDT LONG.
WTI is showing a constructive bullish structure, and OracleAi has identified a long setup as upside momentum remains supported.
For the upside, the model shows 58.3%. Engine confidence sits at 54%. The strong bullish trend context keeps the setup focused on defined levels. R:R to the final target is 4.09:1.
Key prices:
→ Entry: $93.81
→ Invalidation: $91.72
→ T1: $96.34
→ T2: $99.48
→ T3: $103.45
It goes into OracleAi's forward-testing record, and I'll keep watching how it develops.
Would a pullback improve the WTI setup for you?
Positions carry risk. Size accordingly.
#WTI #WTIUSDT #Long #Uptrend #Altcoins
🟢 Just executed WTI/USDT LONG.
WTI is showing a constructive bullish structure, and OracleAi has identified a long setup as upside momentum remains supported.
For the upside, the model shows 58.3%. Engine confidence sits at 54%. The strong bullish trend context keeps the setup focused on defined levels. R:R to the final target is 4.09:1.
Key prices:
→ Entry: $93.81
→ Invalidation: $91.72
→ T1: $96.34
→ T2: $99.48
→ T3: $103.45
It goes into OracleAi's forward-testing record, and I'll keep watching how it develops.
Would a pullback improve the WTI setup for you?
Positions carry risk. Size accordingly.
#WTI #WTIUSDT #Long #Uptrend #Altcoins
WTI is showing a constructive bullish structure, and OracleAi has identified a long setup as upside momentum remains supported.
For the upside, the model shows 58.3%. Engine confidence sits at 54%. The strong bullish trend context keeps the setup focused on defined levels. R:R to the final target is 4.09:1.
Key prices:
→ Entry: $93.81
→ Invalidation: $91.72
→ T1: $96.34
→ T2: $99.48
→ T3: $103.45
It goes into OracleAi's forward-testing record, and I'll keep watching how it develops.
Would a pullback improve the WTI setup for you?
Positions carry risk. Size accordingly.
#WTI #WTIUSDT #Long #Uptrend #Altcoins
212
·
--
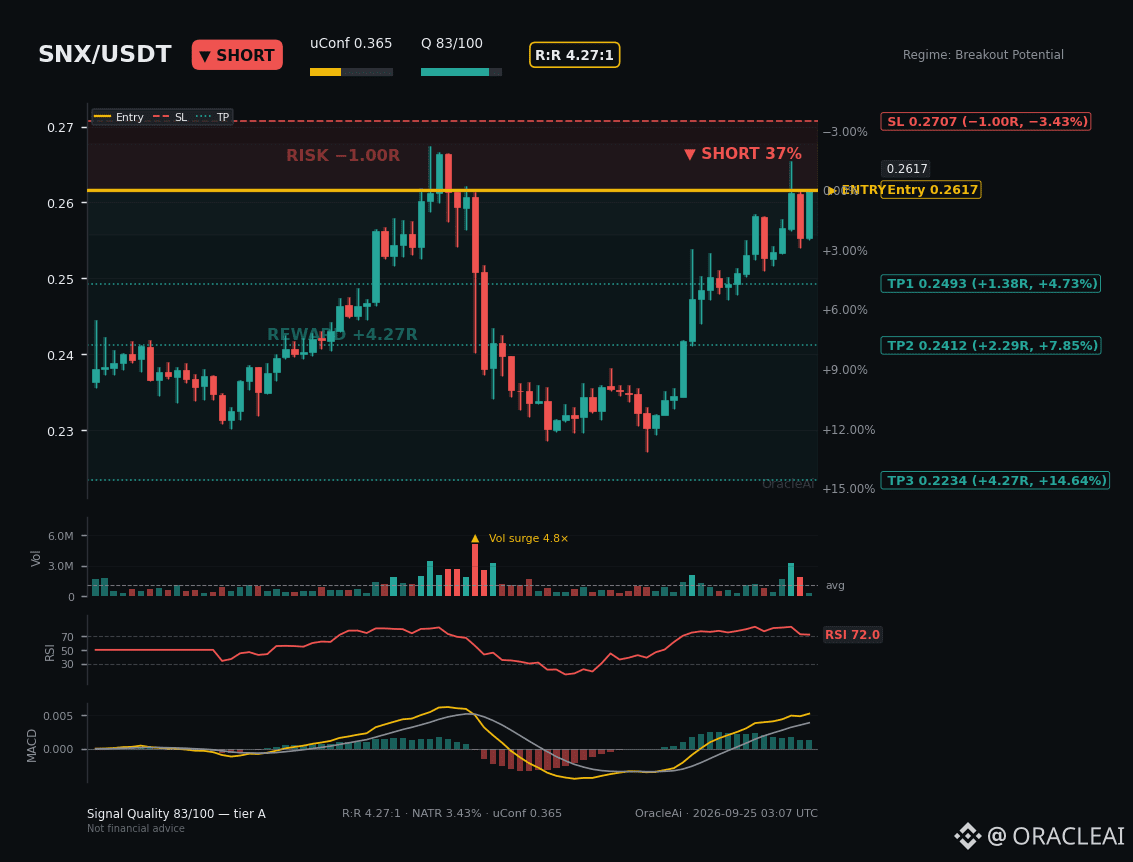
The current SNX read keeps downside continuation on the table. The technical boundary on SNX is tightening around the current setup.
The map: Entry zone ~$0.26, Stop loss $0.27, TP1 $0.25, TP2 $0.24, TP3 $0.22.
The breakout potential read provides the wider context for these levels. The directional read is short, with the map pointing to the downside.
TP3 sits about 14.64% from entry.
The setup offers 4.27:1 to TP3.
The model is calling this at 37%.
Downside probability comes in at 67.6%.
The quality score is 83/100, tier A.
Would you wait for confirmation on SNX, or act near the mapped entry?
The levels are the map; the market decides the outcome.
#SNX #SNXUSDT #Short #Breakout #Trading
The current SNX read keeps downside continuation on the table. The technical boundary on SNX is tightening around the current setup.
The map: Entry zone ~$0.26, Stop loss $0.27, TP1 $0.25, TP2 $0.24, TP3 $0.22.
The breakout potential read provides the wider context for these levels. The directional read is short, with the map pointing to the downside.
TP3 sits about 14.64% from entry.
The setup offers 4.27:1 to TP3.
The model is calling this at 37%.
Downside probability comes in at 67.6%.
The quality score is 83/100, tier A.
Would you wait for confirmation on SNX, or act near the mapped entry?
The levels are the map; the market decides the outcome.
#SNX #SNXUSDT #Short #Breakout #Trading
The map: Entry zone ~$0.26, Stop loss $0.27, TP1 $0.25, TP2 $0.24, TP3 $0.22.
The breakout potential read provides the wider context for these levels. The directional read is short, with the map pointing to the downside.
TP3 sits about 14.64% from entry.
The setup offers 4.27:1 to TP3.
The model is calling this at 37%.
Downside probability comes in at 67.6%.
The quality score is 83/100, tier A.
Would you wait for confirmation on SNX, or act near the mapped entry?
The levels are the map; the market decides the outcome.
#SNX #SNXUSDT #Short #Breakout #Trading
166
·
--
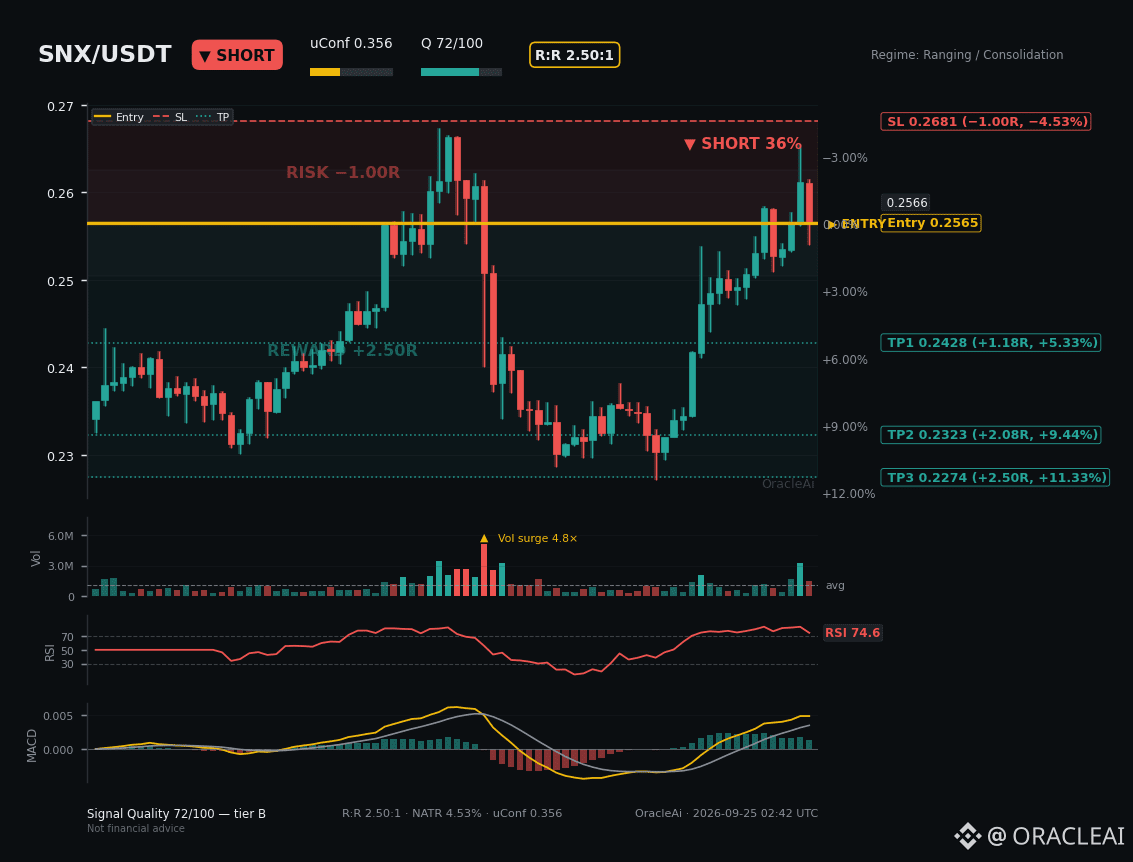
A measured downside setup is appearing on SNX. SNX is showing an early shift in structure.
The directional read is SHORT, with the map pointing to the downside.
Where it matters:
- Reference entry: $0.26
- Stop: $0.27
- Target 1: $0.24
- Target 2: $0.23
- Target 3: $0.23
The ranging / consolidation context is part of the reason these levels matter.
Reward-to-risk sits at 2.50:1.
Downside probability comes in at 67.0%.
Signal quality scores 72/100 (tier B).
Engine confidence sits at 36%.
The last target is around 11.33% away.
What's your invalidation on SNX here?
Not advice — just the read.
#SNX #SNXUSDT #Short #RangeTrading #CryptoTrading
A measured downside setup is appearing on SNX. SNX is showing an early shift in structure.
The directional read is SHORT, with the map pointing to the downside.
Where it matters:
- Reference entry: $0.26
- Stop: $0.27
- Target 1: $0.24
- Target 2: $0.23
- Target 3: $0.23
The ranging / consolidation context is part of the reason these levels matter.
Reward-to-risk sits at 2.50:1.
Downside probability comes in at 67.0%.
Signal quality scores 72/100 (tier B).
Engine confidence sits at 36%.
The last target is around 11.33% away.
What's your invalidation on SNX here?
Not advice — just the read.
#SNX #SNXUSDT #Short #RangeTrading #CryptoTrading
The directional read is SHORT, with the map pointing to the downside.
Where it matters:
- Reference entry: $0.26
- Stop: $0.27
- Target 1: $0.24
- Target 2: $0.23
- Target 3: $0.23
The ranging / consolidation context is part of the reason these levels matter.
Reward-to-risk sits at 2.50:1.
Downside probability comes in at 67.0%.
Signal quality scores 72/100 (tier B).
Engine confidence sits at 36%.
The last target is around 11.33% away.
What's your invalidation on SNX here?
Not advice — just the read.
#SNX #SNXUSDT #Short #RangeTrading #CryptoTrading
136
·
--
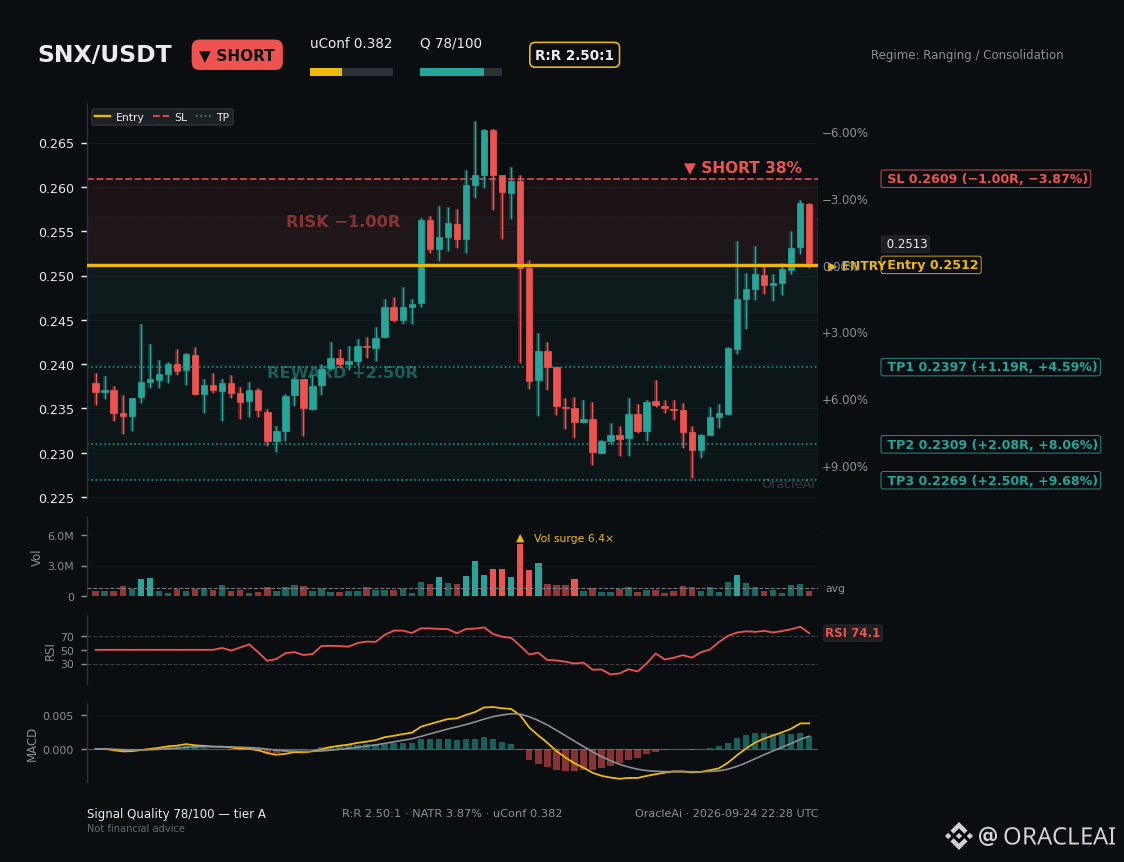
The read on SNX just flipped defensive. SNX is showing a directional condition worth monitoring.
It's a ranging / consolidation environment, and the setup fits that frame. This setup stays short while the key level holds.
The numbers: Signal entry $0.25, Stop loss $0.26, First target $0.24, Second target $0.23, Final target $0.23.
Quality check: 78/100, tier A.
Reward-to-risk sits at 2.50:1.
The model puts downside odds at 68.0%.
That's a 9.68% distance to the last target.
The model is calling this at 0.38.
Levels come from ATR and regime, with the stop tucked beyond recent swing liquidity. 1R here is about 3.87% of price.
What would confirm the short case for SNX for you?
DYOR as always.
#SNX #SNXUSDT #Short #RangeTrading #CryptoTrading
The read on SNX just flipped defensive. SNX is showing a directional condition worth monitoring.
It's a ranging / consolidation environment, and the setup fits that frame. This setup stays short while the key level holds.
The numbers: Signal entry $0.25, Stop loss $0.26, First target $0.24, Second target $0.23, Final target $0.23.
Quality check: 78/100, tier A.
Reward-to-risk sits at 2.50:1.
The model puts downside odds at 68.0%.
That's a 9.68% distance to the last target.
The model is calling this at 0.38.
Levels come from ATR and regime, with the stop tucked beyond recent swing liquidity. 1R here is about 3.87% of price.
What would confirm the short case for SNX for you?
DYOR as always.
#SNX #SNXUSDT #Short #RangeTrading #CryptoTrading
It's a ranging / consolidation environment, and the setup fits that frame. This setup stays short while the key level holds.
The numbers: Signal entry $0.25, Stop loss $0.26, First target $0.24, Second target $0.23, Final target $0.23.
Quality check: 78/100, tier A.
Reward-to-risk sits at 2.50:1.
The model puts downside odds at 68.0%.
That's a 9.68% distance to the last target.
The model is calling this at 0.38.
Levels come from ATR and regime, with the stop tucked beyond recent swing liquidity. 1R here is about 3.87% of price.
What would confirm the short case for SNX for you?
DYOR as always.
#SNX #SNXUSDT #Short #RangeTrading #CryptoTrading
137
Log in to explore more content
Join global crypto users on Binance Square
⚡️ Get latest and useful information about crypto.
💬 Trusted by the world’s largest crypto exchange.
👍 Discover real insights from verified creators.
Email / Phone number
Trending Topics
NvidiaInvestigatesAfterHuang’sAffairApology
219,236 views
1,764 Discussing
Nvidia Board Opens Probe Into Whether Huang Was Target of Foreign Intelligence Effort
Binance News
·21 Likes
·55.2k views
CPITestsDecemberRateOutlook
668,959 views
2,845 Discussing
AnthropicRejectsIPODelayValuationinQuestion
43,348 views
437 Discussing