
Mr_Trader5246
68 Posts

Mr_Trader5246
Report
Block User
Old account with 2K followers got suspended. Starting fresh here. Thanks for your support! 🙏
Open Trade
Occasional Trader
5.1 Months
3 Following
17 Followers
114 Liked
Posts
Portfolio
All
Quotes
Videos
·
--
Bullish
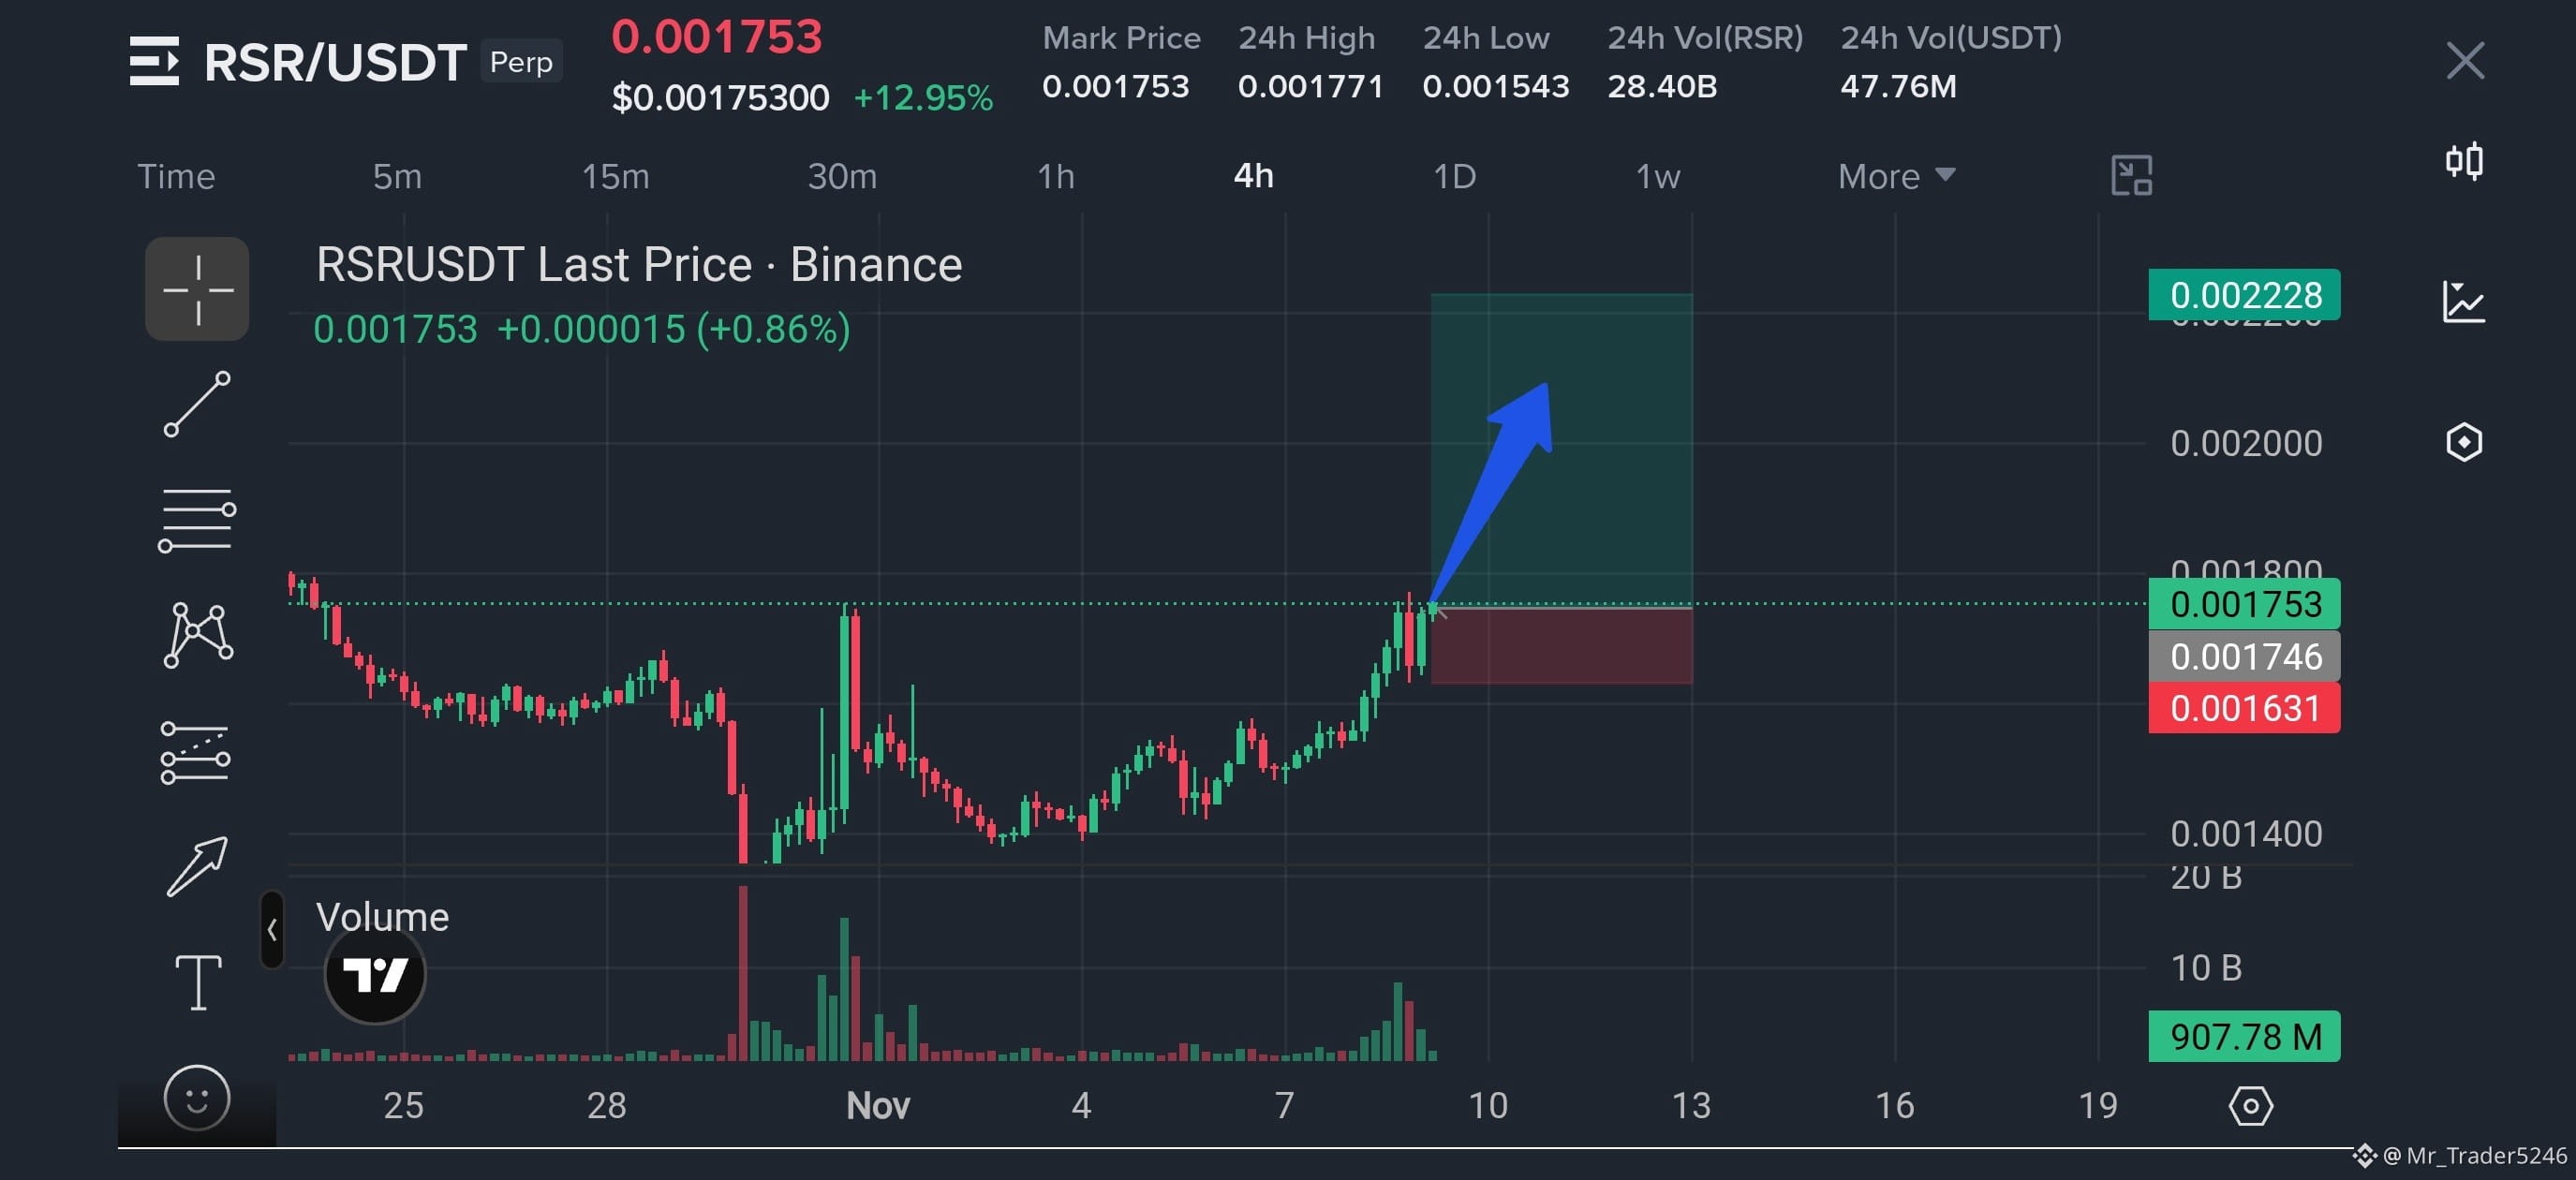
$RSR USDT – BIG LONG OPPORTUNITY
RSR is showing strong bullish momentum on the 4H timeframe. Price has recovered from its recent consolidation zone, and buying volume is picking up. Bulls are gaining strength, suggesting a potential continuation toward higher resistance levels.
LONG TRADE SETUP
* Entry Zone: $0.001746 – $0.001753
* TP1: $0.001850
* TP2: $0.001950
* TP3: $0.002050
* TP4: $0.002150
* TP5: $0.002228
* Stop Loss: $0.001631
Technical Analysis:
* Strong bullish recovery on the 4H chart.
* Buying volume is increasing.
* Bulls are showing strength.
* A confirmed breakout could trigger another upward move.
* Next major target is $0.002228.
Important: Wait for bullish confirmation before entering. Avoid chasing a sudden pump and always manage your risk.
Keep your notifications ON for further updates!
Trade here 👇
{future}(RSRUSDT)
$RSR USDT – BIG LONG OPPORTUNITY
RSR is showing strong bullish momentum on the 4H timeframe. Price has recovered from its recent consolidation zone, and buying volume is picking up. Bulls are gaining strength, suggesting a potential continuation toward higher resistance levels.
LONG TRADE SETUP
* Entry Zone: $0.001746 – $0.001753
* TP1: $0.001850
* TP2: $0.001950
* TP3: $0.002050
* TP4: $0.002150
* TP5: $0.002228
* Stop Loss: $0.001631
Technical Analysis:
* Strong bullish recovery on the 4H chart.
* Buying volume is increasing.
* Bulls are showing strength.
* A confirmed breakout could trigger another upward move.
* Next major target is $0.002228.
Important: Wait for bullish confirmation before entering. Avoid chasing a sudden pump and always manage your risk.
Keep your notifications ON for further updates!
Trade here 👇
RSR is showing strong bullish momentum on the 4H timeframe. Price has recovered from its recent consolidation zone, and buying volume is picking up. Bulls are gaining strength, suggesting a potential continuation toward higher resistance levels.
LONG TRADE SETUP
* Entry Zone: $0.001746 – $0.001753
* TP1: $0.001850
* TP2: $0.001950
* TP3: $0.002050
* TP4: $0.002150
* TP5: $0.002228
* Stop Loss: $0.001631
Technical Analysis:
* Strong bullish recovery on the 4H chart.
* Buying volume is increasing.
* Bulls are showing strength.
* A confirmed breakout could trigger another upward move.
* Next major target is $0.002228.
Important: Wait for bullish confirmation before entering. Avoid chasing a sudden pump and always manage your risk.
Keep your notifications ON for further updates!
Trade here 👇
1
4
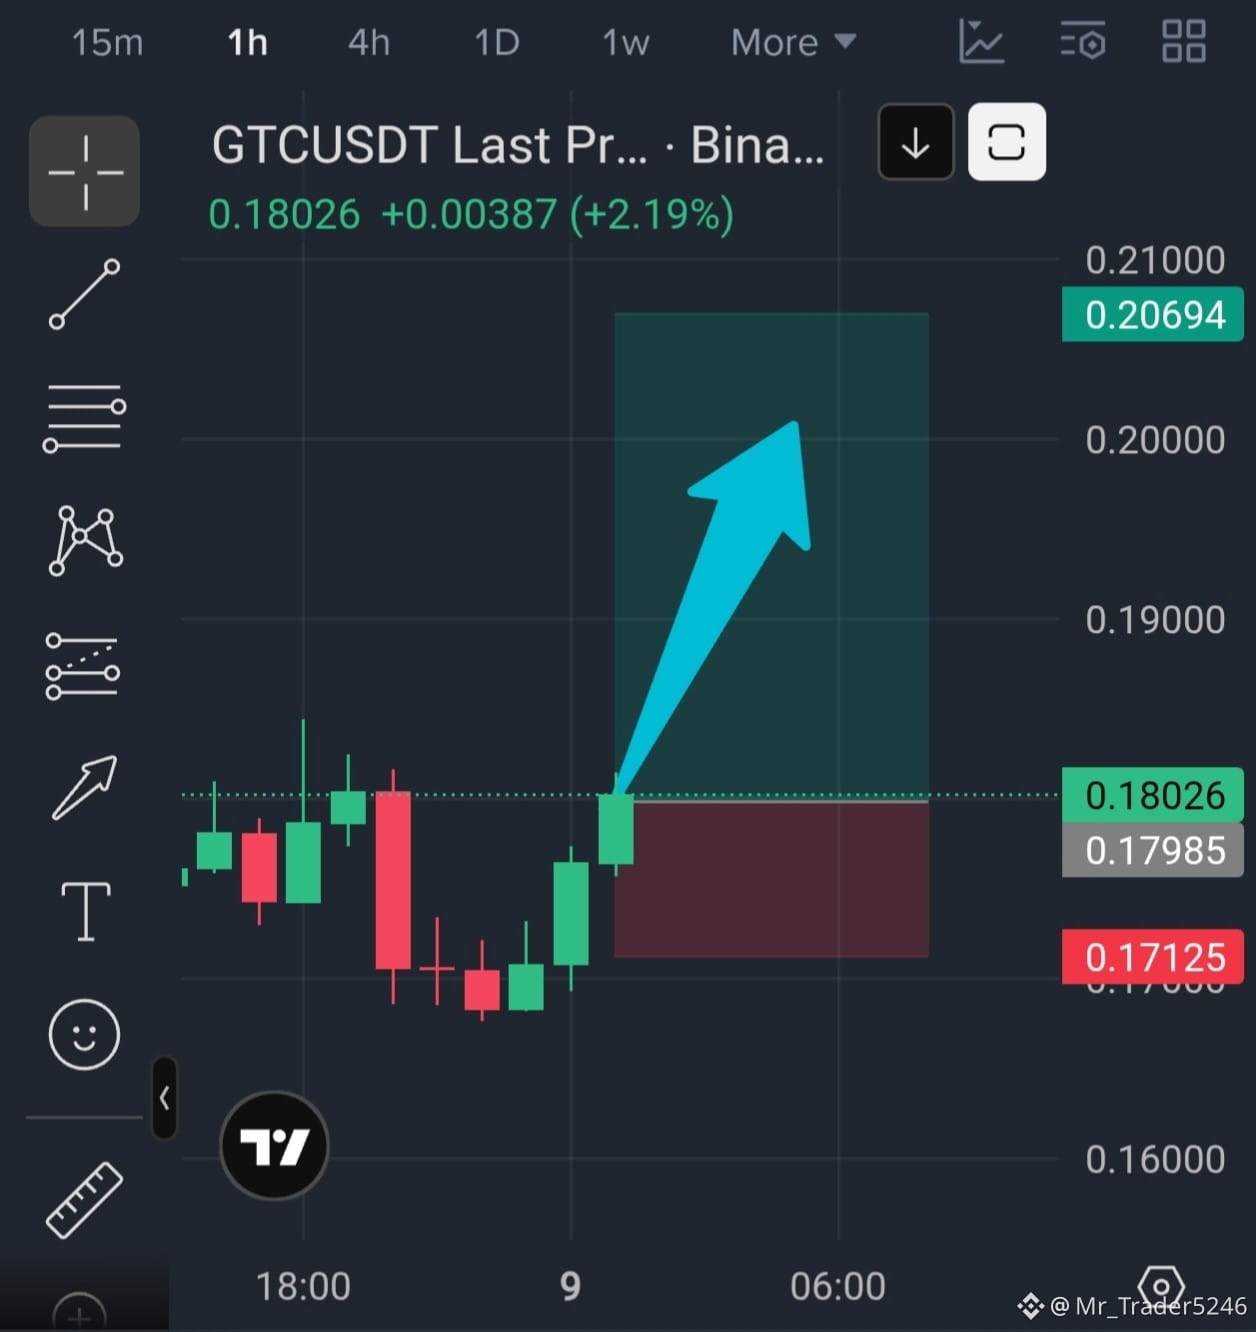
Guys, $GTC is showing bullish momentum on the 1H chart. Price has recovered strongly from the support zone, and buyers are stepping in.
If bullish momentum continues, we could see a move toward the $0.2000–$0.2069 resistance zone.
Entry Price: $0.17985 – $0.18050 🎯 Target: $0.20694 🛑 Stop Loss: $0.17125
Guys, $GTC is showing bullish momentum on the 1H chart. Price has recovered strongly from the support zone, and buyers are stepping in.
If bullish momentum continues, we could see a move toward the $0.2000–$0.2069 resistance zone.
Entry Price: $0.17985 – $0.18050 🎯 Target: $0.20694 🛑 Stop Loss: $0.17125
If bullish momentum continues, we could see a move toward the $0.2000–$0.2069 resistance zone.
Entry Price: $0.17985 – $0.18050 🎯 Target: $0.20694 🛑 Stop Loss: $0.17125
1
417
·
--
Bullish
Guys, $GTC is showing bullish momentum on the 1H chart. Price has recovered strongly from the support zone, and buyers are stepping in.
If bullish momentum continues, we could see a move toward the $0.2000–$0.2069 resistance zone.
Entry Price: $0.17985 – $0.18050 Target: $0.20694 Stop Loss: $0.17125
Trade Logic:
* Buyers are showing strength after the recent pullback.
* Price is recovering with bullish candles.
* A breakout above $0.1844 could strengthen the bullish setup.
Wait for bullish confirmation before entering. Manage your position carefully and never risk more than you can afford to lose.
Trade here 👇
{future}(GTCUSDT)
Guys, $GTC is showing bullish momentum on the 1H chart. Price has recovered strongly from the support zone, and buyers are stepping in.
If bullish momentum continues, we could see a move toward the $0.2000–$0.2069 resistance zone.
Entry Price: $0.17985 – $0.18050 Target: $0.20694 Stop Loss: $0.17125
Trade Logic:
* Buyers are showing strength after the recent pullback.
* Price is recovering with bullish candles.
* A breakout above $0.1844 could strengthen the bullish setup.
Wait for bullish confirmation before entering. Manage your position carefully and never risk more than you can afford to lose.
Trade here 👇
If bullish momentum continues, we could see a move toward the $0.2000–$0.2069 resistance zone.
Entry Price: $0.17985 – $0.18050 Target: $0.20694 Stop Loss: $0.17125
Trade Logic:
* Buyers are showing strength after the recent pullback.
* Price is recovering with bullish candles.
* A breakout above $0.1844 could strengthen the bullish setup.
Wait for bullish confirmation before entering. Manage your position carefully and never risk more than you can afford to lose.
Trade here 👇
1
82
$SXT USDT – SHORT Signal 🔴
Entry Zone: 0.00835 – 0.00845
Targets 🎯
* TP1: 0.00820
* TP2: 0.00800
* TP3: 0.00780
* TP4: 0.00760
* TP5: 0.00742
Stop Loss: 0.008735
$SXT USDT – SHORT Signal 🔴
Entry Zone: 0.00835 – 0.00845
Targets 🎯
* TP1: 0.00820
* TP2: 0.00800
* TP3: 0.00780
* TP4: 0.00760
* TP5: 0.00742
Stop Loss: 0.008735
Entry Zone: 0.00835 – 0.00845
Targets 🎯
* TP1: 0.00820
* TP2: 0.00800
* TP3: 0.00780
* TP4: 0.00760
* TP5: 0.00742
Stop Loss: 0.008735
1
117
$JCT USDT – Bearish Setup 🔴
JCT has pumped more than 216% in 24 hours. After this massive rally, sellers are starting to take control, and price is showing signs of a pullback.
Potential SHORT Setup
* Entry Zone: 0.00920 – 0.00950
* TP1: 0.00850
* TP2: 0.00750
* TP3: 0.00650
* TP4: 0.00550
* TP5: 0.00470
* Stop Loss: 0.01070
$JCT USDT – Bearish Setup 🔴
JCT has pumped more than 216% in 24 hours. After this massive rally, sellers are starting to take control, and price is showing signs of a pullback.
Potential SHORT Setup
* Entry Zone: 0.00920 – 0.00950
* TP1: 0.00850
* TP2: 0.00750
* TP3: 0.00650
* TP4: 0.00550
* TP5: 0.00470
* Stop Loss: 0.01070
JCT has pumped more than 216% in 24 hours. After this massive rally, sellers are starting to take control, and price is showing signs of a pullback.
Potential SHORT Setup
* Entry Zone: 0.00920 – 0.00950
* TP1: 0.00850
* TP2: 0.00750
* TP3: 0.00650
* TP4: 0.00550
* TP5: 0.00470
* Stop Loss: 0.01070
2
762
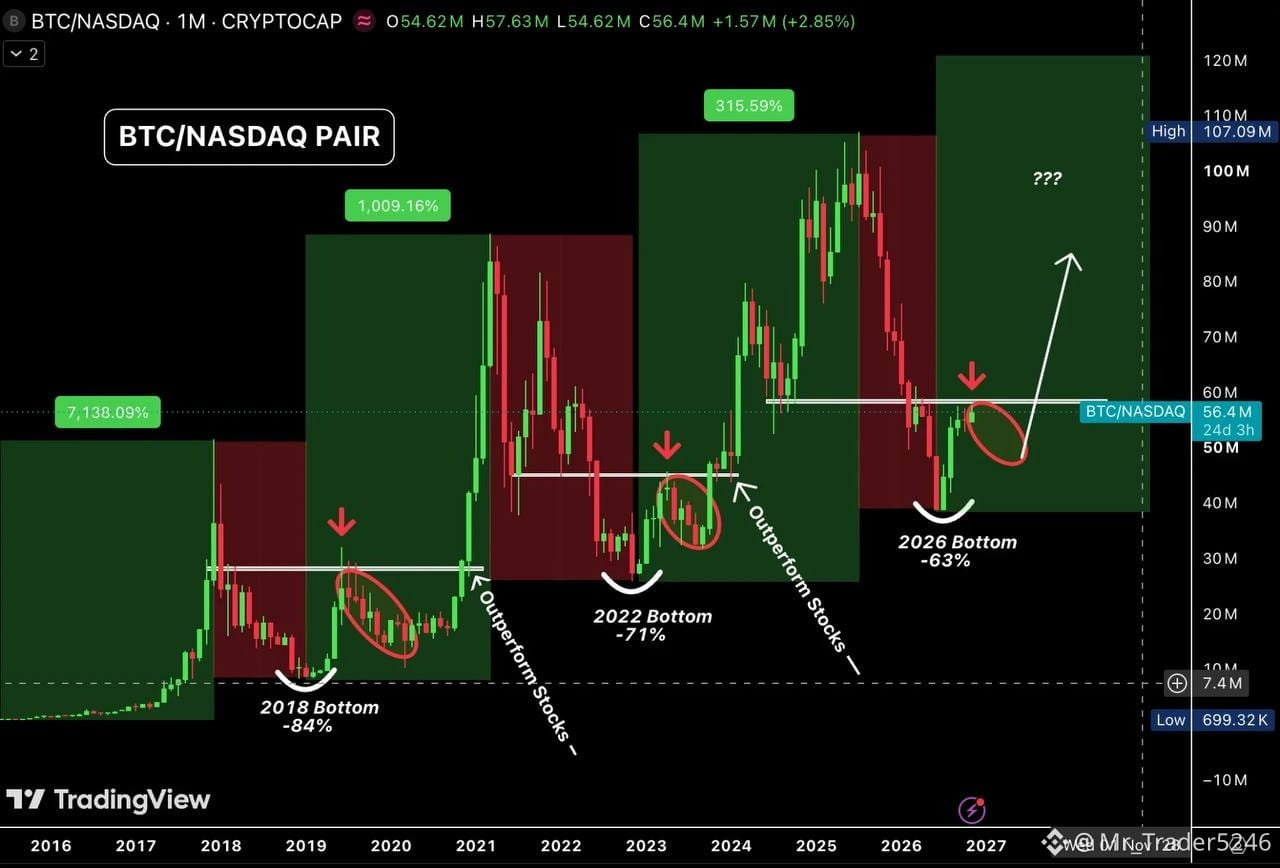
Wall Street has been watching $BTC closely, and this chart tells an interesting story.
Over the past four months, Bitcoin has been outperforming the Nasdaq.
Even this week, while Nasdaq took a hard hit, Bitcoin managed to hold around $75,500. It's also outperforming Nasdaq so far this month.
Now, here's what matters:
-The BTC/Nasdaq pair is testing resistance again.
-If Bitcoin holds its current support, that's a very bullish sign.
-But if it breaks down, we could see another test of the daily MA 200 near $73,240, followed by the weekly MA 200 around $67,760.
Looking at the bigger picture, this structure could take another 6–8 months of sideways movement before the next parabolic rally.
{future}(BTCUSDT)
Wall Street has been watching $BTC closely, and this chart tells an interesting story.
Over the past four months, Bitcoin has been outperforming the Nasdaq.
Even this week, while Nasdaq took a hard hit, Bitcoin managed to hold around $75,500. It's also outperforming Nasdaq so far this month.
Now, here's what matters:
-The BTC/Nasdaq pair is testing resistance again.
-If Bitcoin holds its current support, that's a very bullish sign.
-But if it breaks down, we could see another test of the daily MA 200 near $73,240, followed by the weekly MA 200 around $67,760.
Looking at the bigger picture, this structure could take another 6–8 months of sideways movement before the next parabolic rally.
Over the past four months, Bitcoin has been outperforming the Nasdaq.
Even this week, while Nasdaq took a hard hit, Bitcoin managed to hold around $75,500. It's also outperforming Nasdaq so far this month.
Now, here's what matters:
-The BTC/Nasdaq pair is testing resistance again.
-If Bitcoin holds its current support, that's a very bullish sign.
-But if it breaks down, we could see another test of the daily MA 200 near $73,240, followed by the weekly MA 200 around $67,760.
Looking at the bigger picture, this structure could take another 6–8 months of sideways movement before the next parabolic rally.
1
52
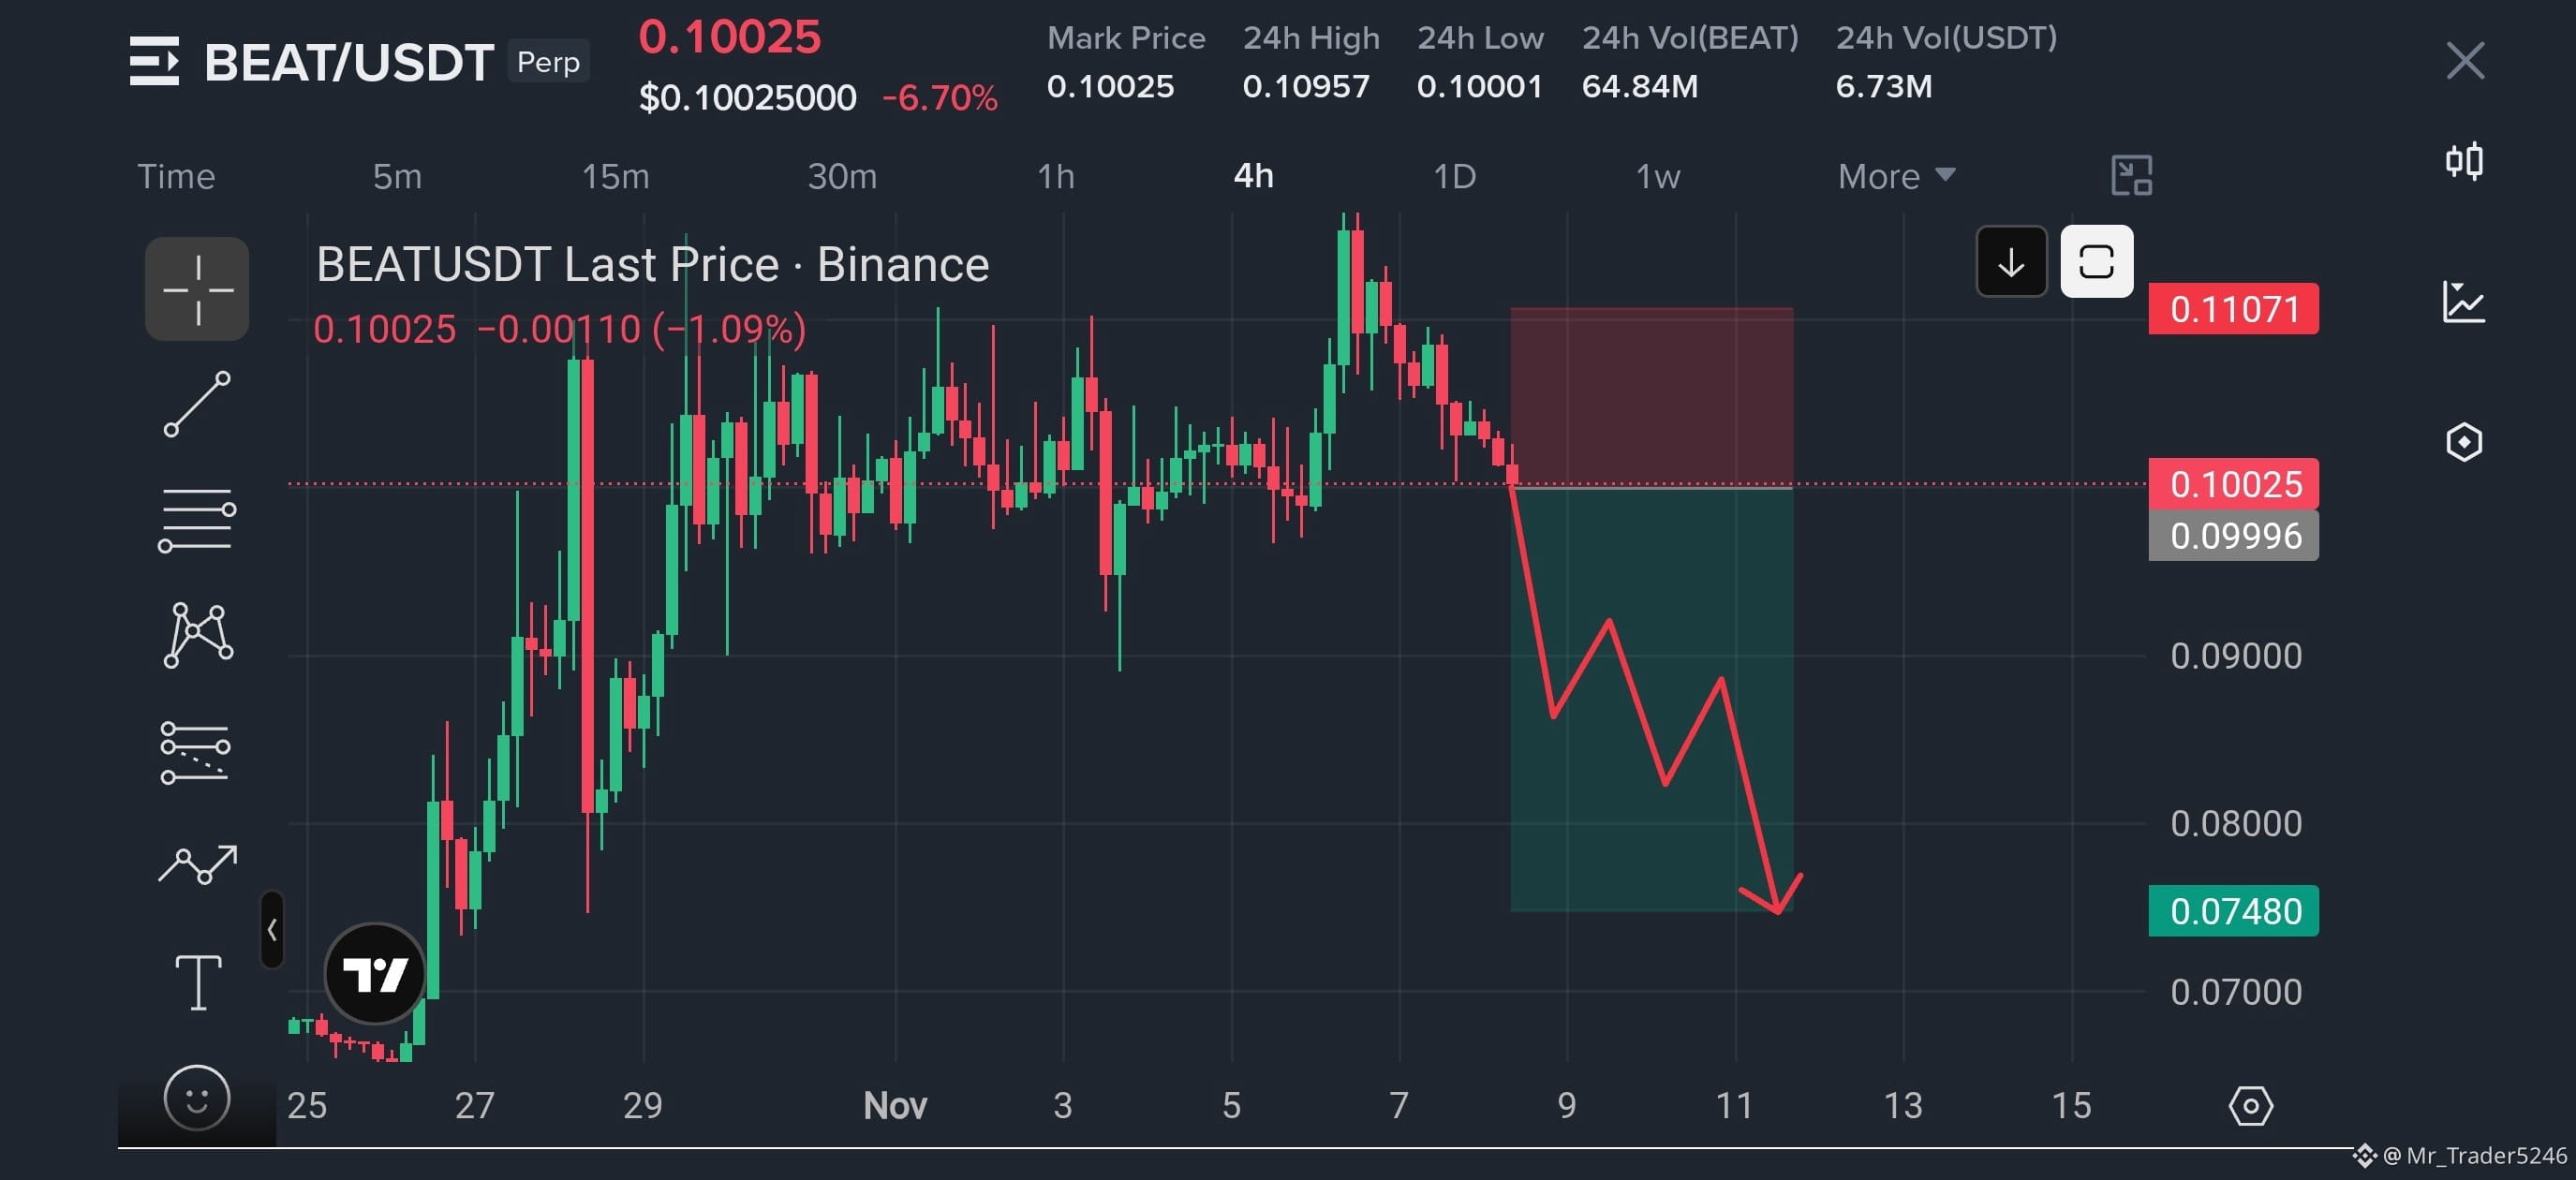
$BEAT USDT – BEARISH SETUP 🔴
Current Price: $0.10025
Short Entry: $0.1000 – $0.1010
Targets 🎯
* TP1: $0.0900
* TP2: $0.0850
* TP3: $0.0800
* TP4: $0.0748
Stop Loss: $0.1107
$BEAT USDT – BEARISH SETUP 🔴
Current Price: $0.10025
Short Entry: $0.1000 – $0.1010
Targets 🎯
* TP1: $0.0900
* TP2: $0.0850
* TP3: $0.0800
* TP4: $0.0748
Stop Loss: $0.1107
Current Price: $0.10025
Short Entry: $0.1000 – $0.1010
Targets 🎯
* TP1: $0.0900
* TP2: $0.0850
* TP3: $0.0800
* TP4: $0.0748
Stop Loss: $0.1107
1
533
·
--
Bearish
$BEAT USDT – BEARISH SETUP 🔴
Current Price: $0.10025
Short Entry: $0.1000 – $0.1010
Targets 🎯
* TP1: $0.0900
* TP2: $0.0850
* TP3: $0.0800
* TP4: $0.0748
Stop Loss: $0.1107
Technical Analysis:
* BEAT is showing bearish momentum after rejection from the $0.109–$0.110 resistance zone.
* The 4H chart is forming lower highs.
* A confirmed breakdown below $0.0999 could trigger further downside.
* A retest of broken support may provide another short opportunity.
My View: BEAT could see a deeper correction toward $0.0748 if selling pressure continues.
Trade here 👇
{future}(BEATUSDT)
$BEAT USDT – BEARISH SETUP 🔴
Current Price: $0.10025
Short Entry: $0.1000 – $0.1010
Targets 🎯
* TP1: $0.0900
* TP2: $0.0850
* TP3: $0.0800
* TP4: $0.0748
Stop Loss: $0.1107
Technical Analysis:
* BEAT is showing bearish momentum after rejection from the $0.109–$0.110 resistance zone.
* The 4H chart is forming lower highs.
* A confirmed breakdown below $0.0999 could trigger further downside.
* A retest of broken support may provide another short opportunity.
My View: BEAT could see a deeper correction toward $0.0748 if selling pressure continues.
Trade here 👇
Current Price: $0.10025
Short Entry: $0.1000 – $0.1010
Targets 🎯
* TP1: $0.0900
* TP2: $0.0850
* TP3: $0.0800
* TP4: $0.0748
Stop Loss: $0.1107
Technical Analysis:
* BEAT is showing bearish momentum after rejection from the $0.109–$0.110 resistance zone.
* The 4H chart is forming lower highs.
* A confirmed breakdown below $0.0999 could trigger further downside.
* A retest of broken support may provide another short opportunity.
My View: BEAT could see a deeper correction toward $0.0748 if selling pressure continues.
Trade here 👇
1
1
420
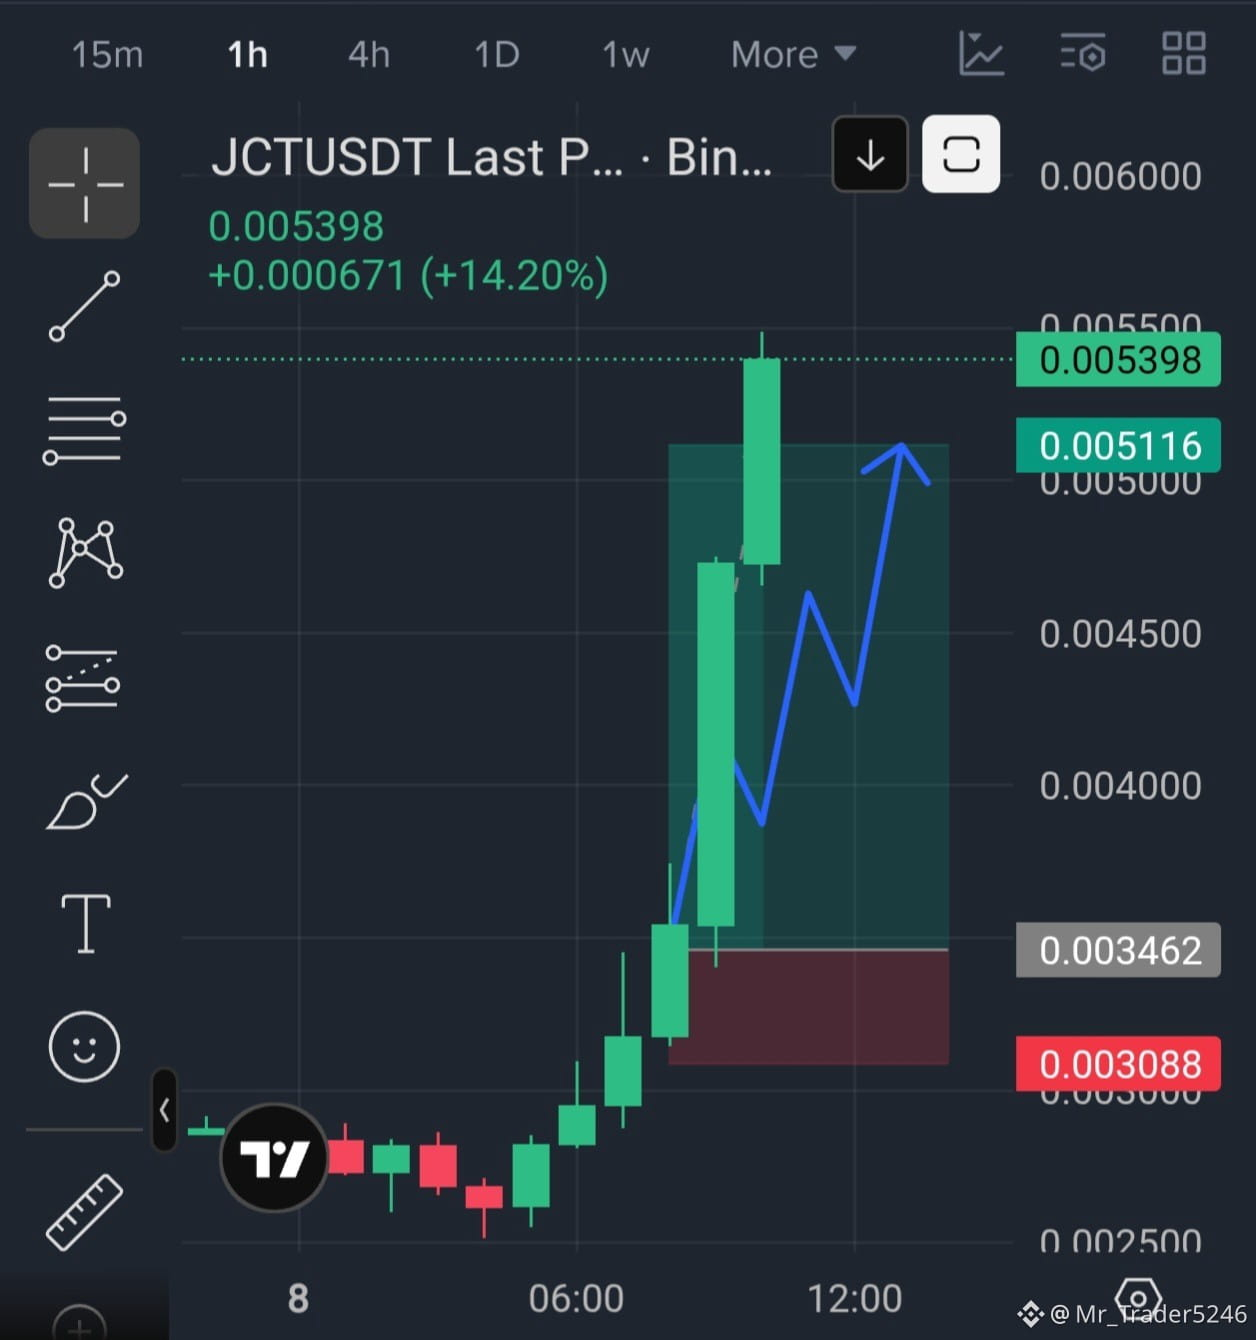
$JCT All target done guys 🫡 enjoy and make sure follow up 🫡
$JCT All target done guys 🫡 enjoy and make sure follow up 🫡
Mr_Trader5246
·
--
Bullish$JCT USDT — LONG Setup 📈
Entry Zone: 0.00340 – 0.00346
Take Profit Targets:
* TP1: 0.00380
* TP2: 0.00420
* TP3: 0.00460
* TP4: 0.00485
* TP5: 0.00511
Stop Loss: 0.003088
Technical Analysis:
* Strong bullish momentum on the 15-minute chart.
* Increasing buying volume indicates strong market participation.
* Price has broken out of its previous consolidation zone.
* A successful retest of 0.00340–0.00346 could support further upside.
* Next major upside target is around 0.00511.
⚠️ Important: Avoid chasing the pump. Wait for a confirmed breakout or retest before entering. The setup can fail if price loses support.
Trade here 👇
Entry Zone: 0.00340 – 0.00346
Take Profit Targets:
* TP1: 0.00380
* TP2: 0.00420
* TP3: 0.00460
* TP4: 0.00485
* TP5: 0.00511
Stop Loss: 0.003088
Technical Analysis:
* Strong bullish momentum on the 15-minute chart.
* Increasing buying volume indicates strong market participation.
* Price has broken out of its previous consolidation zone.
* A successful retest of 0.00340–0.00346 could support further upside.
* Next major upside target is around 0.00511.
⚠️ Important: Avoid chasing the pump. Wait for a confirmed breakout or retest before entering. The setup can fail if price loses support.
Trade here 👇
1
263
·
--
Bullish
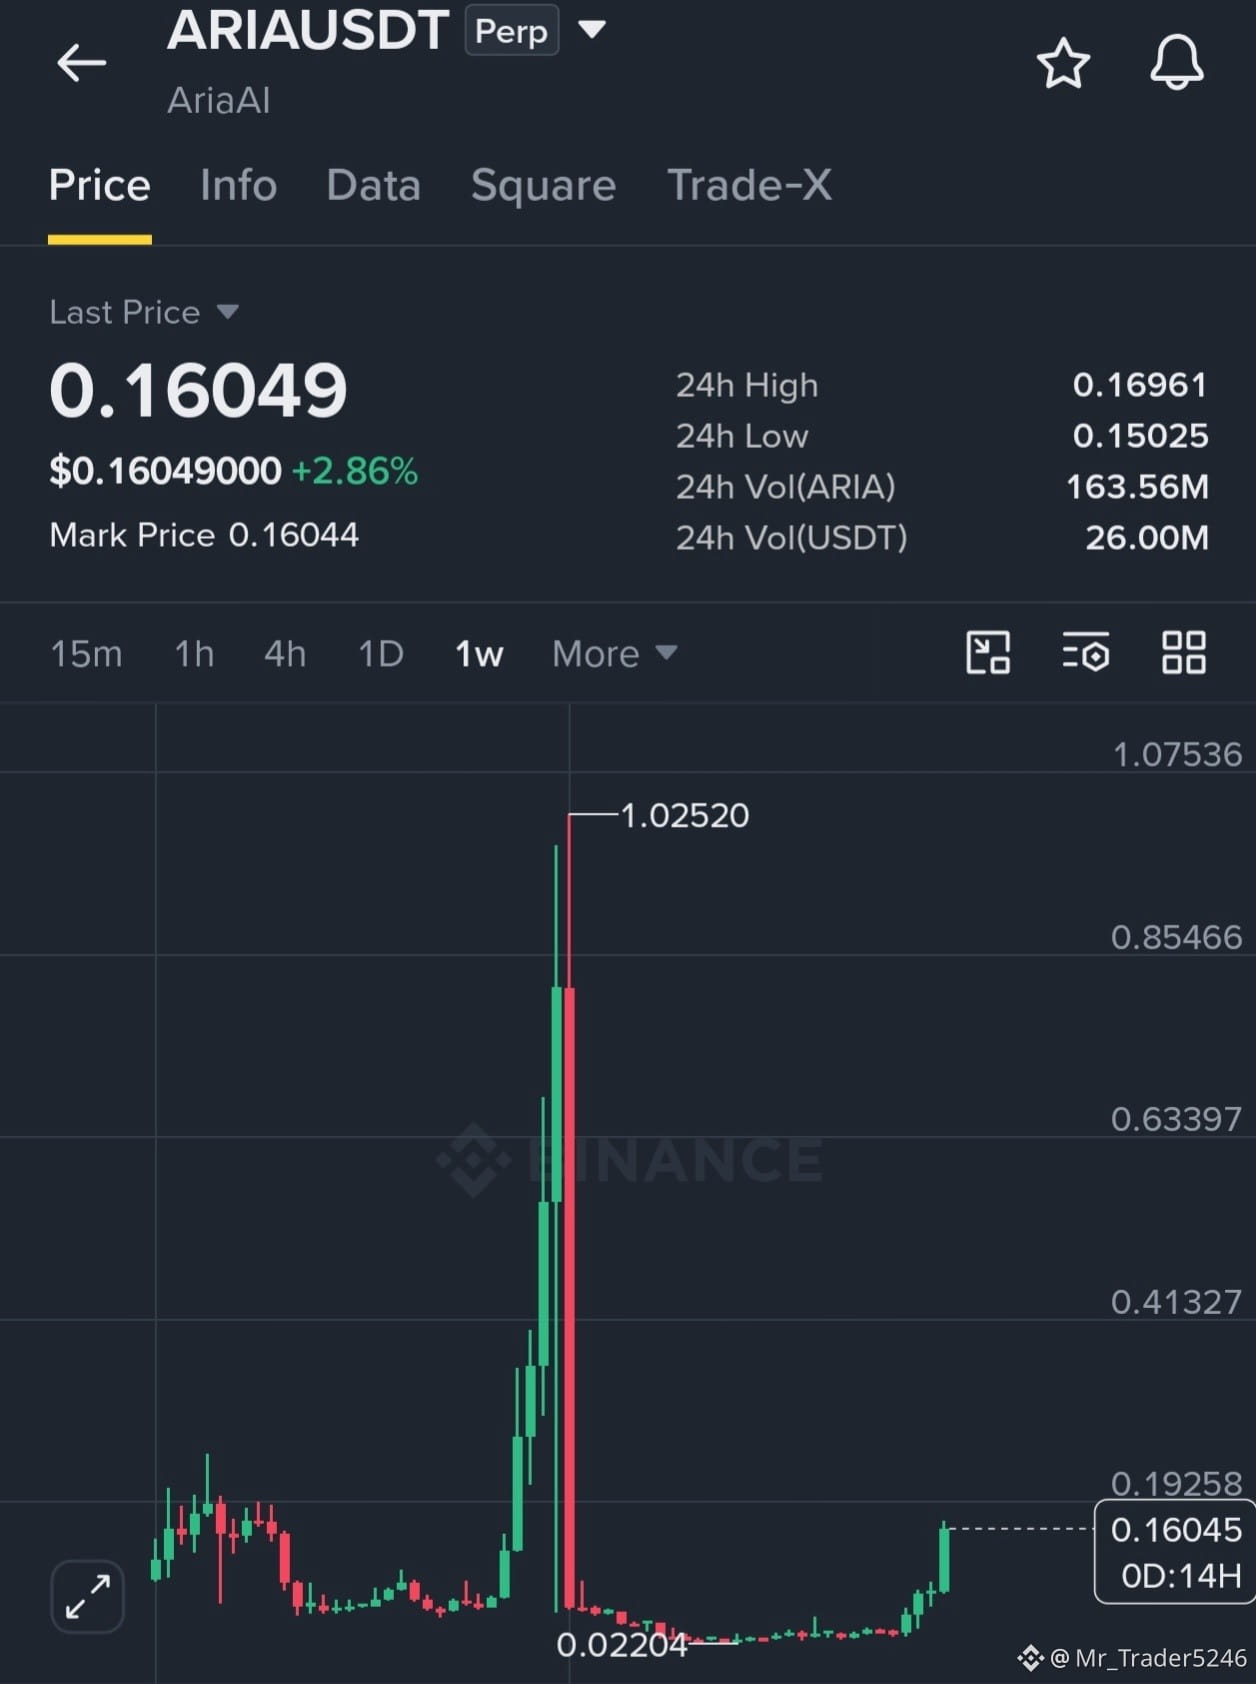
$ARIA – BIG MOVE COMING?
ARIA is showing strong bullish momentum! 📈
After a massive breakout, buyers are stepping in again. Keep an eye on this one — another big pump could be on the way! 🔥
Are you bullish on ARIA? 👀
{future}(ARIAUSDT)
#ARIA #crypto #Altcoins #BinanceSquare
$ARIA – BIG MOVE COMING?
ARIA is showing strong bullish momentum! 📈
After a massive breakout, buyers are stepping in again. Keep an eye on this one — another big pump could be on the way! 🔥
Are you bullish on ARIA? 👀
#ARIA #crypto #Altcoins #BinanceSquare
ARIA is showing strong bullish momentum! 📈
After a massive breakout, buyers are stepping in again. Keep an eye on this one — another big pump could be on the way! 🔥
Are you bullish on ARIA? 👀
#ARIA #crypto #Altcoins #BinanceSquare
2
318
$IDOL USDT – Bearish Setup (15M)
IDOL has already pumped around 32% in 24 hours. Price is showing rejection near the upper resistance zone, suggesting a possible correction.
Potential Short Trade
* Entry: 0.0322 – 0.0328
* TP1: 0.0300
* TP2: 0.0280
* TP3: 0.0260
* TP4: 0.0245
* TP5: 0.0235
* Stop Loss: 0.0353
$IDOL USDT – Bearish Setup (15M)
IDOL has already pumped around 32% in 24 hours. Price is showing rejection near the upper resistance zone, suggesting a possible correction.
Potential Short Trade
* Entry: 0.0322 – 0.0328
* TP1: 0.0300
* TP2: 0.0280
* TP3: 0.0260
* TP4: 0.0245
* TP5: 0.0235
* Stop Loss: 0.0353
IDOL has already pumped around 32% in 24 hours. Price is showing rejection near the upper resistance zone, suggesting a possible correction.
Potential Short Trade
* Entry: 0.0322 – 0.0328
* TP1: 0.0300
* TP2: 0.0280
* TP3: 0.0260
* TP4: 0.0245
* TP5: 0.0235
* Stop Loss: 0.0353
1
72
$JCT USDT — LONG Setup 📈
Entry Zone: 0.00340 – 0.00346
Take Profit Targets:
* TP1: 0.00380
* TP2: 0.00420
* TP3: 0.00460
* TP4: 0.00485
* TP5: 0.00511
Stop Loss: 0.003088
$JCT USDT — LONG Setup 📈
Entry Zone: 0.00340 – 0.00346
Take Profit Targets:
* TP1: 0.00380
* TP2: 0.00420
* TP3: 0.00460
* TP4: 0.00485
* TP5: 0.00511
Stop Loss: 0.003088
Entry Zone: 0.00340 – 0.00346
Take Profit Targets:
* TP1: 0.00380
* TP2: 0.00420
* TP3: 0.00460
* TP4: 0.00485
* TP5: 0.00511
Stop Loss: 0.003088
2
259
Guys, $JCT is showing strong bullish momentum on the 15-minute timeframe.
Reason for LONG:
Strong bullish candles indicate increasing buying pressure.
Volume is increasing, supporting the upward momentum.
Price has broken above its recent consolidation zone.
Buyers are currently showing strength, which could push the price towards higher resistance levels.
Entry Zone: 0.00340 – 0.00346
Take Profit Targets:
TP1: 0.00370
TP2: 0.00400
TP3: 0.00440
TP4: 0.00480
TP5: 0.00510
Stop Loss: 0.00308
Guys, $JCT is showing strong bullish momentum on the 15-minute timeframe.
Reason for LONG:
Strong bullish candles indicate increasing buying pressure.
Volume is increasing, supporting the upward momentum.
Price has broken above its recent consolidation zone.
Buyers are currently showing strength, which could push the price towards higher resistance levels.
Entry Zone: 0.00340 – 0.00346
Take Profit Targets:
TP1: 0.00370
TP2: 0.00400
TP3: 0.00440
TP4: 0.00480
TP5: 0.00510
Stop Loss: 0.00308
Reason for LONG:
Strong bullish candles indicate increasing buying pressure.
Volume is increasing, supporting the upward momentum.
Price has broken above its recent consolidation zone.
Buyers are currently showing strength, which could push the price towards higher resistance levels.
Entry Zone: 0.00340 – 0.00346
Take Profit Targets:
TP1: 0.00370
TP2: 0.00400
TP3: 0.00440
TP4: 0.00480
TP5: 0.00510
Stop Loss: 0.00308
2
200
$ETH USDT — LONG Setup 📈
Entry Zone: $2,239.75 – $2,240.55
Take Profit Targets:
* TP1: $2,244.00
* TP2: $2,247.00
* TP3: $2,251.50
Stop Loss: $2,234.99
$ETH USDT — LONG Setup 📈
Entry Zone: $2,239.75 – $2,240.55
Take Profit Targets:
* TP1: $2,244.00
* TP2: $2,247.00
* TP3: $2,251.50
Stop Loss: $2,234.99
Entry Zone: $2,239.75 – $2,240.55
Take Profit Targets:
* TP1: $2,244.00
* TP2: $2,247.00
* TP3: $2,251.50
Stop Loss: $2,234.99
2
47
$KOMA USDT — SHORT Setup 📉
Entry Zone: $0.02240 – $0.02260
Take Profit Targets:
* TP1: $0.02150
* TP2: $0.02050
* TP3: $0.01950
* TP4: $0.01855
Stop Loss: $0.02410
$KOMA USDT — SHORT Setup 📉
Entry Zone: $0.02240 – $0.02260
Take Profit Targets:
* TP1: $0.02150
* TP2: $0.02050
* TP3: $0.01950
* TP4: $0.01855
Stop Loss: $0.02410
Entry Zone: $0.02240 – $0.02260
Take Profit Targets:
* TP1: $0.02150
* TP2: $0.02050
* TP3: $0.01950
* TP4: $0.01855
Stop Loss: $0.02410
2
132
Log in to explore more content
Join global crypto users on Binance Square
⚡️ Get latest and useful information about crypto.
💬 Trusted by the world’s largest crypto exchange.
👍 Discover real insights from verified creators.
Email / Phone number
Trending Topics
BitcoinFiveWeeklyLosses
10,803 views
378 Discussing
Bitcoin News | Bitcoin Slides for Five Straight Weeks as AI Stock Rout Spills Into Crypto
Binance News
·7 Likes
·9.2k views
AIChipSlumpNasdaq
6,197 views
201 Discussing
NvidiaInvestigatesAfterHuang’sAffairApology
3,908 views
107 Discussing