

子午日界数据员
336 Posts

子午日界数据员
Report
Block User
High-Frequency Trader
8.8 Years
21 Following
17 Followers
321 Liked
Posts
·
--
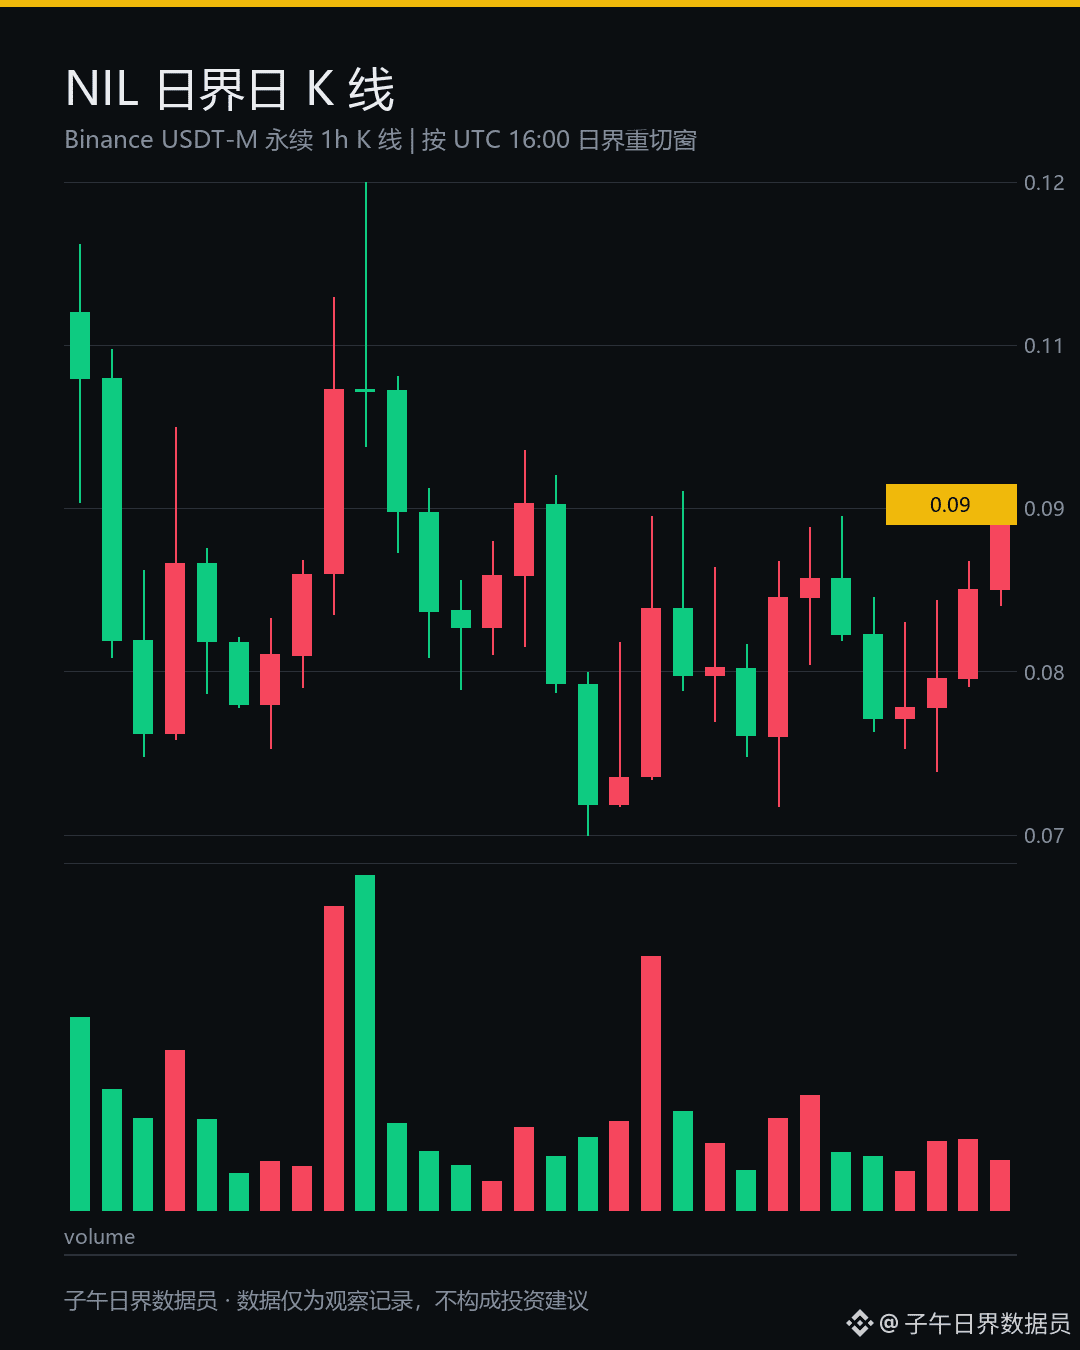
Everyone, $NIL closed at 0.09371 on the daily cutoff, up 9.538% over 24 hours.
I’ve been watching that 71st-percentile level for a long time.
The current price has already returned to the 70% mark of the 20-day range. It’s just that the short sellers’ cost-basis zone, formed by that long wick overhead, hasn’t been fully absorbed yet.
Three consecutive green candles.
2.546, 7.668, 6.521—each one cleaner than the last.
Honestly, at first glance I thought it was just a wick. It took looking through all three daily candles for me to believe that buying support was lifting the price.
The 24-hour high reached 0.095, the low was 0.08329, and the range was 14.059%.
Volatility was clearly elevated, coming in 11.97% above the daily ATR14.
By my read, this looks more like a rebound in sentiment across the sector than the payoff from a new thesis.
Coins have changed hands on the way up from around 0.07074, like someone taking inventory in a warehouse all over again. Overnight, the pool of holders sitting on profits has grown, and the urge to take short-term profits will likely strengthen.
Up 20.543% in seven trading days.
I’m not chasing this move.
Paying less attention doesn’t mean I’m bearish. I just want to wait for price to return to the support zone near 0.085—like waiting for a slow train. There’s no need to rush.
What do you all think? Let’s chat in the comments.
$BTC $ETH
#NIL #比特币 #Cryptocurrency
The above reflects my personal trading-system records and observations of data; it does not constitute investment advice.
1
105
·
--
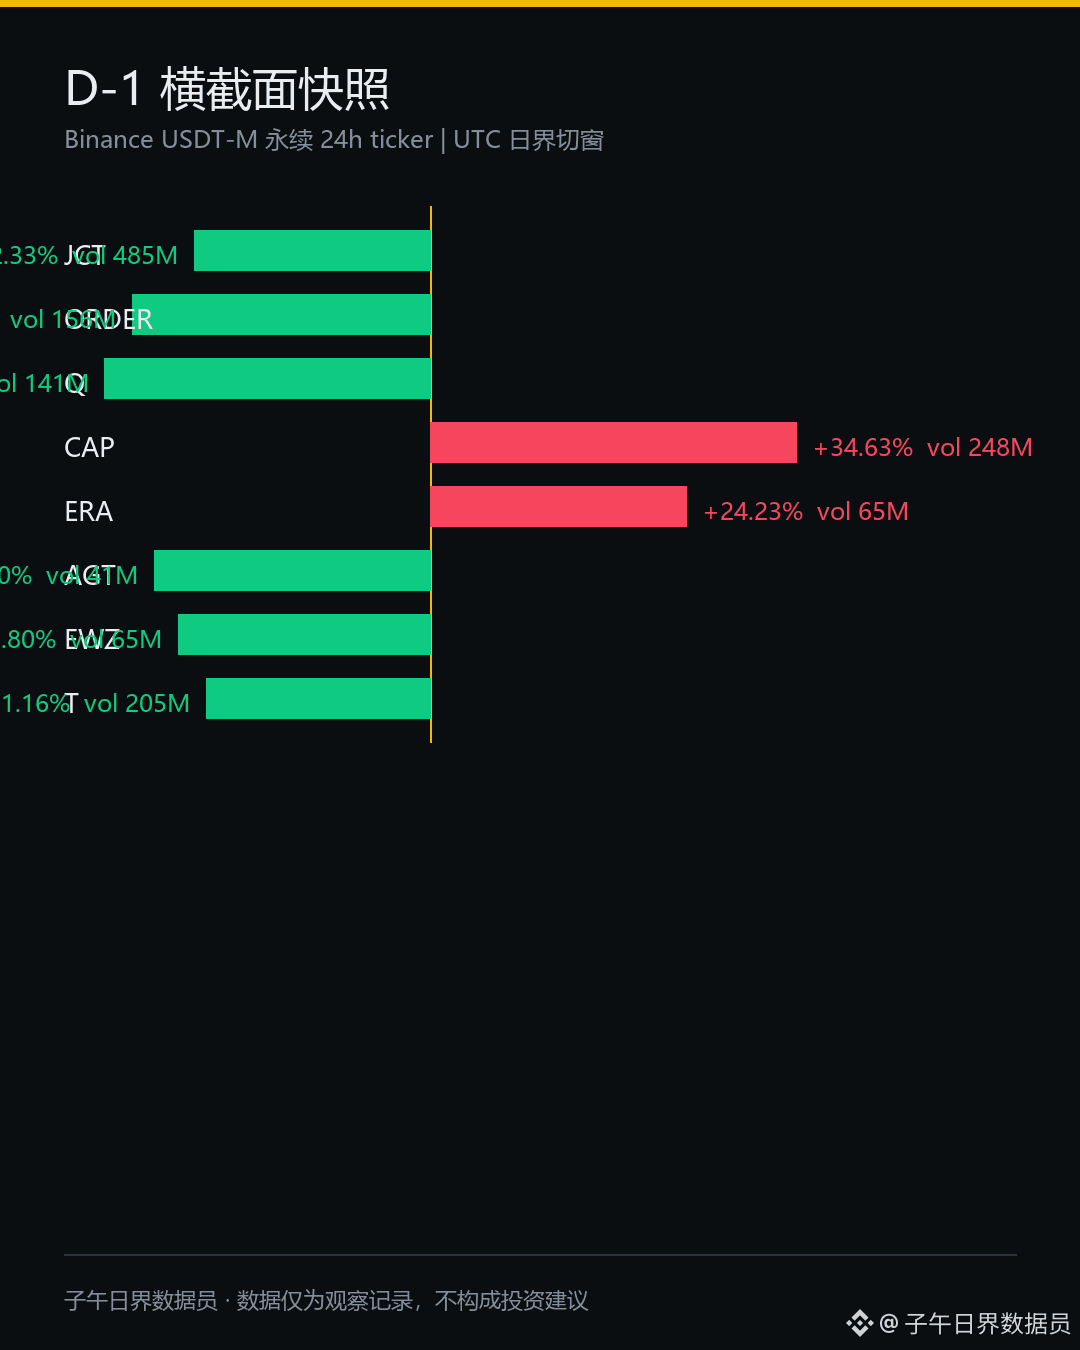
$TIA This week gave back some of last month’s gains.
0.5301 was the daily close. It’s down 13.847% over 7 days, but still up 4.064% over 30 days, so it’s still in the green for the month overall.
I like this kind of contradictory data.
The 20-day range is 0.4346 to 0.769. The current price is at the 28.56th percentile—not high or low, and holders don’t seem to be in a rush to sell.
The average daily volatility is 13.162%—it can swing more than ten points in a day.
Why is falling volume more worth watching than falling prices?
Celestia operates in the data availability sector. It’s like building warehouses for the whole blockchain: the more capacity you have, the more orders you can take.
But warehouses fill up first when on-chain demand picks up, and empty out first when demand contracts.
Trading volume over the past three days fell from 64.72 million to 33.50 million. In the first four hours today, it was just 8.35 million. Volume is shrinking faster than the price.
Honestly, volume moves first and price follows—that’s a sequence I had to check twice before believing.
I don’t think the sector’s fundamentals are broken. It looks more like capital is rotating between sectors, and money is being pulled out of this one.
When Bitcoin moves sideways, high-beta assets like this are the first to lose blood. And when something starts happening on Ethereum, modular projects still have to take a back seat.
What do you all think? Let’s talk in the comments.
$BTC $ETH
#JCT #ORDER #Crypto
The above is a record of my personal trading system and observations of the data, and does not constitute investment advice.
1
171
·
--
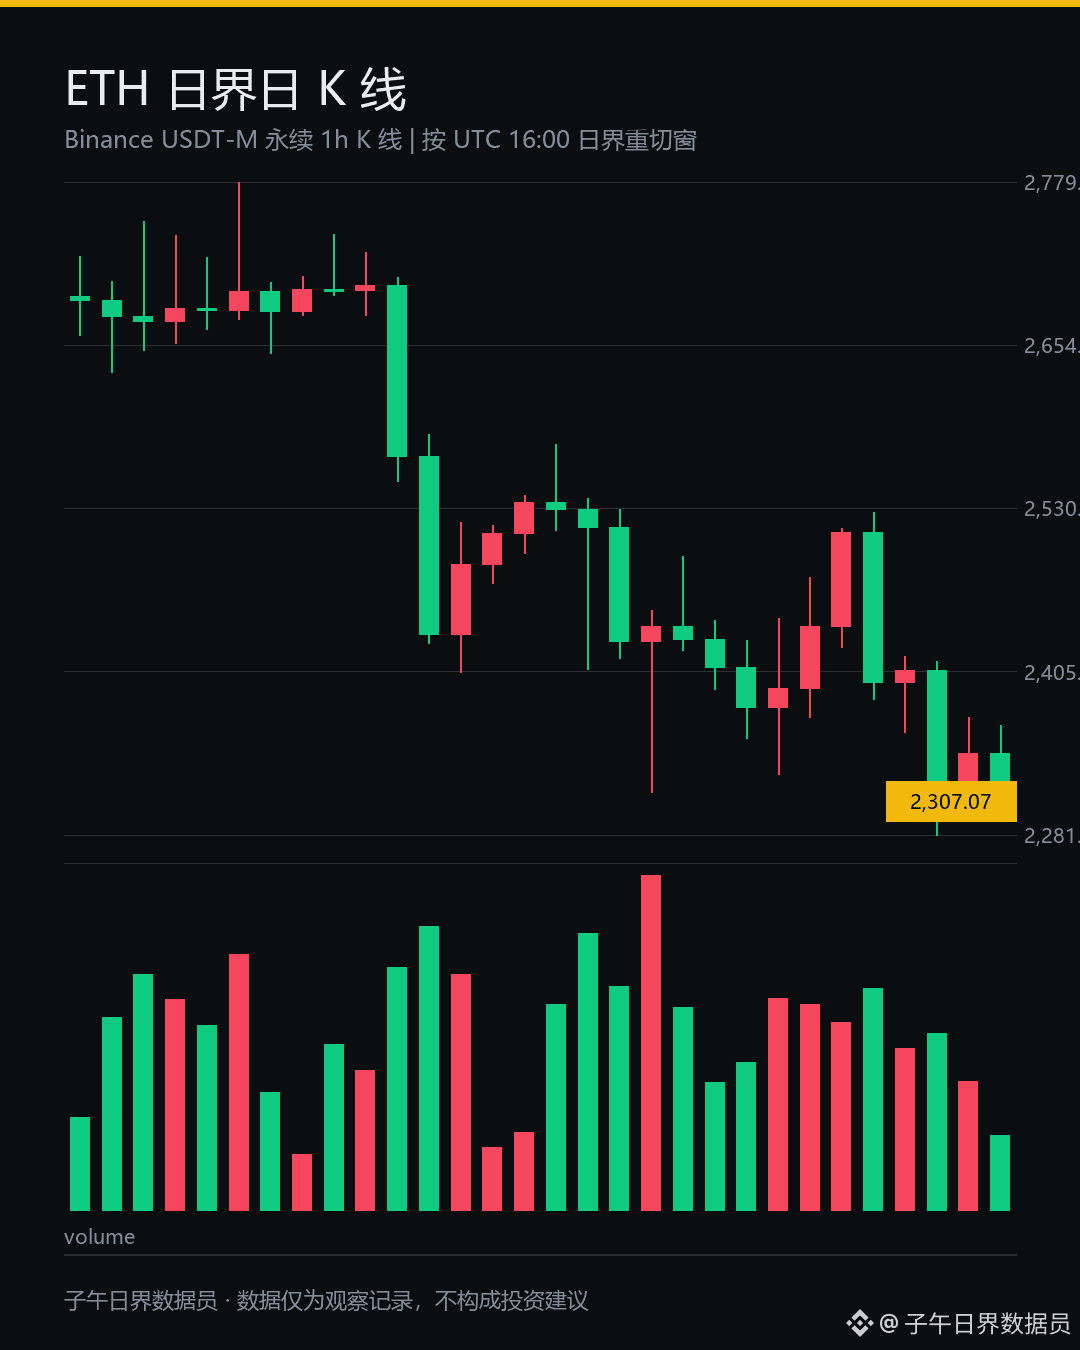
Everyone, the most noteworthy thing about $ETH today isn’t how much it’s fallen.
I checked a few sources; here’s my synthesis.
24 hours: -2.452%, current price: 2306.71.
Intraday high: 2370.79, low: 2298.0. The range is just 3.168%, and the price is now -2.703% from the high.
The 10-day range is 2526.99 to 2281.22. The current price sits at the 10.371% percentile, like a reservoir’s water level dropping to its lowest mark.
24-hour volume: 5.58 billion USDT, across 3.03 million trades.
The money hasn’t left.
Funding rate: +0.0000599%. Neither side of the market is willing to pay even a penny more.
Of the past 24 hourly candles, 9 closed up. The 10-day change is -4.779%, and the 3-day change is -3.345%.
A slow bleed, not a crash.
At first glance, I thought I’d misread the funding rate. I checked twice before I believed it—the rate is pinned so stubbornly close to zero, even for an asset this large.
What’s missing has never been supply; it’s a fresh narrative.
The catalyst this sector is waiting for hasn’t arrived. Whoever moves first risks getting buried, so everyone would rather wait at the door than step inside.
By my read, this is a time to stay alert. The price is there, but the spark hasn’t caught—I’m not jumping in ahead of everyone else.
What do you think this move is waiting for: news or volume? Let’s talk in the comments.
$BTC $SOL
#以太坊 #比特币 #Cryptocurrency
The above is a record of my personal trading system and observations of market data. It does not constitute investment advice.
1
268
·
--
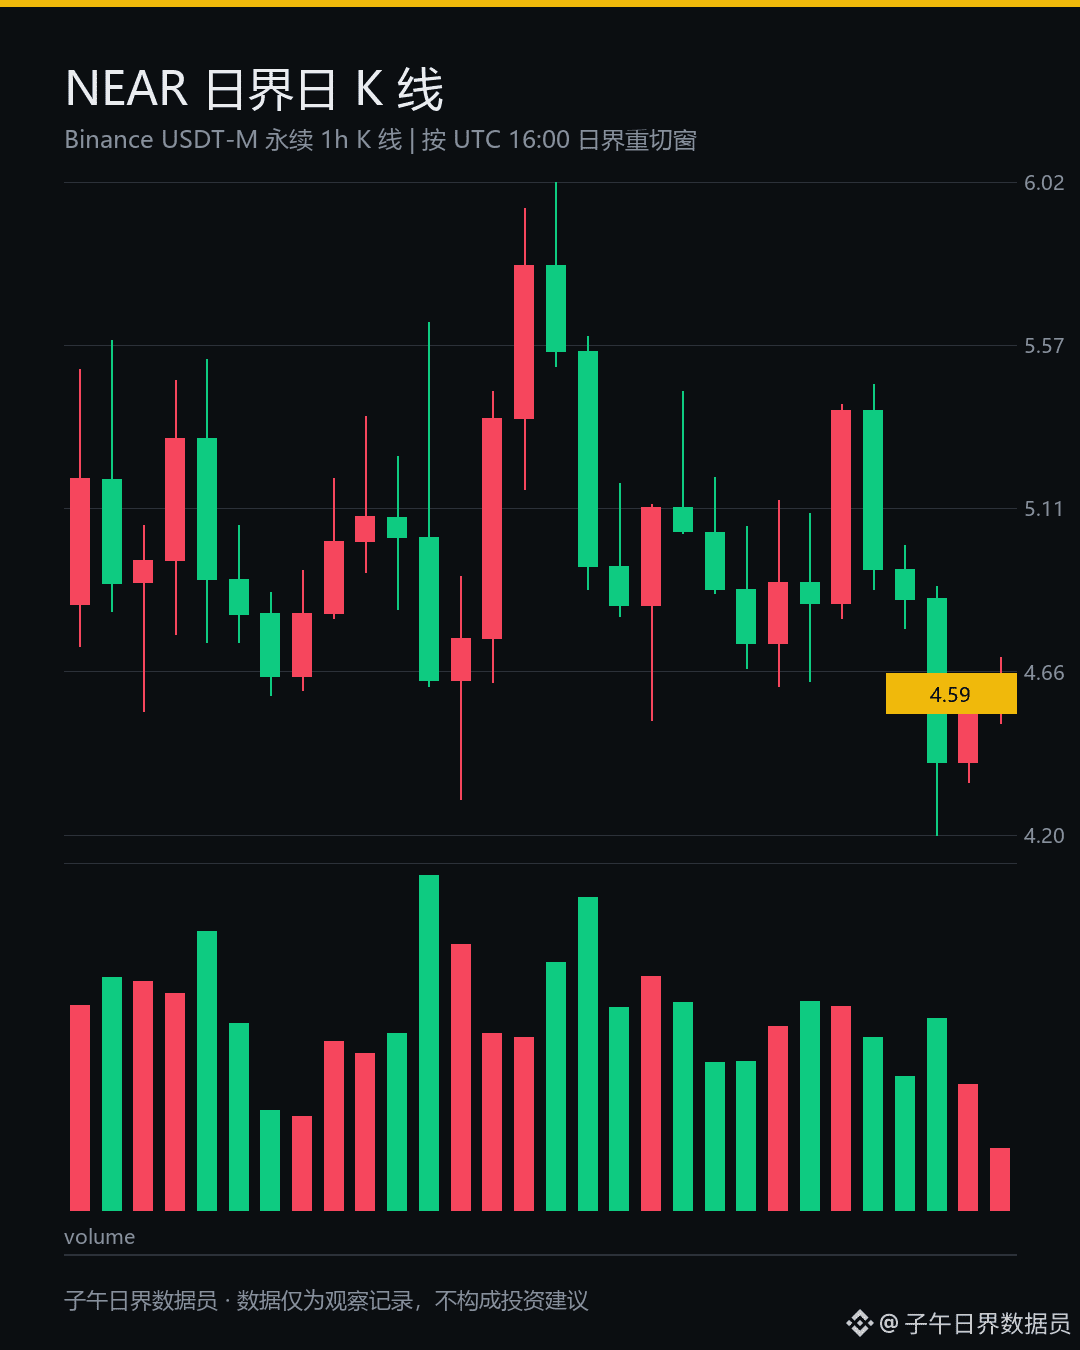
Everyone, I’ve been keeping an eye on $NEAR for almost ten days.
It slid all the way from the October 21 high of 5.459 to 4.597 today, down a full 9.276% over ten days.
Liquidity has never really picked up; 24-hour trading volume is 475.55M.
At first glance, I thought I was seeing things. I checked twice before believing it. The current price sits at the 31.533% mark of its ten-day range of 4.2 to 5.459, right near the bottom.
Money is like water: when it flows downhill, nobody calls it out. People only notice once it’s pooled up.
Right now, it’s like a warehouse nobody pays attention to. The goods are still there; there’s just nobody coming to move them.
The funding rate is -0.0345%. Short positions are still paying, but only a little. Over the same ten days, $BTC barely moved 1.812%,
and $SOL is only down 0.87% today. The broader market hasn’t joined in on its decline at all.
Holding steady near the lows is the most frustrating part.
At this level, I’m not making a move. The rotation money went elsewhere, leaving it to take the hit on its own. This looks more like the supply is gradually being absorbed, rather than dumped.
You might be wondering: has it finished falling? I can’t guarantee that. My approach is to keep watching for now and wait until volume picks up. In a choppy market, it’s all too easy to get stopped out by a wick.
What do you all think of this move? Let’s talk in the comments.
$BTC $SOL
#NEAR #比特币 #Cryptocurrency
The above is a record of my personal trading system and observations of data, and does not constitute investment advice.
1
161
·
--
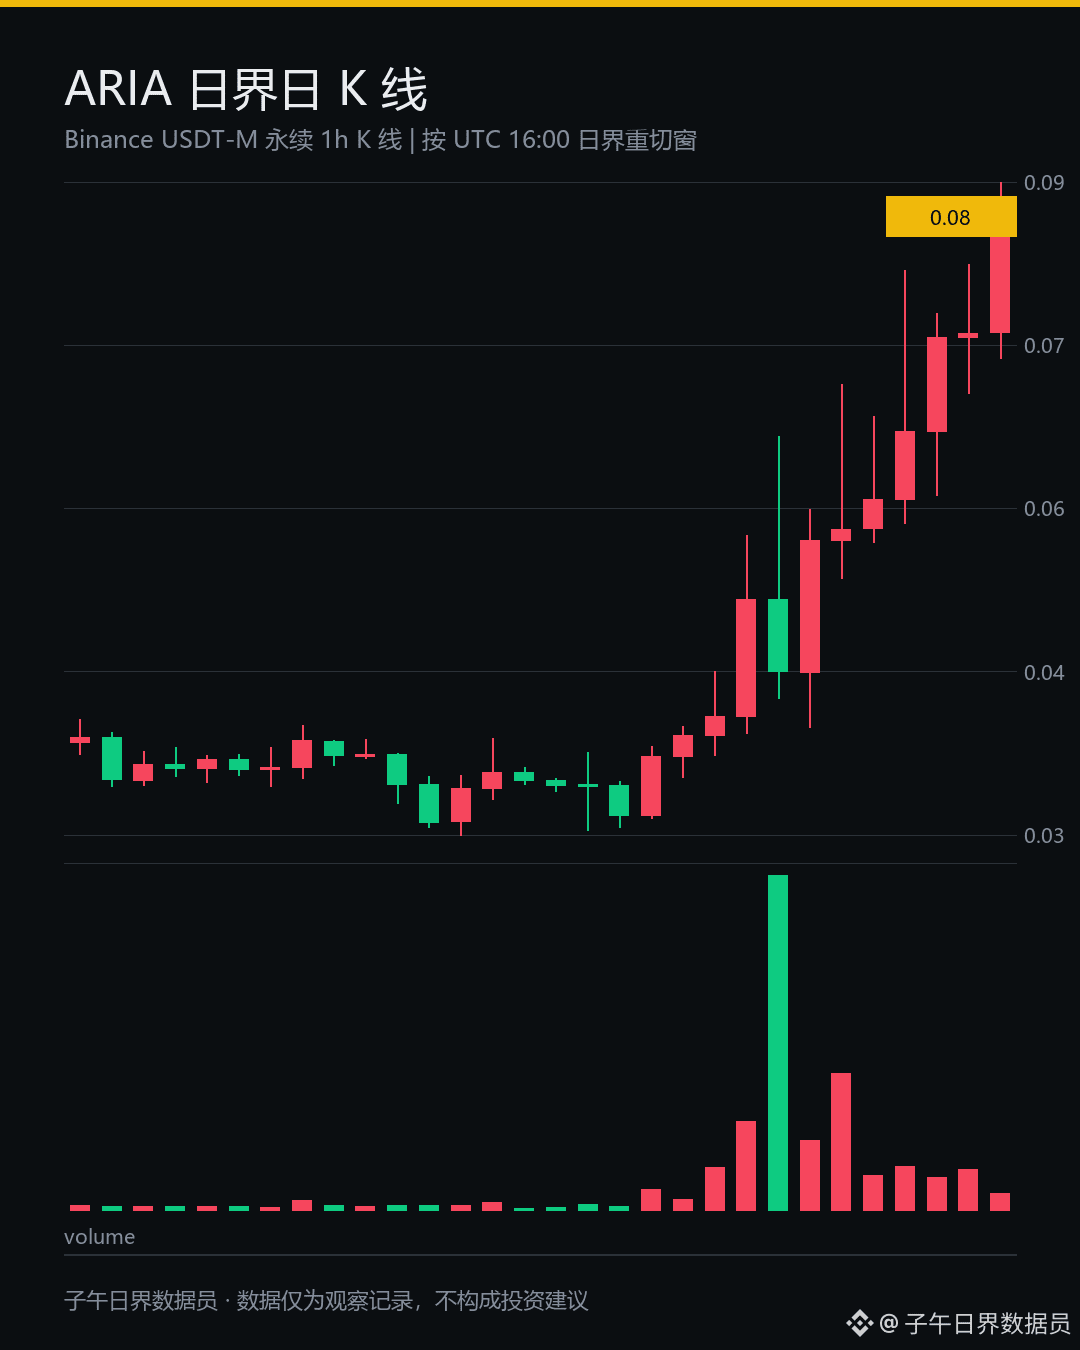
Everyone, I can't pretend not to notice this kind of volume move in ARIA.
Up 18.130% in 24h, closing at 0.0834. The intraday high and low were 0.08662 and 0.06883, a range of 25.846%.
When a coin this small makes a move like this, I want to study the charts before saying anything else.
Daily closes over the past five days: +4.516%, +10.068%, +12.517%, +0.479%, +13.462%. Four green candles have been nudging me forward.
Seven-day gain: +58.254%.
The 20-day range is 0.02986 to 0.08662, and the current price sits at the 94.3rd percentile—just a hair's breadth from the top.
This feels like a reservoir nearly spilling over the dam. Water is still pouring in, but can anyone point out where the overflow outlet is?
Average daily volatility is 15.38%, and today's volume is 388 million tokens. Liquidity isn't the issue; the question is whether buyers will absorb the supply at this price.
The ma7 is only at 0.066551, while the price is running along the upper edge. Honestly, I can't tell who's buying in this latter stretch.
At first glance, I thought the data was wrong. I checked twice before I believed it.
By my own standards, I'll leave chasing the highs to others and keep this one on my watchlist.
Will this daily candle get follow-through? Let's discuss in the comments—what do you all think?
$ARIA $BTC $ETH
#ARIA #比特币 #加密货币
The above reflects my personal trading-system notes and observations of the data; it does not constitute investment advice.
1
655
·
--
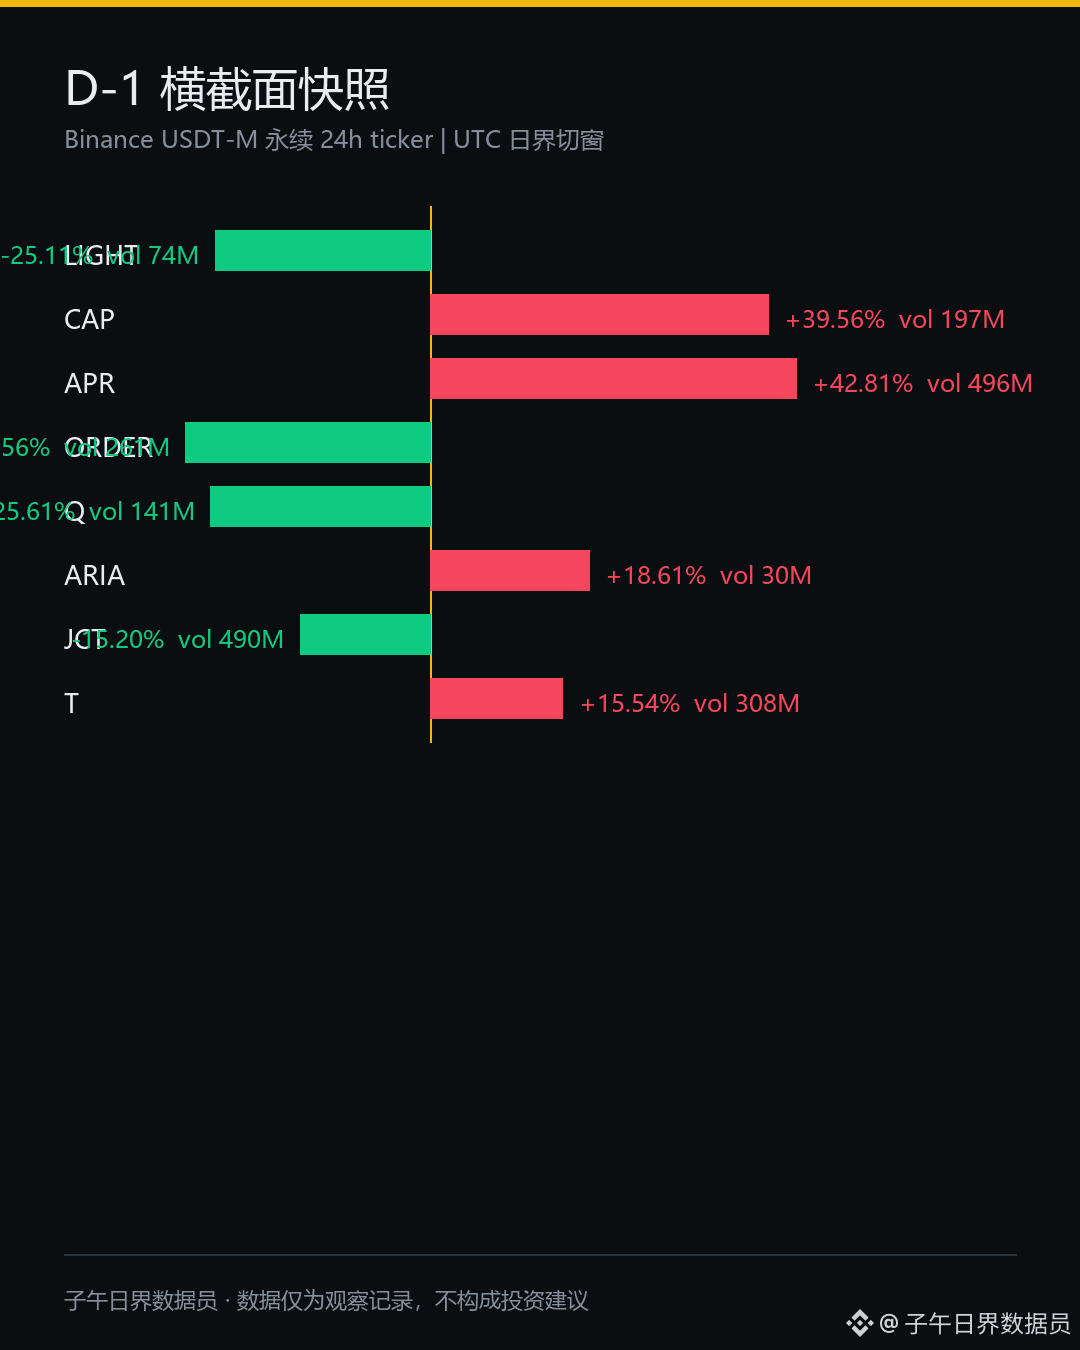
Everyone, I’ve been watching Ethena all night. Here’s my own take—not a retelling.
$ENA is currently at 0.2079, up 6.463% over 24 hours, with an intraday range of 12.175% and 1.211 billion tokens traded.
Over the past 20 days, the range has been 0.1743 to 0.2474. The current price is sitting at the 46.0th percentile, right around the middle of that range.
An awkward spot.
The old logic behind the synthetic-dollar sector boils down to this: use $ETH as collateral, pair it with a hedge leg in perpetual futures, and capture the basis.
This cash flow doesn’t depend on prices rising; it depends on funding rates themselves. When a month of negative rates comes around, returns take an immediate hit.
Funding rates are like tolls on a highway: when traffic is heavy, you collect with ease; when it thins out, the numbers start looking ugly.
There are two layers between protocol revenue and its realization in ENA’s price: governance and unlocks. That’s where the disagreement lies, too.
We need to distinguish between two pools: the USDe pool and the ENA pool. They’re not the same thing.
Daily closes over the past five days: -10.261%, +4.184%, -9.757%, +8.751%, +2.378%. The price has been whipping around like a spin dryer.
And it’s shaking people out.
Average daily volatility is 9.89%. The 7-day moving average is at 0.202057, and the current price is hovering just a little above it.
Honestly, I can’t tell whether fresh money has returned or this is just a technical rebound. All I can do is keep watching.
If I had to make a call, the sector’s real growth isn’t in the token price—it’s in whether open interest and the spread in funding rates are finding support.
I’m watching $BTC ’s funding-rate signals. When they turn negative, it gets harder for this cash flow to hold its ground.
How long do you think the current buzz around synthetic dollars can last? Let’s talk in the comments.
#LIGHT #CAP #Crypto
These are personal trading-system notes and observations of market data, and do not constitute investment advice.
1
349
·
--
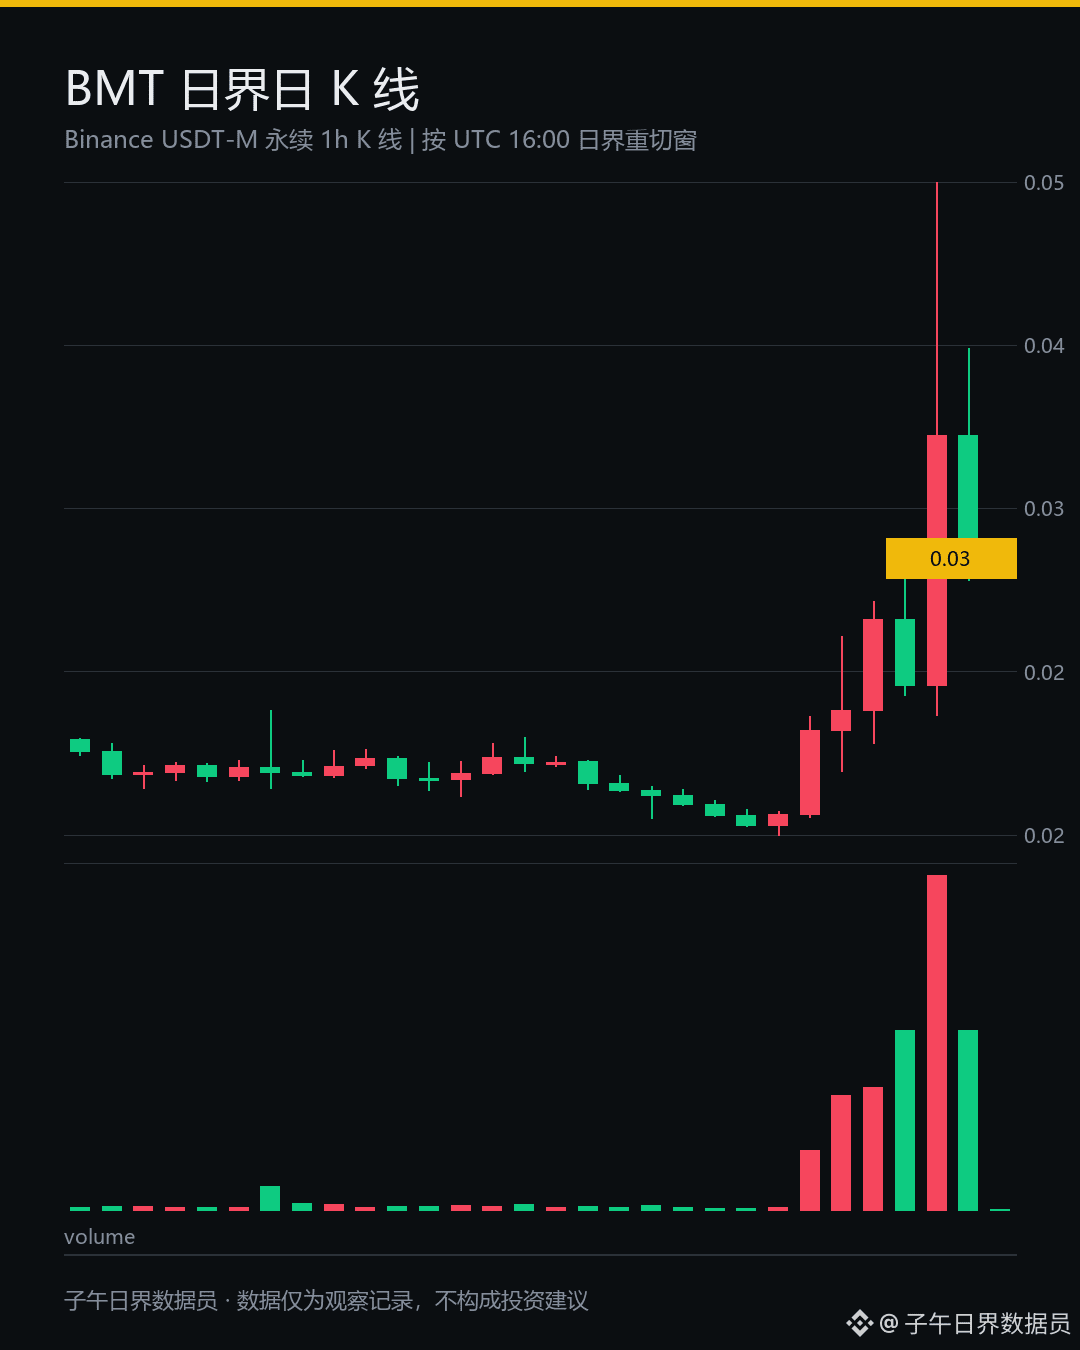
$BMT closed today at 0.03017, down 18.742% over 24 hours.
A pretty ugly drop.
Looking back at the last five daily candles: 0.02205, 0.02677, 0.02337, 0.03627, 0.02996.
The biggest move was that candle at 0.03627, which surged 55.191% in a single day, then gave it all back along the way.
At first glance, I thought the data had been entered wrong. I checked it twice before believing it.
Over the past 20 days, the daily range has been 0.01561 to 0.0494, with the current price sitting at the 43.1st percentile.
Neither up nor down—this is the hardest kind of position to sit through.
Average daily volatility (daily ATR14) is 17.683%, so a normal day can easily see a move of nearly 20%.
At the same time, $BTC has an ATR14 of just 2.597%, and $ETH is at 4.007%. Put side by side,
BMT looks like a machine with no speed governor: how hard you press the accelerator is all down to feel, and sentiment is in the driver's seat when it comes to price and volume.
The money hasn't all left yet: 24-hour trading volume is still 123.99 million USDT. The tokens are changing hands like a group of people fighting over one plate—whoever's quickest gets served first.
I'm not here to guess where it'll go tomorrow. The fundamentals behind a token like this are pretty thin; it's the narrative driving the price, not performance. If it really gets dumped, it'll just plummet, and no one's going to step in to support it.
The seven-day return is still in the green, at +80.984%. Nobody says a word when it's going up, but once it falls, everyone asks what to do?
My take is to pay less attention to it for now and wait for volatility to settle down before reconsidering.
If you're holding this token, share your cost basis in the comments.
#BMT #比特币 #Crypto
The above reflects my personal trading system records and observations of market data. It does not constitute investment advice.
1
134
·
--
$SUI $BTC $ETH
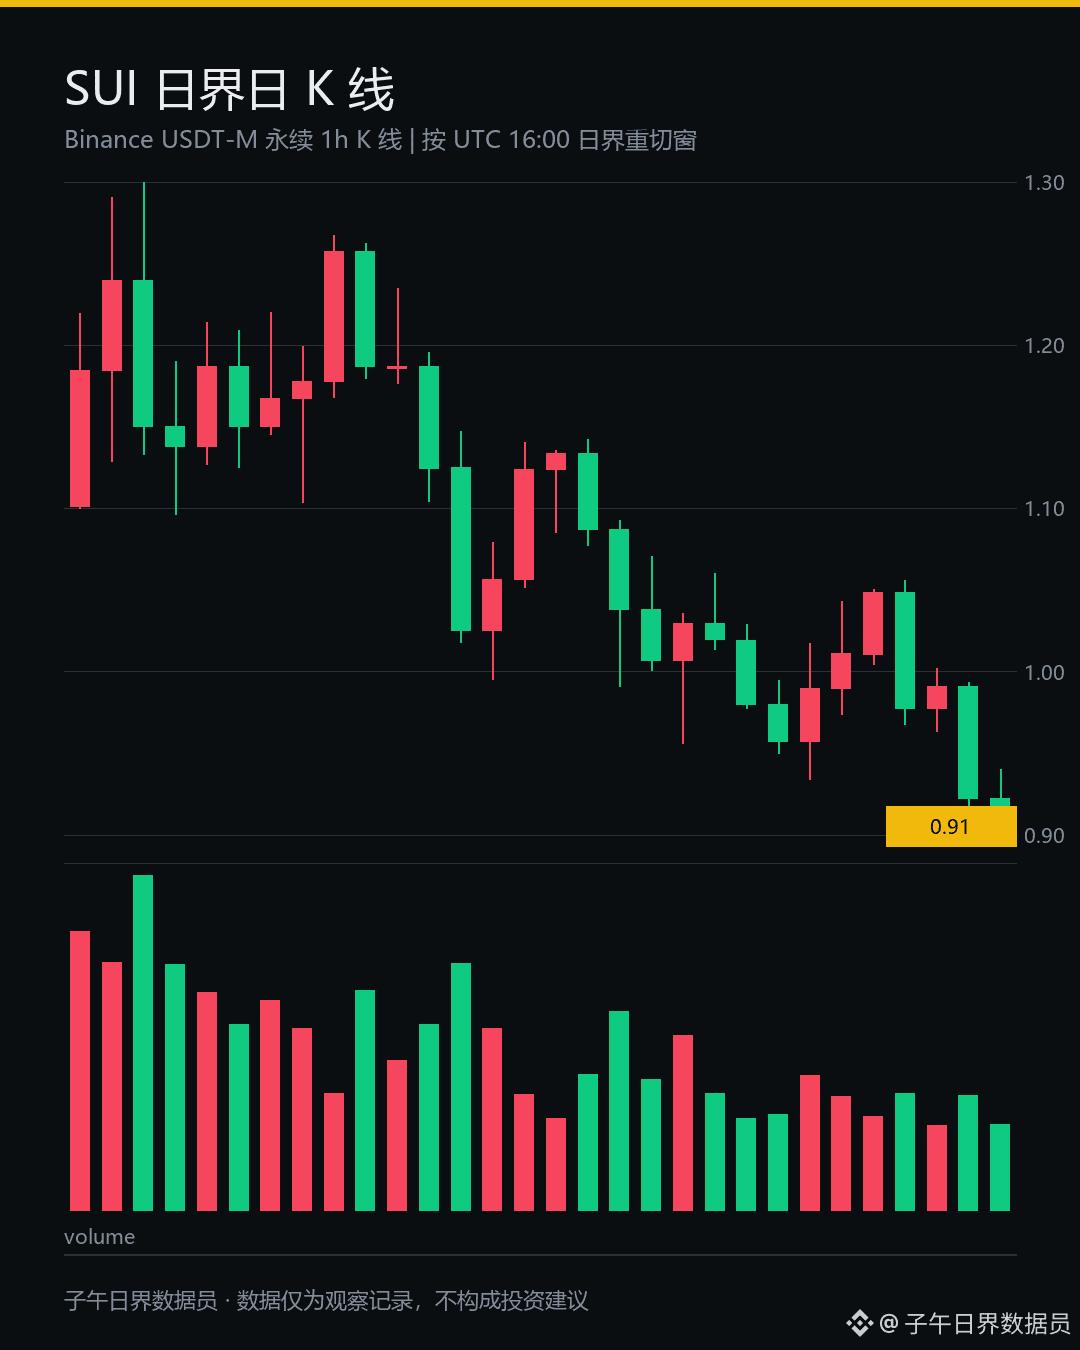
Everyone, the market is looking a little interesting today. SUI has moved just -2.427% over the past 24 hours—it almost looks like it’s pretending to be asleep.
That’s what makes this interesting.
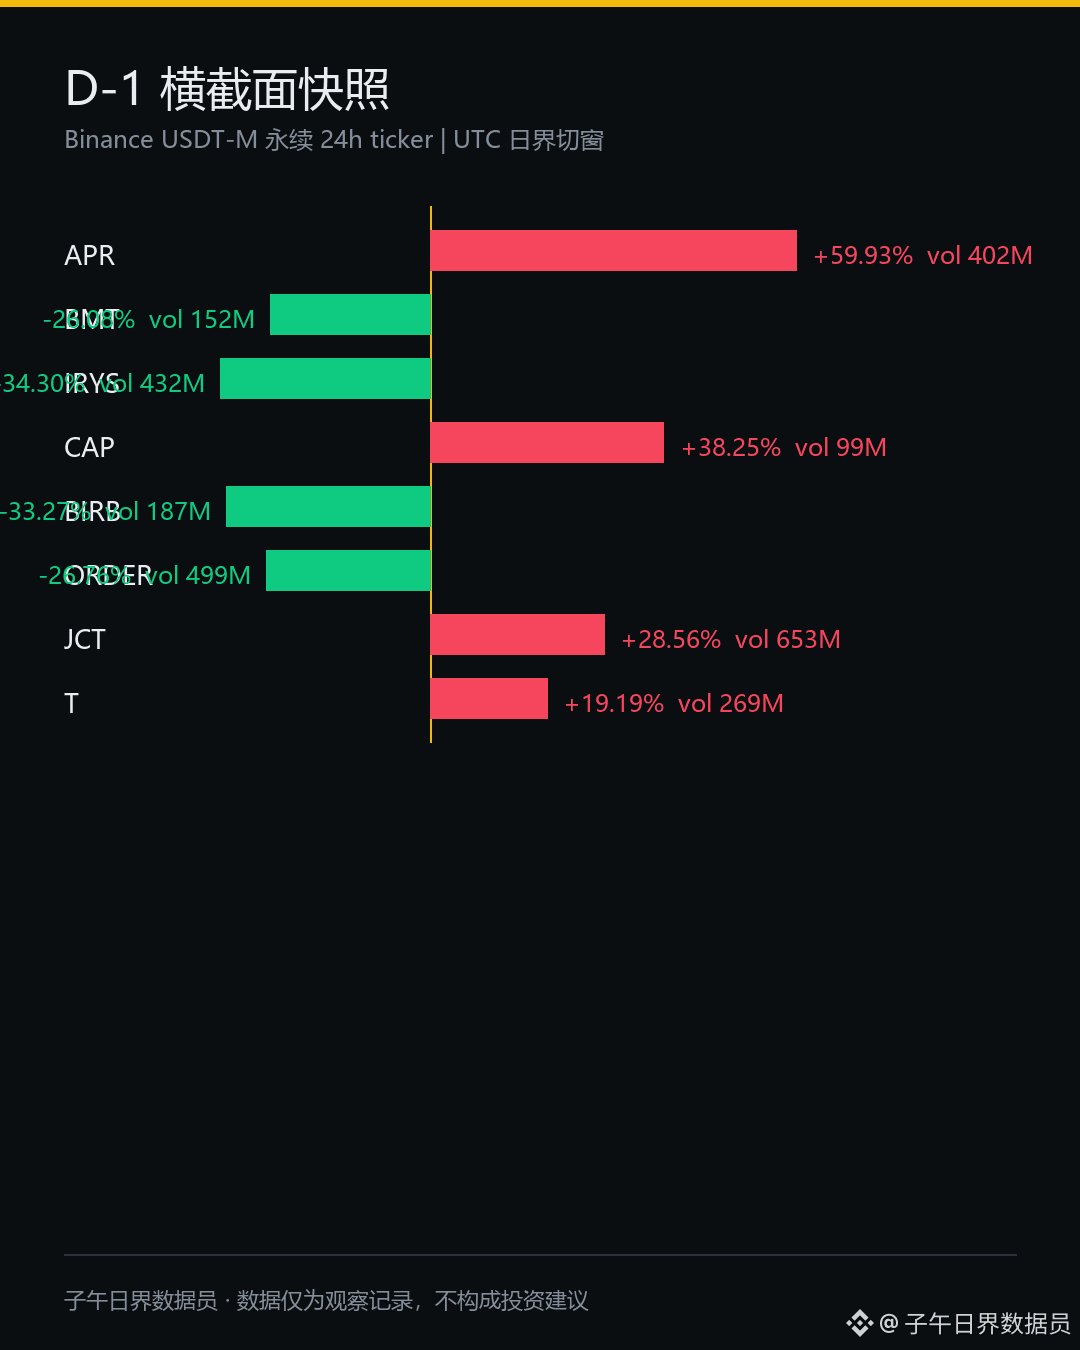
I took a look at other assets in the same batch and found that BMT plunged 24.279%, while TREE also dropped 20.760%.
With small-cap coins getting sold off across the board, SUI is still sitting right here without moving. That suggests its holders aren’t rushing for the exits, and liquidity is still bottled up inside.
At first glance, I thought I was seeing things. I checked twice before I believed it.
The money hasn’t left, but that doesn’t mean the price is about to rise. It just means selling pressure has eased a little—like water in a pot that hasn’t boiled yet, while the fire is raging somewhere else.
The focus right now isn’t direction, but positioning. For a coin holding steady on low volume like this, I’ll keep an eye on it if I’m already holding. If you haven’t bought in, don’t rush to chase it. Let’s see if fresh capital actually comes in first. There’s only so much liquidity in this pot, and you’ll be able to tell at a glance when the holders start to loosen their grip.
What do you all think?
What’s your take on this low-volume move? Let’s discuss in the comments.
#SUI #比特币 #Cryptocurrency
The above is a record of my personal trading system and observations of market data. It does not constitute investment advice.
1
297
·
--
$SUI $BTC $ETH
Everyone, I’ve been looking at a few sources lately, and I want to piece together what’s going on with Sui.
Sui has been coming up repeatedly lately, but its price has moved just -2.427% over the past 24 hours.
Attention is clearly picking up, yet the price seems asleep. I’ve seen this kind of divergence—attention moving first and price following later—many times. When attention gets ahead of price, that’s often the moment worth watching most closely.
Now that’s interesting.
At first glance, I thought I’d read it wrong. I checked twice before I believed it.
Right now, it’s not about direction; it’s about positioning. The money hasn’t really come in yet, but tokens are already being accumulated. It’s like everyone’s watching the sluice gate at a reservoir, but no water has been released. Liquidity is building up—that’s exactly the window to keep an eye on.
For now, I’m keeping it on my radar and won’t rush to a conclusion. I’ll wait until fresh capital actually comes in and the price catches up. There’s only so much liquid capital in this market, and whoever gets the tokens first will have the advantage.
What do you all think?
What’s your take on tokens where attention picks up first but the price hasn’t followed? Let’s chat in the comments.
#APR #BMT #cryptocurrency
The above reflects my personal trading-system records and observations of data, and does not constitute investment advice.
1
213
·
--
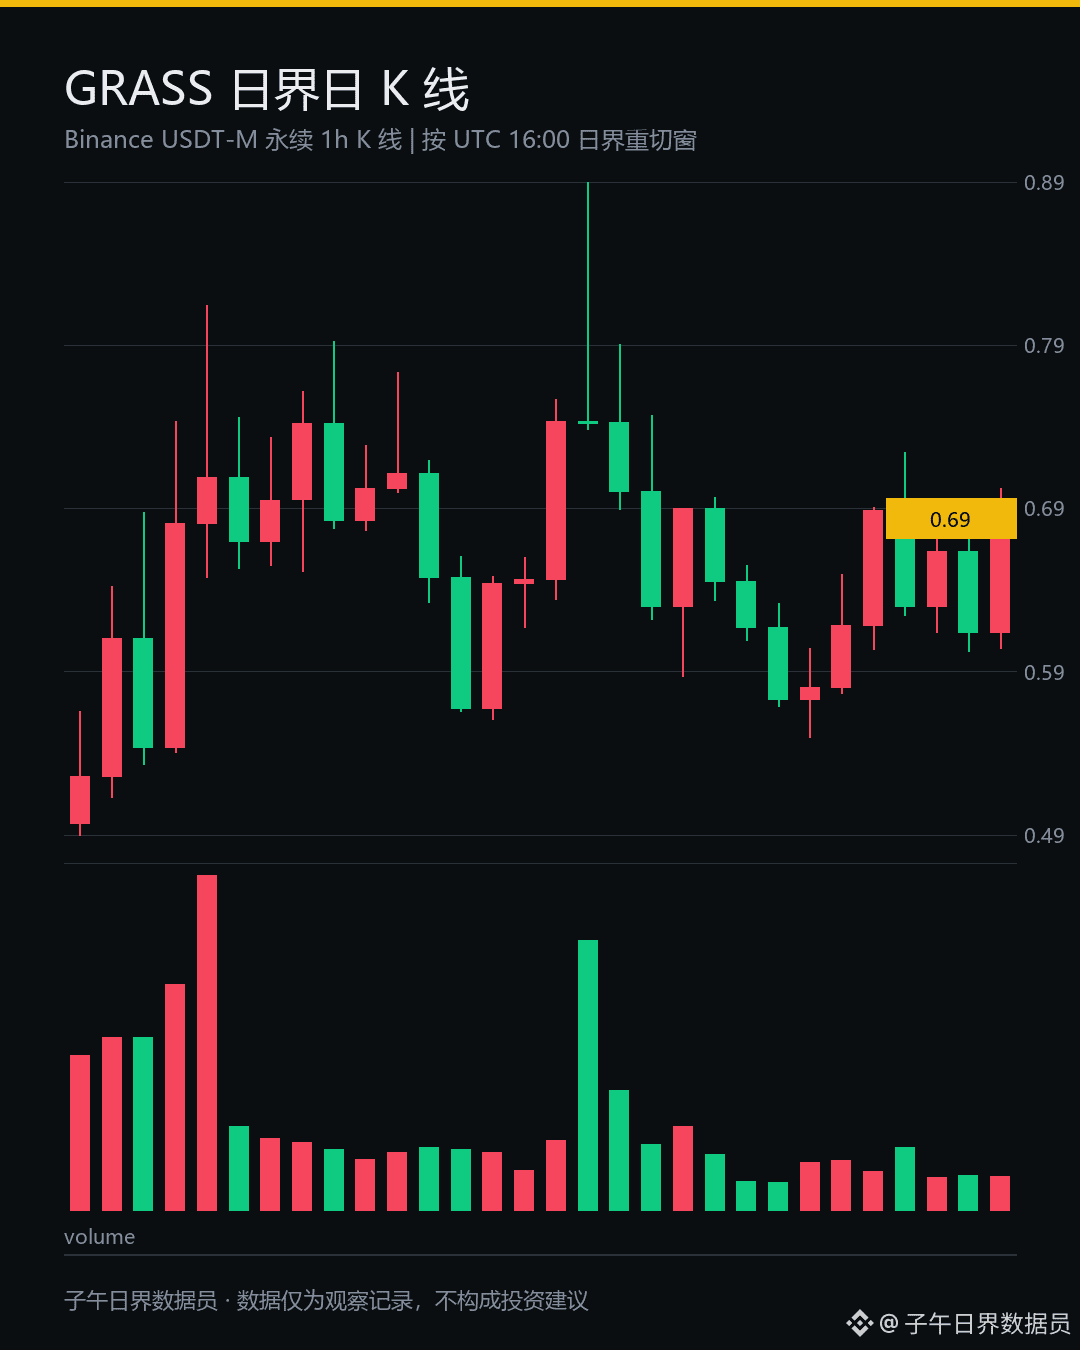
$GRASS is now at 0.6874, up 5.966% in 24 hours, after moving between 0.6586 and 0.7066 intraday.
A 7.29% range—not exactly thrilling.
At first glance, I thought it was just a wick. I checked twice before believing this was real turnover.
30 days: +41.49%; 14 days: -3.01%; 7 days: +13.34%. You only see the story when you put all three figures side by side.
The gains from that earlier run-up have been eaten up by sideways trading. Now it’s the second wave taking over.
The real problem is supply.
Market cap: $480.168492 million; fully diluted valuation: $686.452838 million. That leaves 30.051% still to come.
It’s like a reservoir: the water level looks stable, but once the gates open, everyone downstream has to get back in line.
The project combines AI, DePIN, and Solana. Put all three labels on one coin and it’ll never lack hype.
What it lacks is buying support.
It’s still 82.36% below its all-time high of 3.89. All the holders above are waiting to cash out—that’s not something sentiment alone can overcome.
By my assessment, this is in the watch zone for rotation, not the primary entry zone.
The pot is only so big. Whoever’s closest gets served first, and the people standing by the pot haven’t changed.
So I’m keeping an eye on it, but I’m not chasing it.
Which do you put more weight on: the 30-day slope or the volume over the past 7 days? Let’s discuss in the comments.
$SOL $BTC
#GRASS #比特币 #Cryptocurrency
The above is a record of my personal trading system and observations of the data. It does not constitute investment advice.
2
73
Log in to explore more content
Join global crypto users on Binance Square
⚡️ Get latest and useful information about crypto.
💬 Trusted by the world’s largest crypto exchange.
👍 Discover real insights from verified creators.
Email / Phone number
Trending Topics
BinancePick
2.7M views
143,694 Discussing
Join #EarningsSeason: Predict Earnings on Binance Pick, Share Your Take on Binance Square!
Binance Square Official
·402 Likes
·339.2k views
EarningsSeason
5M views
24,659 Discussing
SouthKoreaReportedlyWeighsFourthCryptoTaxDelay
2,343 views
107 Discussing