
Duy Thái
45 Posts

Duy Thái
Report
Block User
High-Frequency Trader
5.5 Years
98 Following
1.8K+ Followers
4.1K+ Liked
Posts
·
--
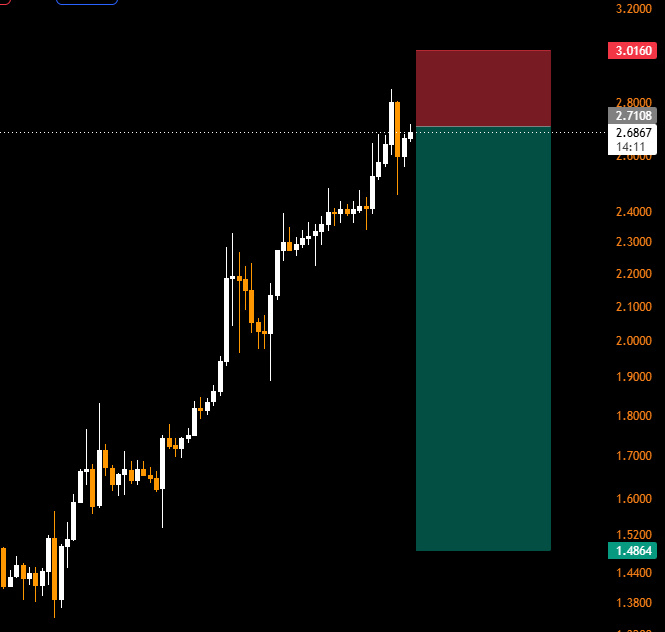
IT'S TIME FOR YOU GUYS TO START PUTTING IT ON THE WATCHLIST.
$EVAA
IT'S TIME FOR YOU GUYS TO START PUTTING IT ON THE WATCHLIST.
$EVAA
$EVAA
3
659
·
--
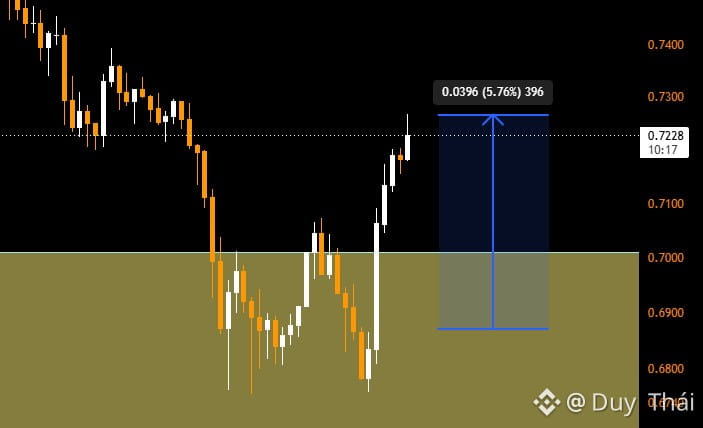
$SUI Just a brief bounce, but those who caught the right price zone had the chance to make nearly 6% in less than 30 minutes.
The market always offers opportunities like this, especially after strong liquidity sweeps.
$SUI Just a brief bounce, but those who caught the right price zone had the chance to make nearly 6% in less than 30 minutes.
The market always offers opportunities like this, especially after strong liquidity sweeps.
The market always offers opportunities like this, especially after strong liquidity sweeps.
2
763
·
--
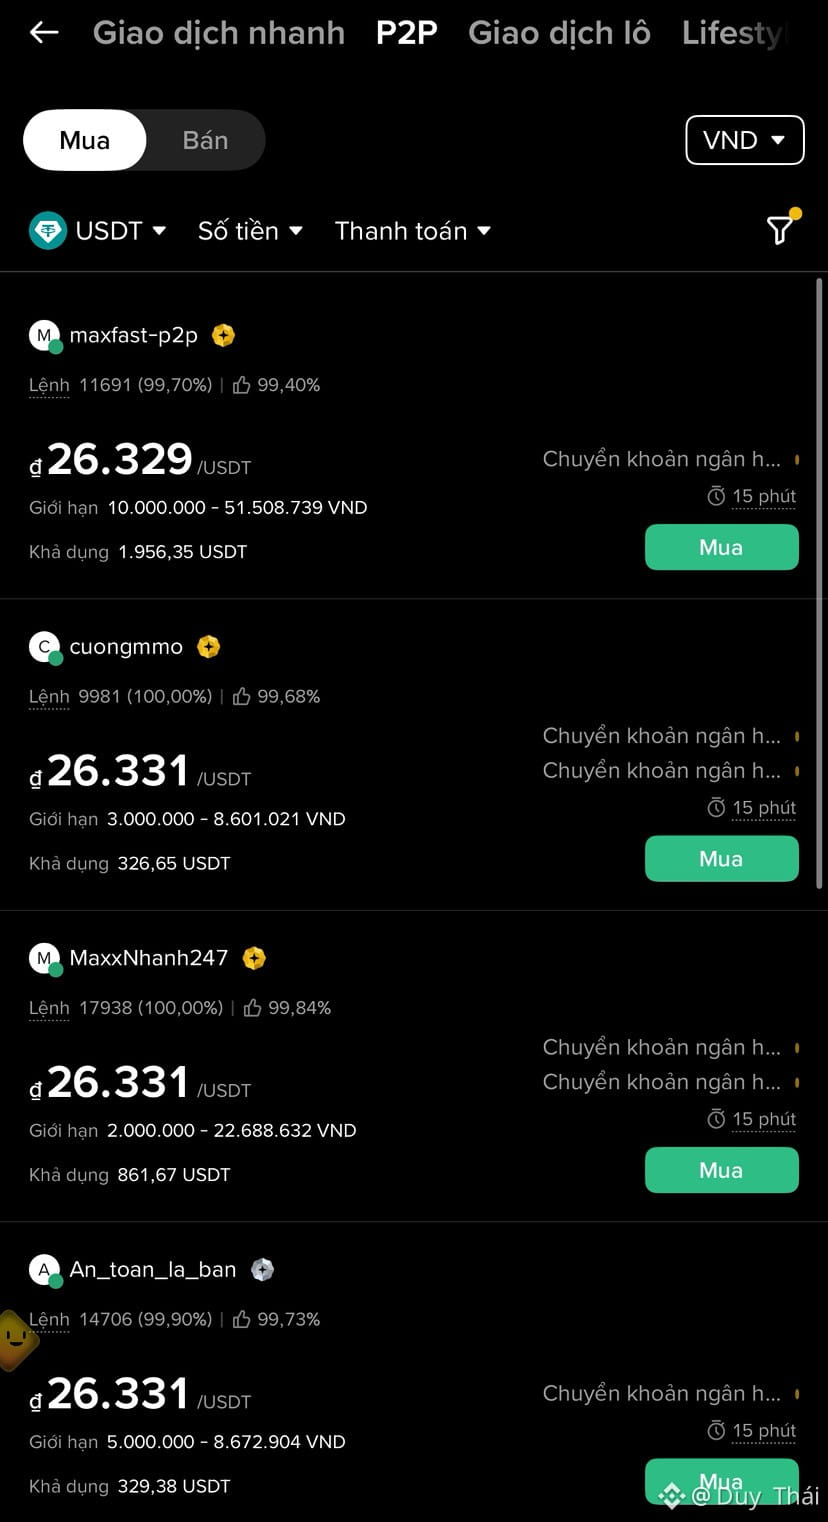
P2P can sometimes also be a useful indicator to watch for market sentiment and cash flow demand in the crypto market.
P2P can sometimes also be a useful indicator to watch for market sentiment and cash flow demand in the crypto market.
4
1
1.1k
·
--
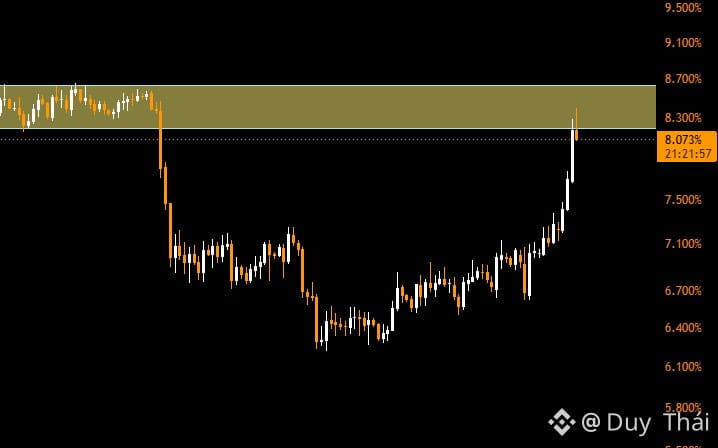
#USDT DOMINANCE – APPROACHING AN IMPORTANT RESISTANCE ZONE.
USDT.D is forming an ascending triangle pattern and has now returned to retest the 8.3–8.7% resistance zone.
In my view, this is a zone that deserves special attention. If USDT.D breaks above the resistance zone, capital may continue to favor the safety of USDT, putting pressure on the crypto market.
Conversely, if we see signs of price rejection and a reversal to the downside, this could be a positive signal for BTC and altcoins.
#USDT DOMINANCE – APPROACHING AN IMPORTANT RESISTANCE ZONE.
USDT.D is forming an ascending triangle pattern and has now returned to retest the 8.3–8.7% resistance zone.
In my view, this is a zone that deserves special attention. If USDT.D breaks above the resistance zone, capital may continue to favor the safety of USDT, putting pressure on the crypto market.
Conversely, if we see signs of price rejection and a reversal to the downside, this could be a positive signal for BTC and altcoins.
USDT.D is forming an ascending triangle pattern and has now returned to retest the 8.3–8.7% resistance zone.
In my view, this is a zone that deserves special attention. If USDT.D breaks above the resistance zone, capital may continue to favor the safety of USDT, putting pressure on the crypto market.
Conversely, if we see signs of price rejection and a reversal to the downside, this could be a positive signal for BTC and altcoins.
1
113
·
--
Overall, I think this is a period when traders can start watching the market and looking for short-term trading opportunities after liquidity sweeps.
Quite a few coins are approaching notable price levels. If you have funds available, gradually accumulating spot positions at attractive prices is also worth considering.
There are always opportunities in the market; what matters is whether we’re perceptive enough to spot them.
Sometimes opportunities aren’t found by chasing big waves, but in the fluctuations happening all around us.
Be patient, watch the market, choose the right entry points, and manage your capital. Don’t let opportunities pass you by just because you weren’t prepared.
Overall, I think this is a period when traders can start watching the market and looking for short-term trading opportunities after liquidity sweeps.
Quite a few coins are approaching notable price levels. If you have funds available, gradually accumulating spot positions at attractive prices is also worth considering.
There are always opportunities in the market; what matters is whether we’re perceptive enough to spot them.
Sometimes opportunities aren’t found by chasing big waves, but in the fluctuations happening all around us.
Be patient, watch the market, choose the right entry points, and manage your capital. Don’t let opportunities pass you by just because you weren’t prepared.
Quite a few coins are approaching notable price levels. If you have funds available, gradually accumulating spot positions at attractive prices is also worth considering.
There are always opportunities in the market; what matters is whether we’re perceptive enough to spot them.
Sometimes opportunities aren’t found by chasing big waves, but in the fluctuations happening all around us.
Be patient, watch the market, choose the right entry points, and manage your capital. Don’t let opportunities pass you by just because you weren’t prepared.
1
314
·
--
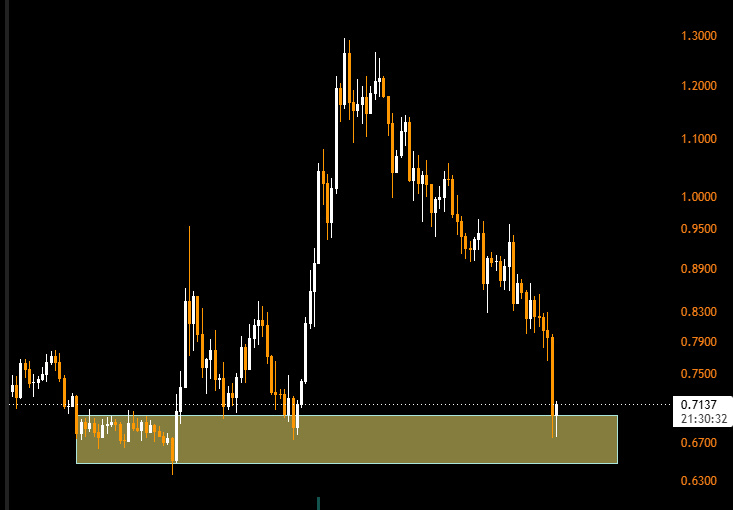
$SUI – A STRUCTURE I AM OBSERVING.
#SUİ has gone through a fairly lengthy correction, and the price structure still leans bearish.
However, the current price area is beginning to show notable reactions after returning to the previous consolidation zone.
In my personal view, I’m not rushing to expect a reversal, but this is an area worth watching. What I’m focused on now is how price reacts and whether buying pressure is strong enough to change the structure.
$SUI – A STRUCTURE I AM OBSERVING.
#SUİ has gone through a fairly lengthy correction, and the price structure still leans bearish.
However, the current price area is beginning to show notable reactions after returning to the previous consolidation zone.
In my personal view, I’m not rushing to expect a reversal, but this is an area worth watching. What I’m focused on now is how price reacts and whether buying pressure is strong enough to change the structure.
#SUİ has gone through a fairly lengthy correction, and the price structure still leans bearish.
However, the current price area is beginning to show notable reactions after returning to the previous consolidation zone.
In my personal view, I’m not rushing to expect a reversal, but this is an area worth watching. What I’m focused on now is how price reacts and whether buying pressure is strong enough to change the structure.
1
1.5k
·
--
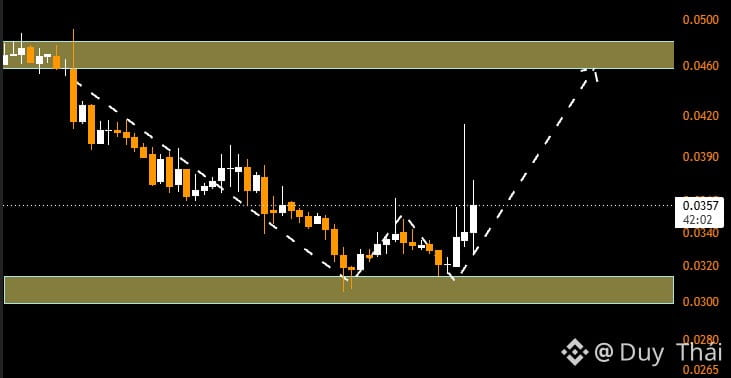
#OSMO/USDT ANALYSIS
OSMO is showing signs of recovery after successfully testing the $0.030–$0.032 support zone. Buying pressure is beginning to emerge, helping the price rebound and form a short-term recovery.
If OSMO holds the current support zone and breaks through the $0.036–$0.038 resistance, the price could continue toward the $0.046–$0.048 zone.
Conversely, if it loses the $0.030 level, the recovery scenario will weaken, and selling pressure could return.
#OSMO/USDT ANALYSIS
OSMO is showing signs of recovery after successfully testing the $0.030–$0.032 support zone. Buying pressure is beginning to emerge, helping the price rebound and form a short-term recovery.
If OSMO holds the current support zone and breaks through the $0.036–$0.038 resistance, the price could continue toward the $0.046–$0.048 zone.
Conversely, if it loses the $0.030 level, the recovery scenario will weaken, and selling pressure could return.
OSMO is showing signs of recovery after successfully testing the $0.030–$0.032 support zone. Buying pressure is beginning to emerge, helping the price rebound and form a short-term recovery.
If OSMO holds the current support zone and breaks through the $0.036–$0.038 resistance, the price could continue toward the $0.046–$0.048 zone.
Conversely, if it loses the $0.030 level, the recovery scenario will weaken, and selling pressure could return.
1
466
·
--
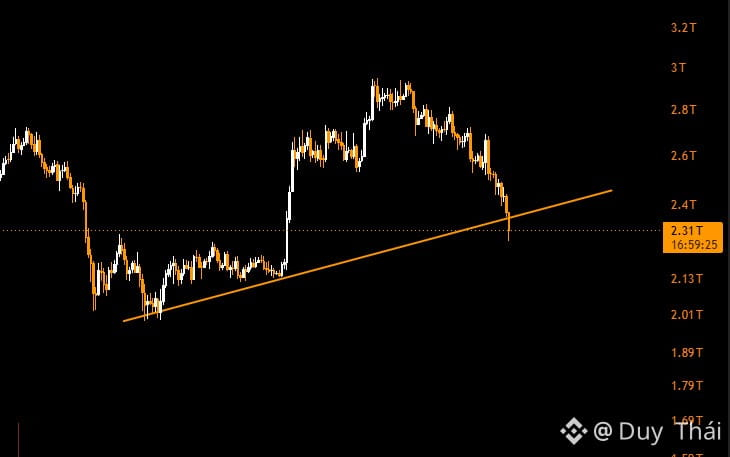
#Total TOTAL MARKET CAP ANALYSIS
The total crypto market capitalization is currently under strong selling pressure after losing its upward support trendline around $2.35T.
This is a negative signal, indicating that capital flows are showing signs of weakening and the risk of a market-wide correction is increasing.
If TOTAL cannot quickly reclaim the $2.35T level, market capitalization could continue declining toward the $2.13T–$2.01T area.
Conversely, reclaiming the lost support level would be a signal to watch when assessing the potential for a recovery.
#Total TOTAL MARKET CAP ANALYSIS
The total crypto market capitalization is currently under strong selling pressure after losing its upward support trendline around $2.35T.
This is a negative signal, indicating that capital flows are showing signs of weakening and the risk of a market-wide correction is increasing.
If TOTAL cannot quickly reclaim the $2.35T level, market capitalization could continue declining toward the $2.13T–$2.01T area.
Conversely, reclaiming the lost support level would be a signal to watch when assessing the potential for a recovery.
The total crypto market capitalization is currently under strong selling pressure after losing its upward support trendline around $2.35T.
This is a negative signal, indicating that capital flows are showing signs of weakening and the risk of a market-wide correction is increasing.
If TOTAL cannot quickly reclaim the $2.35T level, market capitalization could continue declining toward the $2.13T–$2.01T area.
Conversely, reclaiming the lost support level would be a signal to watch when assessing the potential for a recovery.
1
1.2k
·
--
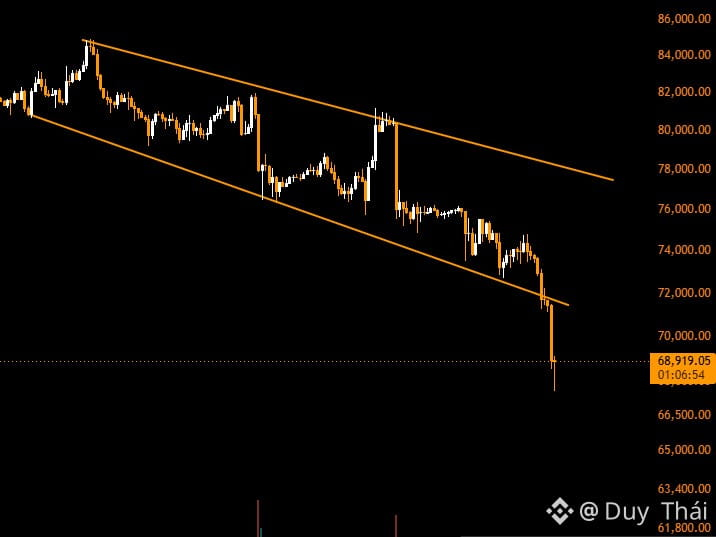
#BTC/USDT ANALYSIS
Bitcoin has now broken below the support line of the descending price channel, indicating increasing selling pressure and a market structure that continues to lean bearish.
At the same time, the $71,000–$72,000 support zone may now turn into resistance, potentially limiting price recoveries.
If BTC cannot reclaim this resistance zone, we could see another downward move toward the $66,500–$65,000 area.
Conversely, if the price quickly reclaims the $72,000 level, a false breakout scenario should be considered.
#BTC/USDT ANALYSIS
Bitcoin has now broken below the support line of the descending price channel, indicating increasing selling pressure and a market structure that continues to lean bearish.
At the same time, the $71,000–$72,000 support zone may now turn into resistance, potentially limiting price recoveries.
If BTC cannot reclaim this resistance zone, we could see another downward move toward the $66,500–$65,000 area.
Conversely, if the price quickly reclaims the $72,000 level, a false breakout scenario should be considered.
Bitcoin has now broken below the support line of the descending price channel, indicating increasing selling pressure and a market structure that continues to lean bearish.
At the same time, the $71,000–$72,000 support zone may now turn into resistance, potentially limiting price recoveries.
If BTC cannot reclaim this resistance zone, we could see another downward move toward the $66,500–$65,000 area.
Conversely, if the price quickly reclaims the $72,000 level, a false breakout scenario should be considered.
1
182
Log in to explore more content
Join global crypto users on Binance Square
⚡️ Get latest and useful information about crypto.
💬 Trusted by the world’s largest crypto exchange.
👍 Discover real insights from verified creators.
Email / Phone number
Trending Topics
NvidiaEarningsTonight:AIStocks’NextMove?
28,455 views
495 Discussing
Nvidia Earnings Day: Interim CEO's First Appearance — Can the AI Story Hold?
Binance News
·16 Likes
·7.6k views
A Packed Week of Earnings and Data Tests Markets
109,047 views
563 Discussing
AnthropicIPOTestsInvestorAppetiteForAI
228,794 views
2,285 Discussing