
TradeVanta
122 Posts

TradeVanta
Crypto strategist sharing daily market insights 📊 Trade with discipline.Follow for timely setups and smarter decisions.
1 Following
142 Followers
225 Liked
Posts
$ETH breakout already happened. Now comes the part that traps impatient traders.
ETHUSDT Perp ripped from the $2,390 area and exploded toward $2,566, completely shifting the short-term structure. But look closely—the price is no longer running vertically. It’s compressing around $2,500 while the RSI cools off.
That’s the interesting part.
Strong momentum + consolidation near the highs can be constructive, but the market still needs to prove it can hold this new range. The $2,530–$2,566 zone is the obvious area bulls need to overcome, while the $2,460–$2,437 region becomes important if the breakout starts losing strength.
Don’t confuse a strong candle with confirmation. The next move is often decided during the boring part. 👀
#eth #TradingSignals #Ethereum
ETHUSDT Perp ripped from the $2,390 area and exploded toward $2,566, completely shifting the short-term structure. But look closely—the price is no longer running vertically. It’s compressing around $2,500 while the RSI cools off.
That’s the interesting part.
Strong momentum + consolidation near the highs can be constructive, but the market still needs to prove it can hold this new range. The $2,530–$2,566 zone is the obvious area bulls need to overcome, while the $2,460–$2,437 region becomes important if the breakout starts losing strength.
Don’t confuse a strong candle with confirmation. The next move is often decided during the boring part. 👀
#eth #TradingSignals #Ethereum
$BTC After spending hours grinding sideways between roughly $76K–$78K, BTCUSDT Perp suddenly exploded higher, pushing to $80,941 and sitting around $80,537, up nearly 5% in 24 hours. The breakout is backed by a clear volume surge, making the move stand out from the earlier range-bound action.
But here’s the interesting part: momentum is already extremely stretched. On the 15m chart, RSI(6) is around 93.9, while the 1h RSI(6) is near 93. That doesn’t automatically mean reversal—it simply shows how aggressively price has moved.
With $80.9K and the previous $81.5K area nearby, the market is entering an important zone. 🔥
When momentum goes vertical, patience becomes more valuable than FOMO.
#btc #TradingTales #ScalpingTrading
But here’s the interesting part: momentum is already extremely stretched. On the 15m chart, RSI(6) is around 93.9, while the 1h RSI(6) is near 93. That doesn’t automatically mean reversal—it simply shows how aggressively price has moved.
With $80.9K and the previous $81.5K area nearby, the market is entering an important zone. 🔥
When momentum goes vertical, patience becomes more valuable than FOMO.
#btc #TradingTales #ScalpingTrading
$SOL showing a classic “cool-off after the breakout” setup. After exploding from around $60 to a 4h high near $110.60, the market has shifted from aggressive trending to consolidation.
Right now, SOL is around $100.46, up 0.54% on the day, with a recent 24h range of $97.34–$101.33. The interesting part is the contrast across timeframes: the 1h and 15m charts show buyers attempting to recover from the $97.34 dip, while the 4h structure is still sitting well below the $110.60 peak.
Volume also surged during the earlier rally but has cooled considerably. That suggests the market is digesting the move rather than chasing it.
The key lesson? After a huge rally, patience becomes more valuable than excitement. 🧠
#sol #solana #TradingSignals
Right now, SOL is around $100.46, up 0.54% on the day, with a recent 24h range of $97.34–$101.33. The interesting part is the contrast across timeframes: the 1h and 15m charts show buyers attempting to recover from the $97.34 dip, while the 4h structure is still sitting well below the $110.60 peak.
Volume also surged during the earlier rally but has cooled considerably. That suggests the market is digesting the move rather than chasing it.
The key lesson? After a huge rally, patience becomes more valuable than excitement. 🧠
#sol #solana #TradingSignals
$BTC 🚨 Bitcoin looks less like a fresh breakdown and more like a market digesting a huge move.
On the daily chart, BTC rallied from around $57,758 to $81,500 before settling near $77,000. Now the interesting part is the contrast: the bigger trend still reflects a major recovery, while the 4h chart has cooled sharply, with RSI(6) around 32 and RSI(12) near 38.
Shorter timeframes are much more neutral, suggesting momentum has faded rather than completely collapsed. The key area to watch is the $76,150 low, while $78,000–$78,100 is the nearby resistance zone.
After a move this large, consolidation isn’t necessarily weakness. Sometimes the market simply needs time to decide its next direction. 🧊
Patience beats chasing volatility.
#btc #BTC走势分析 #Write2Earn
On the daily chart, BTC rallied from around $57,758 to $81,500 before settling near $77,000. Now the interesting part is the contrast: the bigger trend still reflects a major recovery, while the 4h chart has cooled sharply, with RSI(6) around 32 and RSI(12) near 38.
Shorter timeframes are much more neutral, suggesting momentum has faded rather than completely collapsed. The key area to watch is the $76,150 low, while $78,000–$78,100 is the nearby resistance zone.
After a move this large, consolidation isn’t necessarily weakness. Sometimes the market simply needs time to decide its next direction. 🧊
Patience beats chasing volatility.
#btc #BTC走势分析 #Write2Earn
$MAGMA Price Analysis: Bullish Structure, Liquidity Targets, and Key Levels
$MAGMA remains structurally bullish across the higher timeframes. The 4H and 1H charts show sustained higher highs and higher lows, with strong bullish displacement driving price toward the recent $0.42736 high and the broader $0.4411 resistance area. These levels represent important buy-side liquidity. However, a definitive new CHoCH or precise BOS cannot be confirmed from the available chart resolution.
From an ICT perspective, price is trading deep within the premium portion of the broader 4H dealing range, making immediate long entries unattractive. A liquidity sweep followed by displacement and a lower-timeframe market structure shift would provide stronger confirmation. The current move appears focused on delivering toward external liquidity rather than offering an optimal entry.
The most probable Elliott Wave interpretation is an advancing bullish impulse, potentially within a Wave 3-type expansion, although this remains an assumption rather than certainty.
Key levels include $0.42736 and $0.4411 resistance, with potential demand developing around $0.34–$0.36.
#Write2Earn
$MAGMA remains structurally bullish across the higher timeframes. The 4H and 1H charts show sustained higher highs and higher lows, with strong bullish displacement driving price toward the recent $0.42736 high and the broader $0.4411 resistance area. These levels represent important buy-side liquidity. However, a definitive new CHoCH or precise BOS cannot be confirmed from the available chart resolution.
From an ICT perspective, price is trading deep within the premium portion of the broader 4H dealing range, making immediate long entries unattractive. A liquidity sweep followed by displacement and a lower-timeframe market structure shift would provide stronger confirmation. The current move appears focused on delivering toward external liquidity rather than offering an optimal entry.
The most probable Elliott Wave interpretation is an advancing bullish impulse, potentially within a Wave 3-type expansion, although this remains an assumption rather than certainty.
Key levels include $0.42736 and $0.4411 resistance, with potential demand developing around $0.34–$0.36.
#Write2Earn
$BTC Could Hit $120K Within Two Weeks: What the Current Structure Suggests
$BTC is showing a strong bullish structure across the higher timeframes, raising the possibility of a major continuation toward the $120,000 psychological level within the next two weeks.
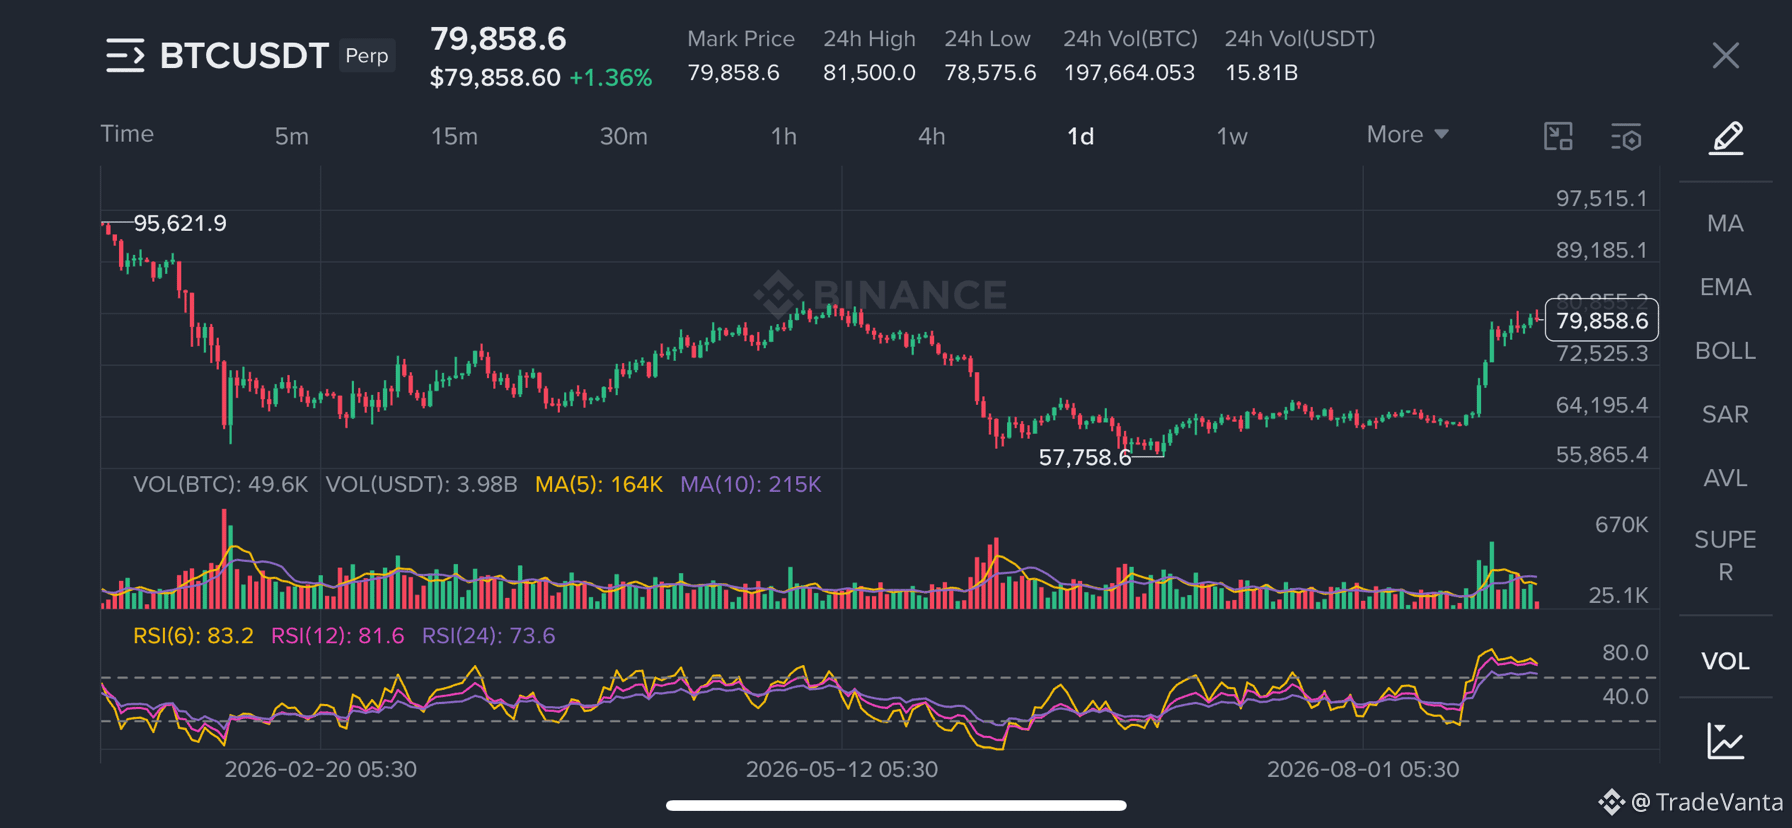
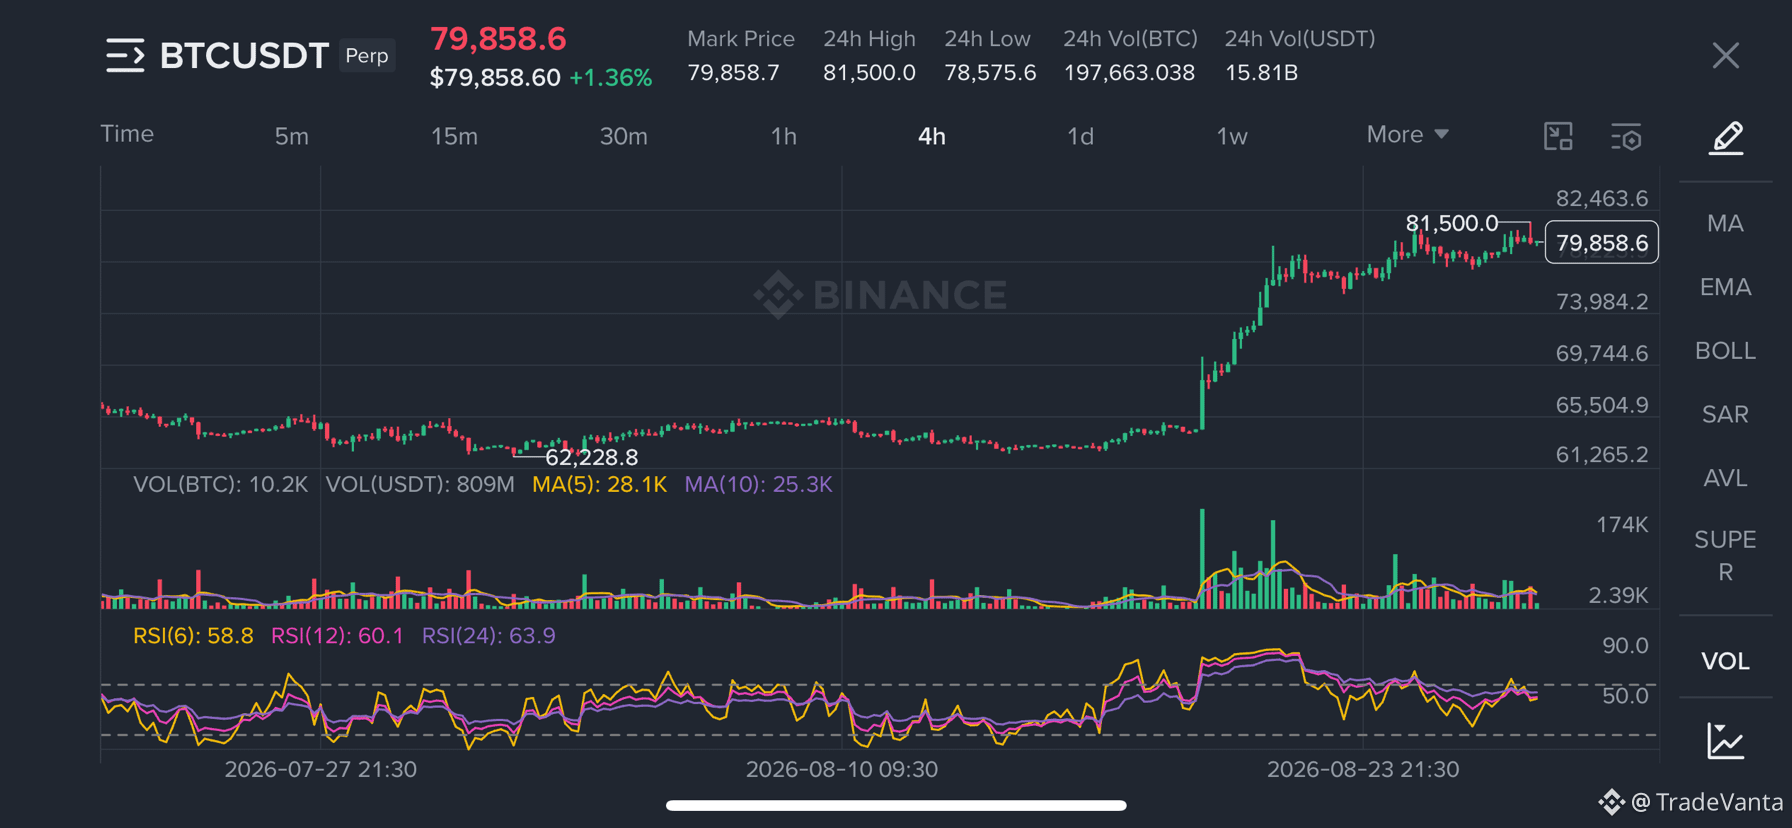
The daily chart shows BTC recovering strongly from the $57,758 swing low and establishing a powerful upward move. On the 4H timeframe, price broke out of the prolonged $61K–$65K consolidation range and expanded toward $81,500, demonstrating significant bullish displacement.
From an SMC perspective, $81,500 is currently the key buy-side liquidity zone. A decisive breakout and sustained acceptance above this level could open the path toward higher external liquidity. The immediate downside liquidity sits around $79,121, with another important level near $77,600.
ICT analysis suggests BTC is currently consolidating beneath major resistance. A liquidity sweep followed by bullish displacement and a confirmed market-structure shift could provide the catalyst for another expansion leg.
Elliott Wave analysis also permits a bullish impulsive interpretation, although the wave count remains probabilistic rather than certain.
Therefore, $120K within two weeks is an aggressive bullish scenario, not a confirmed forecast. BTC must first reclaim and hold $81,500, followed by sustained momentum and successful higher-timeframe continuation.
#btc #BTC走势分析 #BTC突破7万大关 #Write2Earn
$BTC is showing a strong bullish structure across the higher timeframes, raising the possibility of a major continuation toward the $120,000 psychological level within the next two weeks.
The daily chart shows BTC recovering strongly from the $57,758 swing low and establishing a powerful upward move. On the 4H timeframe, price broke out of the prolonged $61K–$65K consolidation range and expanded toward $81,500, demonstrating significant bullish displacement.
From an SMC perspective, $81,500 is currently the key buy-side liquidity zone. A decisive breakout and sustained acceptance above this level could open the path toward higher external liquidity. The immediate downside liquidity sits around $79,121, with another important level near $77,600.
ICT analysis suggests BTC is currently consolidating beneath major resistance. A liquidity sweep followed by bullish displacement and a confirmed market-structure shift could provide the catalyst for another expansion leg.
Elliott Wave analysis also permits a bullish impulsive interpretation, although the wave count remains probabilistic rather than certain.
Therefore, $120K within two weeks is an aggressive bullish scenario, not a confirmed forecast. BTC must first reclaim and hold $81,500, followed by sustained momentum and successful higher-timeframe continuation.
#btc #BTC走势分析 #BTC突破7万大关 #Write2Earn
$SOL Analysis: Bullish Structure Meets Key Resistance
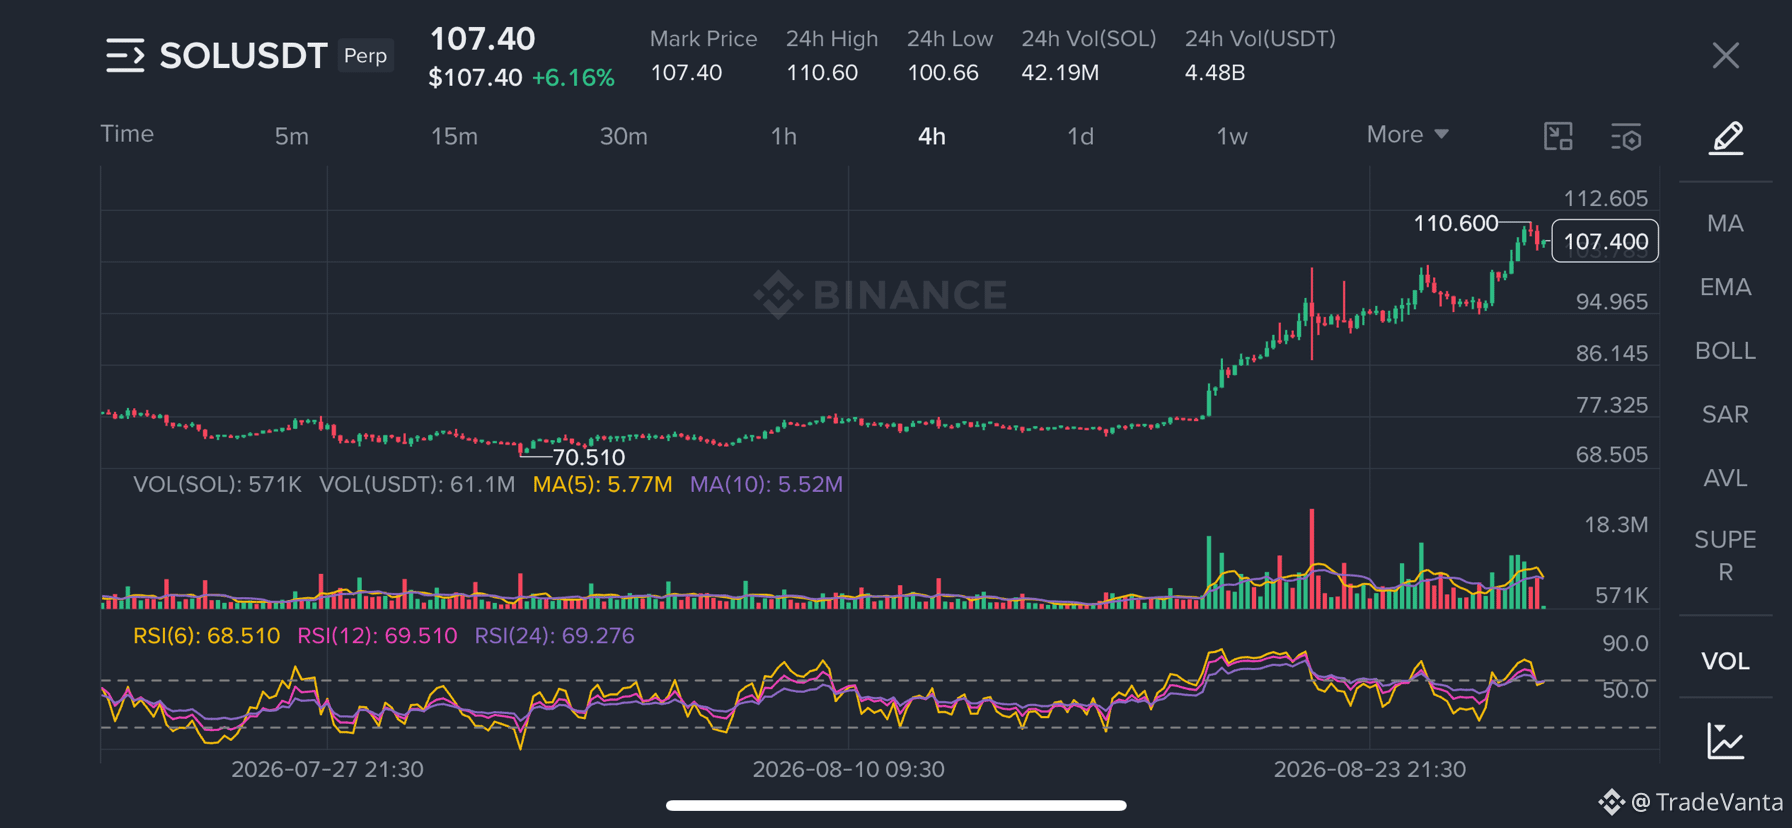
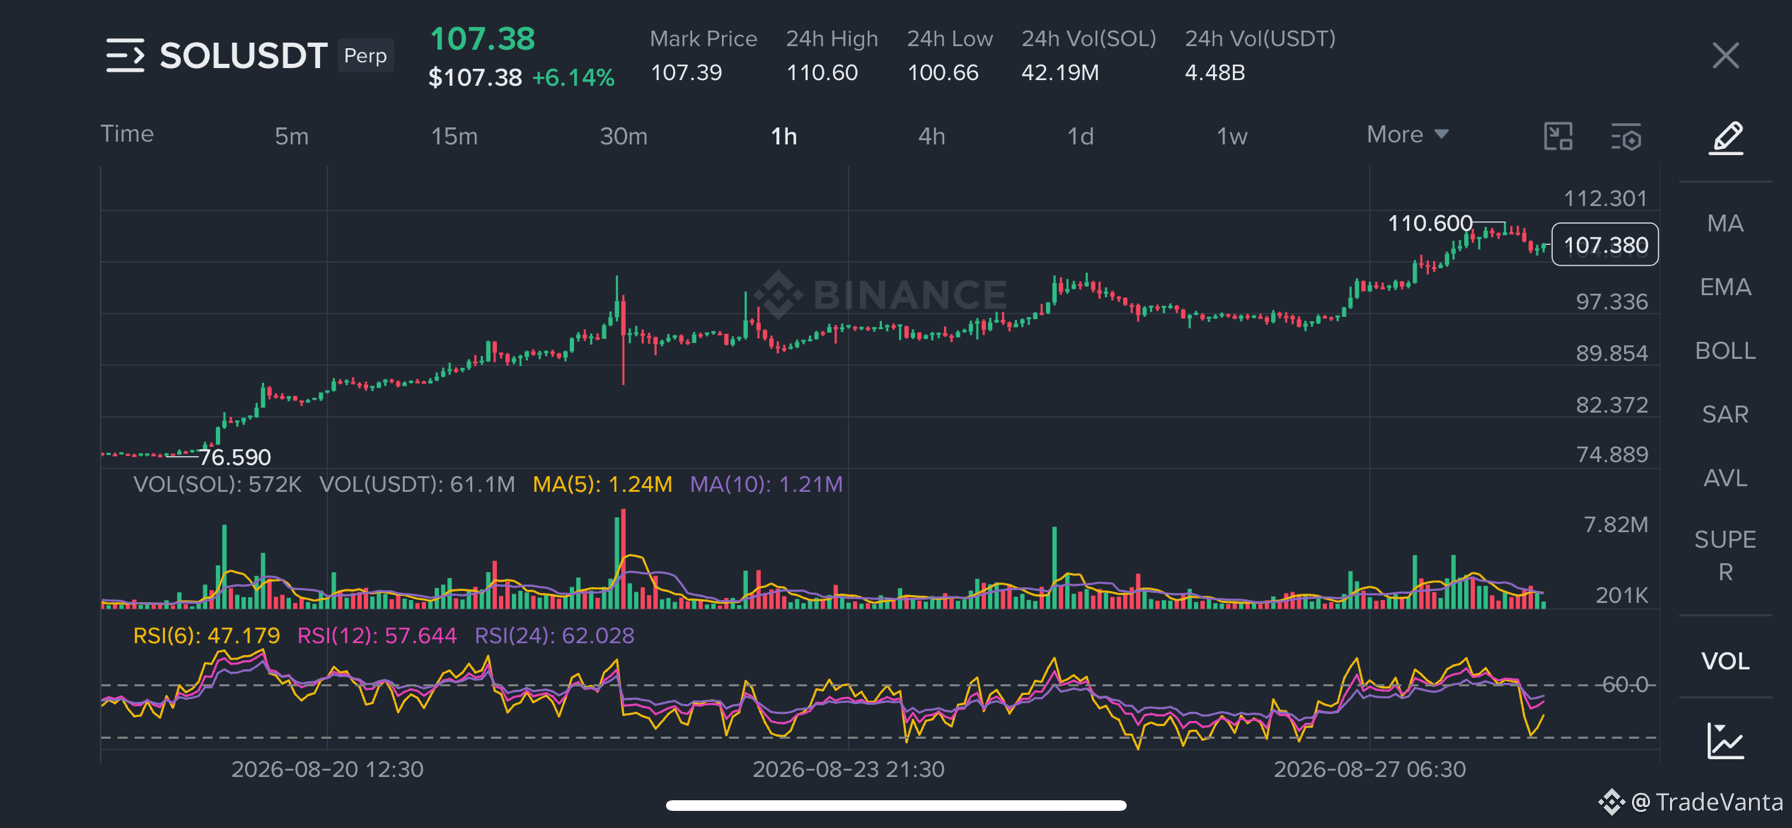
$SOL is showing a bullish multi-timeframe market structure, with the strongest confirmation visible on the 4H and 1D charts. From the major $60.03 low, price established a powerful expansion toward the recent $110.60 high, producing higher highs and higher lows.
From an SMC/ICT perspective, $110.60 represents the most important immediate buy-side liquidity pool. Price currently trades around $107.37, leaving it close to external liquidity but without a confirmed sweep or bearish CHoCH. The 4H displacement remains bullish, although current price sits firmly in the premium zone of the approximately $70.51–$110.60 dealing range, whose equilibrium is near $90.56.
Elliott Wave analysis suggests the advance from $60.03 may represent a larger bullish impulse, potentially approaching a late-stage wave, although the exact count remains uncertain.
Key levels are $110.60 resistance, approximately $100.97 and $94.82 support, and $70.51 as major 4H structure. With price extended near liquidity, patience is preferable to chasing.
$SOL is showing a bullish multi-timeframe market structure, with the strongest confirmation visible on the 4H and 1D charts. From the major $60.03 low, price established a powerful expansion toward the recent $110.60 high, producing higher highs and higher lows.
From an SMC/ICT perspective, $110.60 represents the most important immediate buy-side liquidity pool. Price currently trades around $107.37, leaving it close to external liquidity but without a confirmed sweep or bearish CHoCH. The 4H displacement remains bullish, although current price sits firmly in the premium zone of the approximately $70.51–$110.60 dealing range, whose equilibrium is near $90.56.
Elliott Wave analysis suggests the advance from $60.03 may represent a larger bullish impulse, potentially approaching a late-stage wave, although the exact count remains uncertain.
Key levels are $110.60 resistance, approximately $100.97 and $94.82 support, and $70.51 as major 4H structure. With price extended near liquidity, patience is preferable to chasing.
$AKE Institutional SMC/ICT Market Structure Analysis
$AKE currently presents a mixed but cautious market structure across the supplied timeframes. On the daily chart, price remains in a broad corrective phase after reaching 0.016300, with major external liquidity near 0.00909, 0.01015, and 0.01630, while significant sell-side liquidity sits around 0.00486. On the 4H chart, the sharp move into 0.00486, followed by strong upside displacement and elevated volume, resembles a sell side liquidity sweep. However, the subsequent rally failed to maintain bullish continuation. The 1H structure now shows weaker price action, with lower highs developing after the rebound. The 15M chart confirms short-term weakness around 0.00739. From an ICT perspective, the market appears to have swept liquidity before redistributing. Elliott Wave interpretation favors a corrective ABC or complex structure, although confirmation is lacking. Overall, structure remains uncertain, making patience preferable to forcing a trade at this stage.
$AKE currently presents a mixed but cautious market structure across the supplied timeframes. On the daily chart, price remains in a broad corrective phase after reaching 0.016300, with major external liquidity near 0.00909, 0.01015, and 0.01630, while significant sell-side liquidity sits around 0.00486. On the 4H chart, the sharp move into 0.00486, followed by strong upside displacement and elevated volume, resembles a sell side liquidity sweep. However, the subsequent rally failed to maintain bullish continuation. The 1H structure now shows weaker price action, with lower highs developing after the rebound. The 15M chart confirms short-term weakness around 0.00739. From an ICT perspective, the market appears to have swept liquidity before redistributing. Elliott Wave interpretation favors a corrective ABC or complex structure, although confirmation is lacking. Overall, structure remains uncertain, making patience preferable to forcing a trade at this stage.
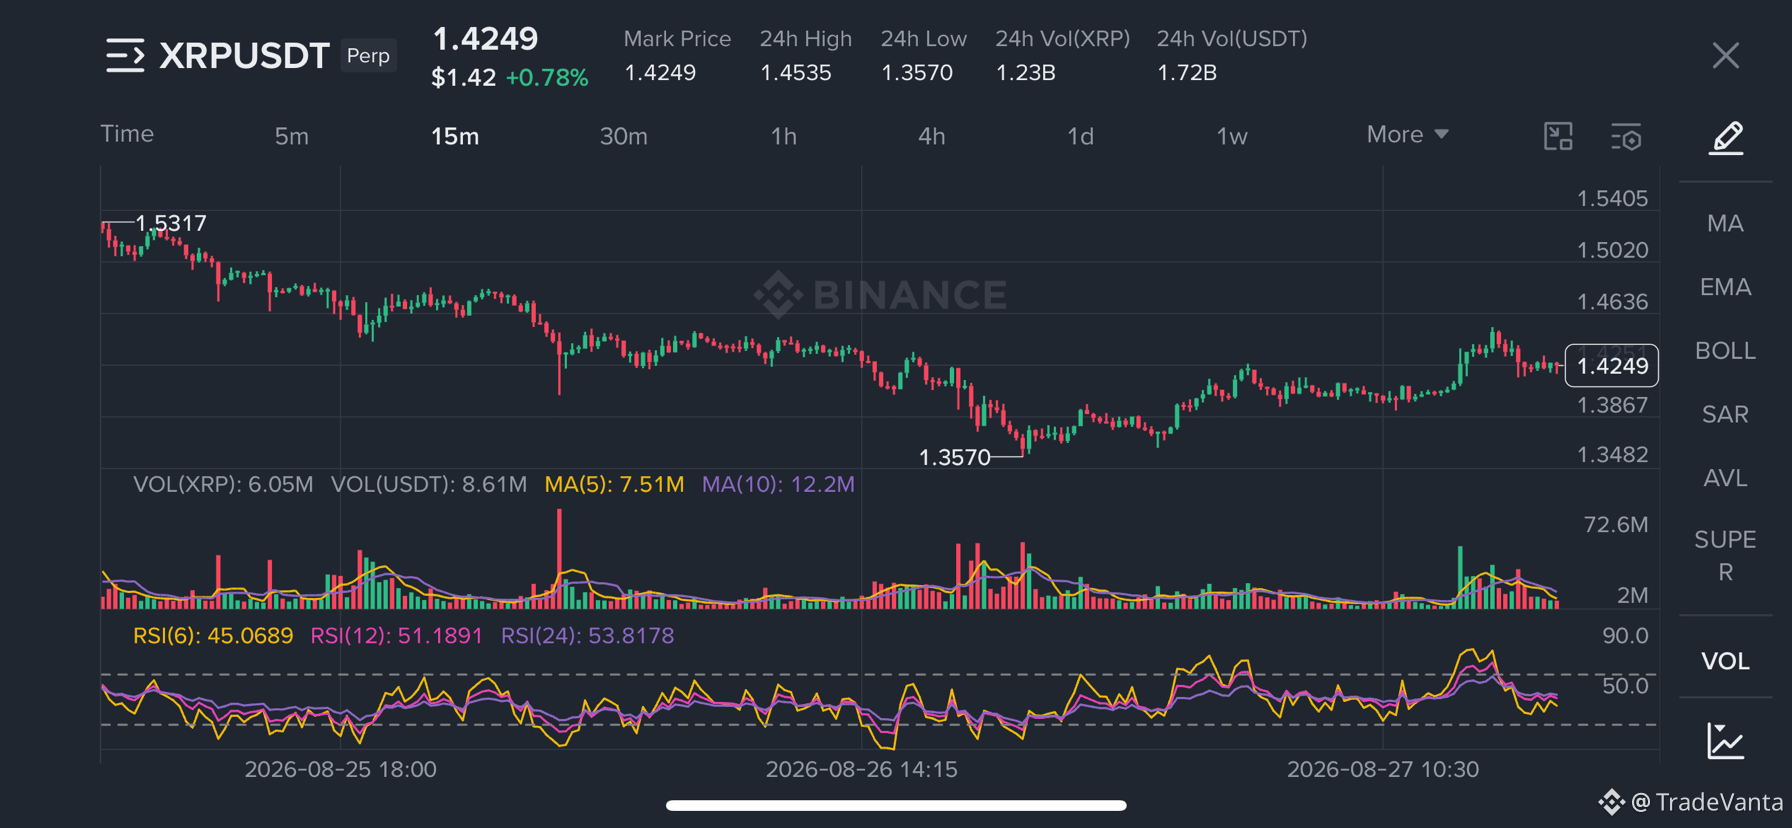
$XRP higher-timeframe structure remains bullish, but the market is currently consolidating after its sharp advance from the 0.9844 area to 1.7010. On the 15-minute chart, price is ranging between roughly 1.3570 and 1.4535, with no clearly confirmed BOS or CHoCH at current levels. Liquidity is concentrated around 1.4535 above and 1.3570 below, while the major external pools sit at 1.7010 and 0.9844. From an ICT perspective, price is in premium relative to the 0.9844–1.7010 dealing range, making immediate longs less attractive without a liquidity sweep and displacement. No precise FVG, order block, or breaker can be confirmed from the supplied screenshots. Elliott Wave analysis favors a large bullish impulse followed by corrective consolidation, although the exact wave degree remains uncertain. Deeper decline could represent correction; renewed expansion favors continuation.
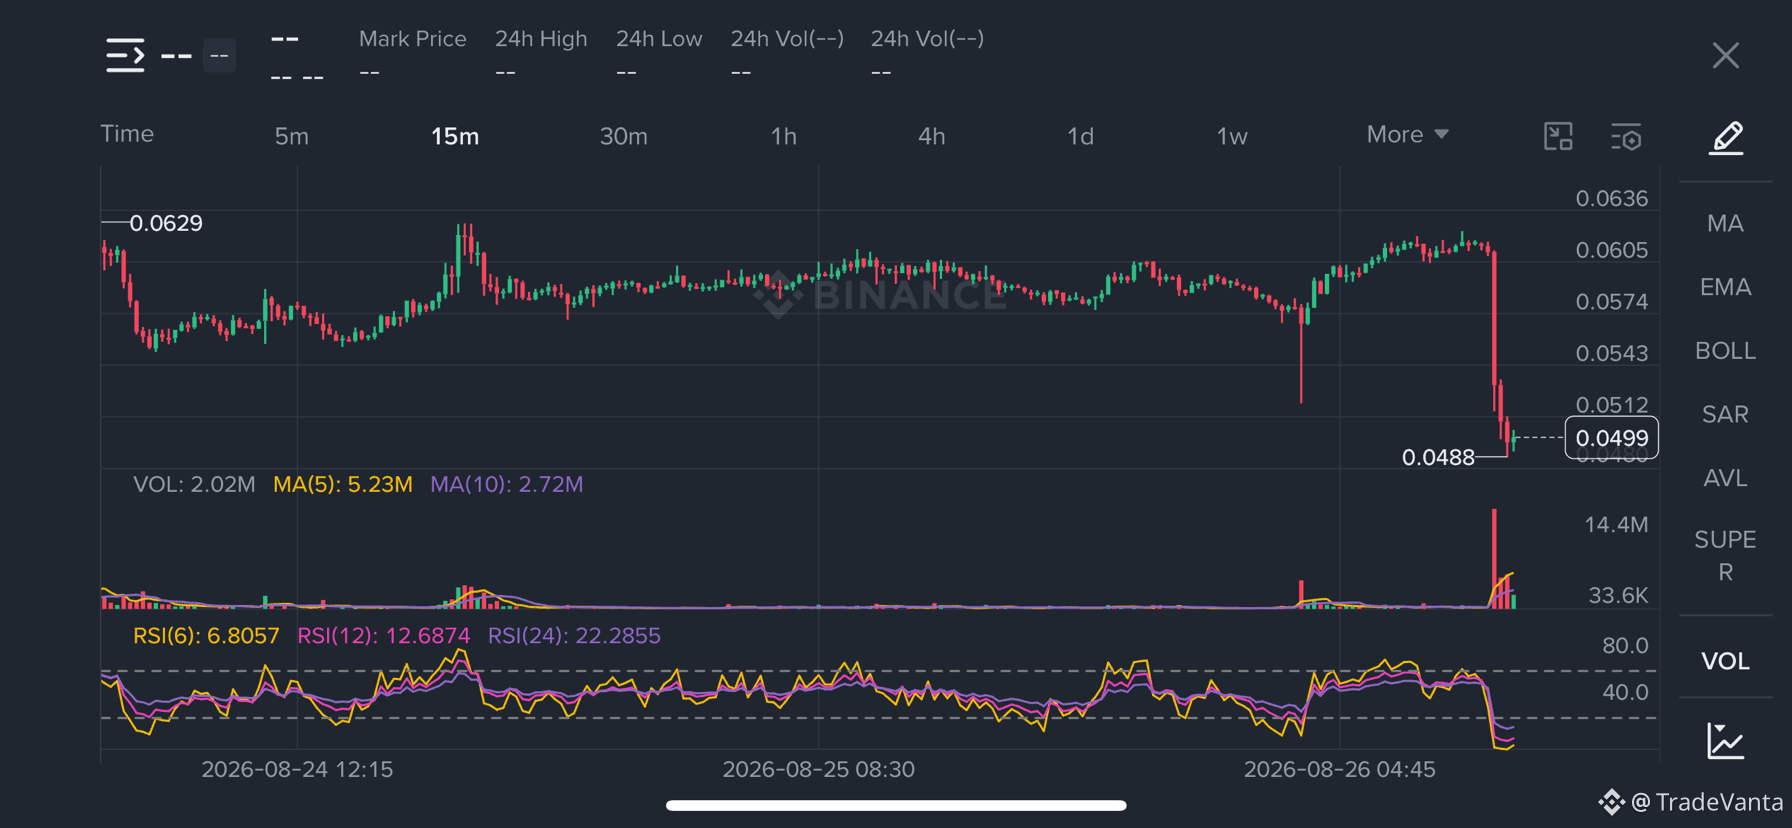
$TAKE Institutional SMC/ICT Market Structure, Liquidity & Elliott Wave Outlook
The current market structure remains cautious, with short-term bearish momentum developing after rejection from the 0.056–0.0605 region. On the 1H and 15m charts, price experienced strong bearish displacement toward approximately 0.0488–0.0500, breaking the preceding consolidation. This suggests bearish delivery toward sell-side liquidity, although a bullish MSS or CHoCH has not yet been confirmed.
From an ICT perspective, the 0.0488–0.0500 area represents important recent sell-side liquidity. Price has reacted from this zone, but the bounce lacks sufficient bullish displacement to confirm a liquidity-sweep reversal. Meanwhile, the broader 4H dealing range places current price in discount, making aggressive short entries less attractive.
Elliott Wave analysis favors a potential ABC corrective structure following the major advance toward 0.0794–0.0800. The decline toward 0.029–0.030 may represent Wave A, the recovery toward 0.056–0.057 Wave B, and the current decline potentially Wave C. However, this count remains probabilistic rather than confirmed.
The current market structure remains cautious, with short-term bearish momentum developing after rejection from the 0.056–0.0605 region. On the 1H and 15m charts, price experienced strong bearish displacement toward approximately 0.0488–0.0500, breaking the preceding consolidation. This suggests bearish delivery toward sell-side liquidity, although a bullish MSS or CHoCH has not yet been confirmed.
From an ICT perspective, the 0.0488–0.0500 area represents important recent sell-side liquidity. Price has reacted from this zone, but the bounce lacks sufficient bullish displacement to confirm a liquidity-sweep reversal. Meanwhile, the broader 4H dealing range places current price in discount, making aggressive short entries less attractive.
Elliott Wave analysis favors a potential ABC corrective structure following the major advance toward 0.0794–0.0800. The decline toward 0.029–0.030 may represent Wave A, the recovery toward 0.056–0.057 Wave B, and the current decline potentially Wave C. However, this count remains probabilistic rather than confirmed.
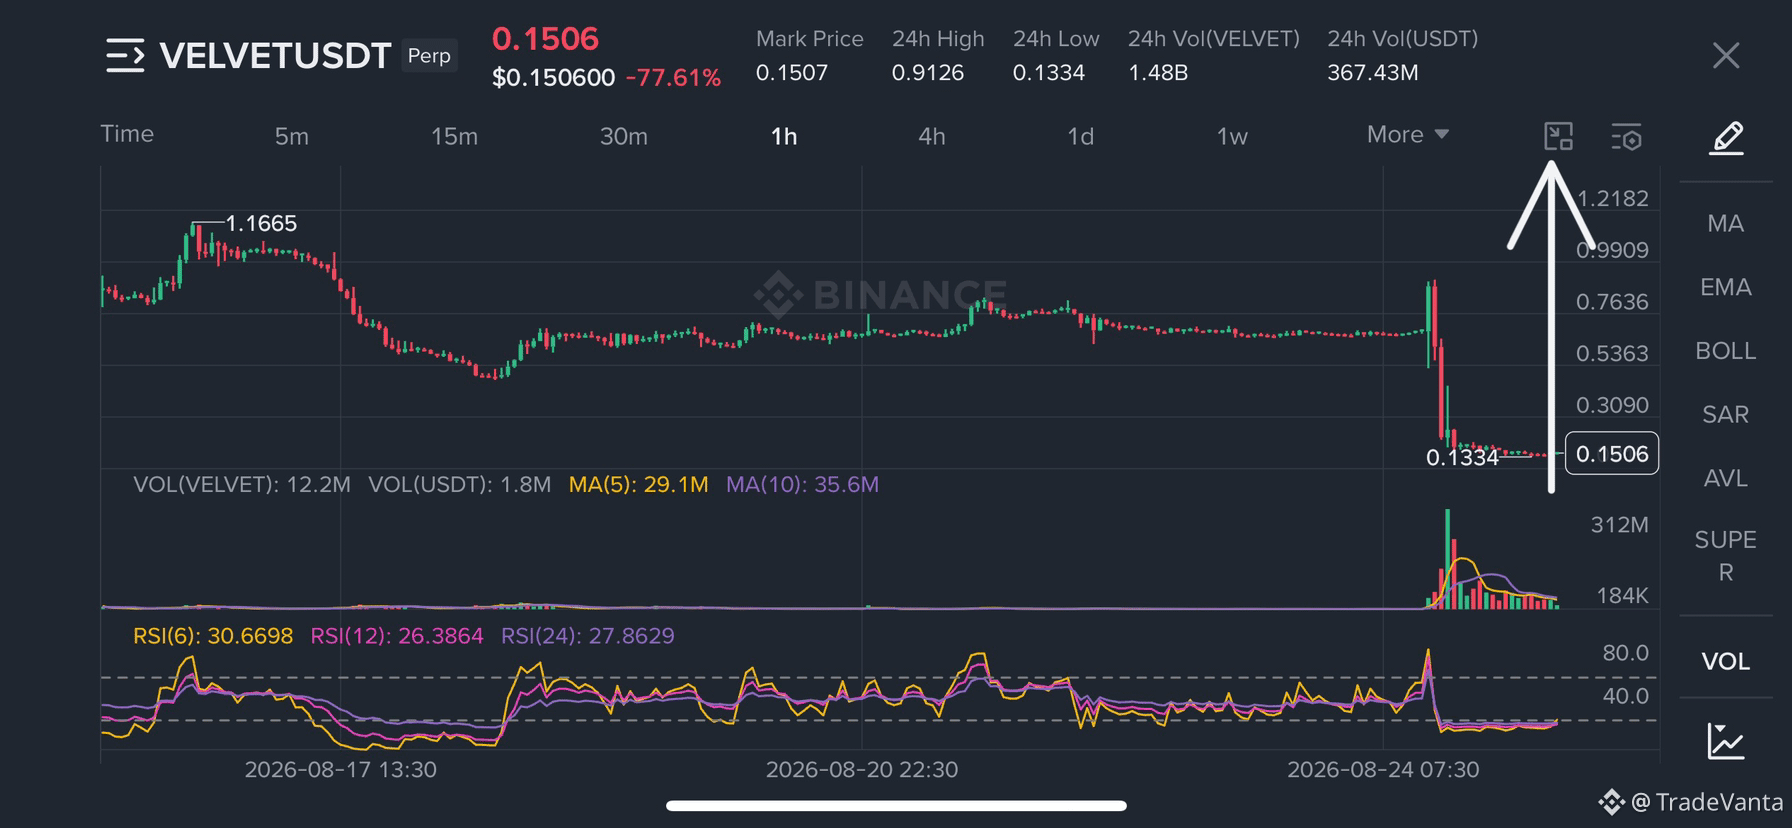
$VELVET Faces a Sharp Bearish Market Structure
$VELVET market structure remains strongly bearish across the higher timeframes. On the daily chart, the token experienced a dramatic decline after reaching major highs near $2.17, creating a sequence of lower highs and weaker ranges. The 4H chart confirms the bearish trend, with price falling from approximately $1.247 toward the $0.1334 low. On the 1H timeframe, the latest selloff shows strong bearish displacement accompanied by a volume surge. Price has since stabilized near $0.1505, but no bullish BOS or CHoCH is visible. The 15m chart shows momentum recovery, with RSI improving, yet this does not confirm a reversal. $0.1334 remains the current critical structural low. A break could signal further downside, while reclaiming resistance with displacement would strengthen a reversal.
$VELVET market structure remains strongly bearish across the higher timeframes. On the daily chart, the token experienced a dramatic decline after reaching major highs near $2.17, creating a sequence of lower highs and weaker ranges. The 4H chart confirms the bearish trend, with price falling from approximately $1.247 toward the $0.1334 low. On the 1H timeframe, the latest selloff shows strong bearish displacement accompanied by a volume surge. Price has since stabilized near $0.1505, but no bullish BOS or CHoCH is visible. The 15m chart shows momentum recovery, with RSI improving, yet this does not confirm a reversal. $0.1334 remains the current critical structural low. A break could signal further downside, while reclaiming resistance with displacement would strengthen a reversal.
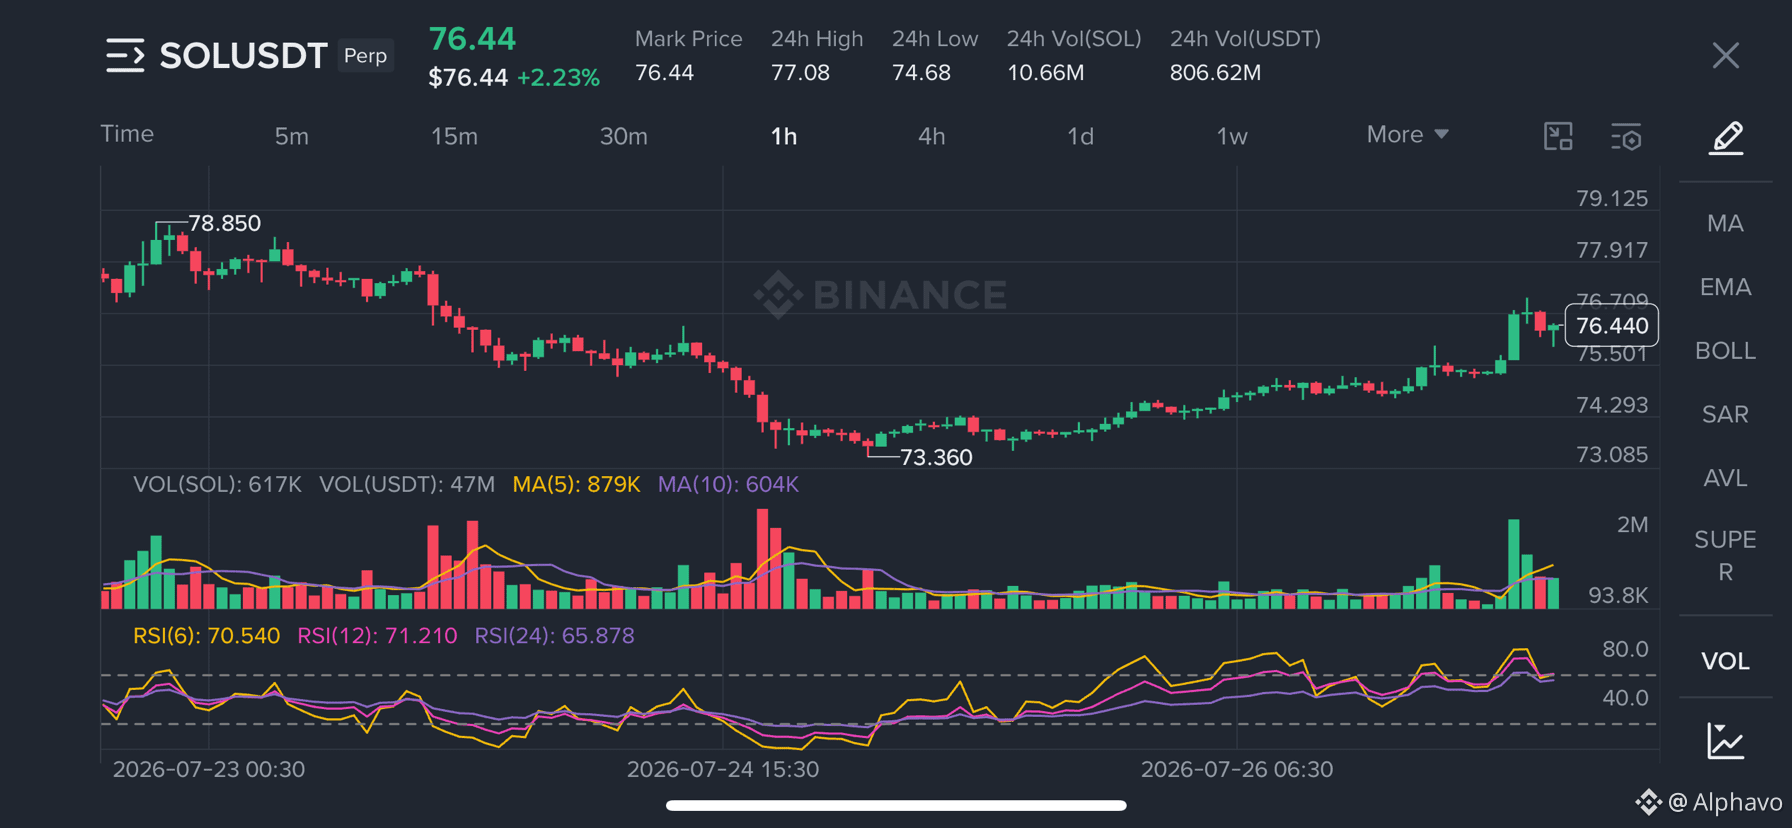
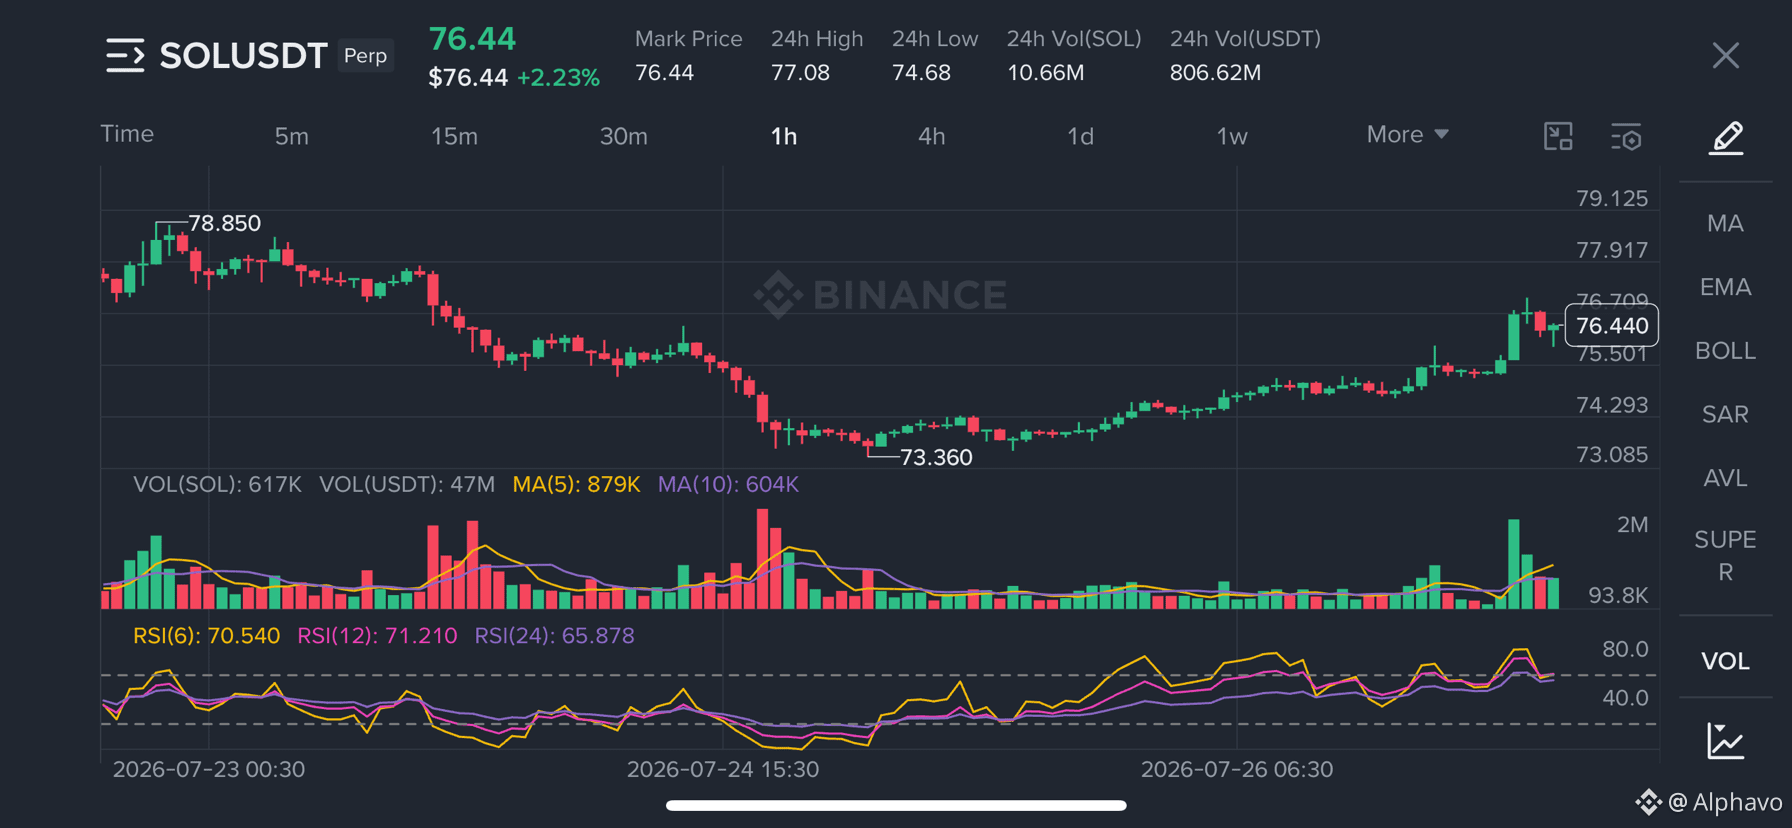
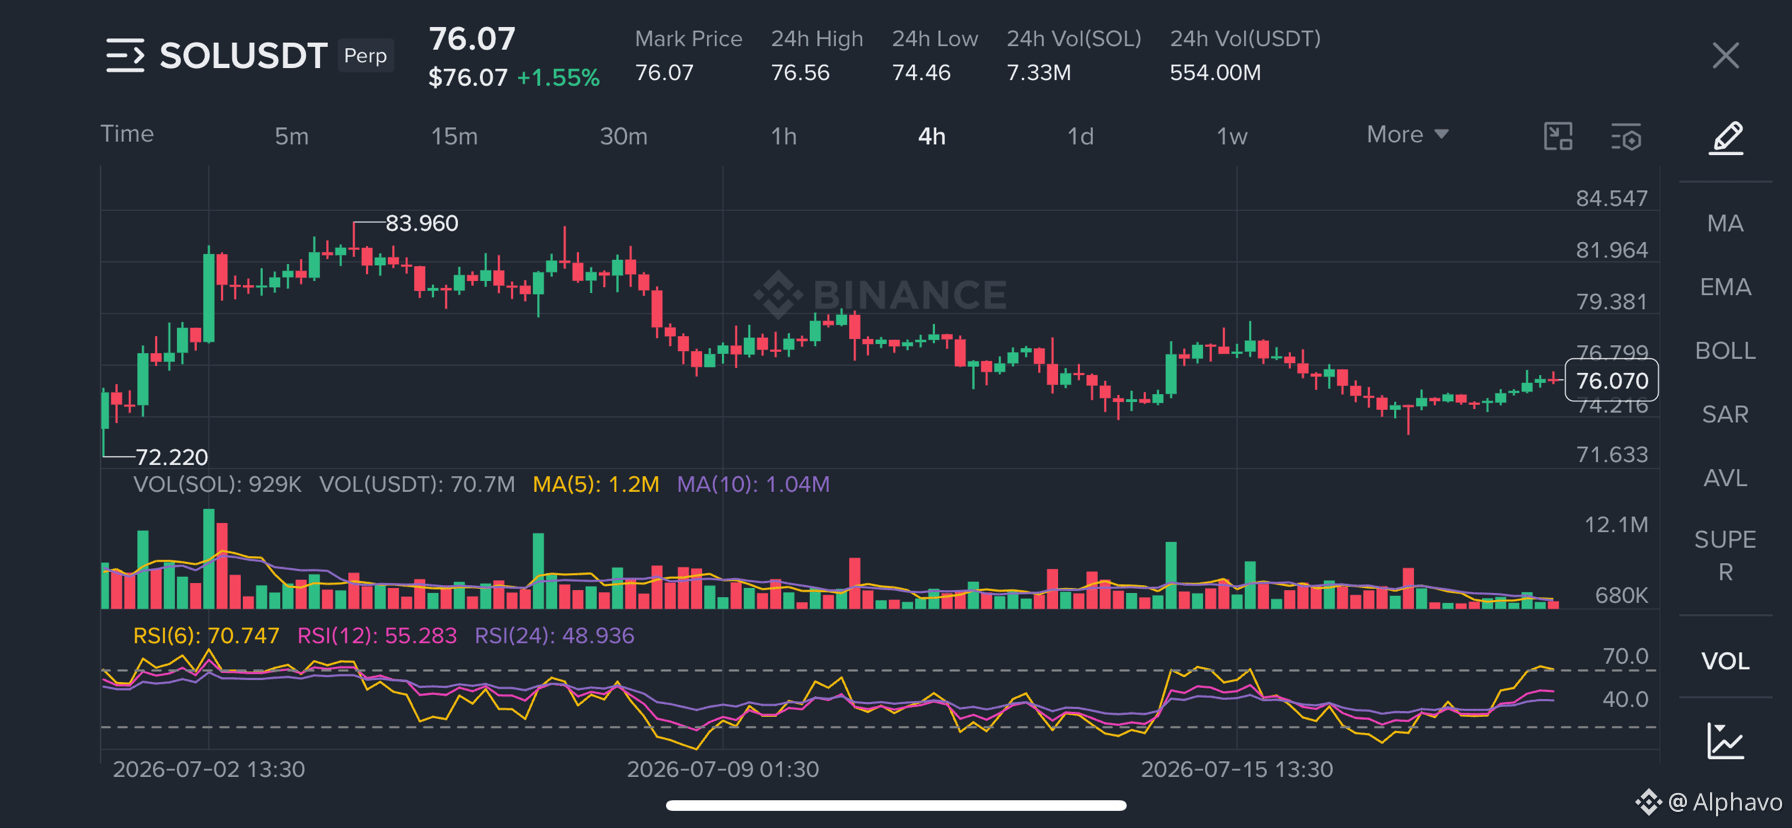
$SOL Is it about to explode? ICT + SMC Targets: TP1 $78.80|TP2 $81.50|TP3 $86.20
$SOL shows a bullish signal of ICT (Institutional Trading Concepts) liquidity recovery. Price has re-climbed above the recent equal highs, and SMC (Smart Money Concepts) confirms that the market structure has shifted bullishly. Elliott Wave Theory indicates that the market may be entering the expansion phase of Wave 3, while Fibonacci analysis suggests the price could break above the 1.618 extension level.
If the price can continue to hold above $76.40, it may advance in sequence:
* TP1: $78.80
* TP2: $81.50
* TP3: $86.20
If it breaks below $74.70, bullish momentum will weaken.
$SOL shows a bullish signal of ICT (Institutional Trading Concepts) liquidity recovery. Price has re-climbed above the recent equal highs, and SMC (Smart Money Concepts) confirms that the market structure has shifted bullishly. Elliott Wave Theory indicates that the market may be entering the expansion phase of Wave 3, while Fibonacci analysis suggests the price could break above the 1.618 extension level.
If the price can continue to hold above $76.40, it may advance in sequence:
* TP1: $78.80
* TP2: $81.50
* TP3: $86.20
If it breaks below $74.70, bullish momentum will weaken.
$SOL Ready to Explode? ICT + SMC Targets: TP1 $78.80 | TP2 $81.50 | TP3 $86.20
$SOL shows bullish ICT liquidity reclamation above recent equal highs, with SMC confirming market structure shift. Elliott Wave suggests Wave 3 expansion, while Fibonacci projects upside beyond 1.618 extension. Sustained acceptance above $76.40 favours TP1 $78.80, TP2 $81.50, TP3 $86.20; losing $74.70 weakens momentum.
$SOL shows bullish ICT liquidity reclamation above recent equal highs, with SMC confirming market structure shift. Elliott Wave suggests Wave 3 expansion, while Fibonacci projects upside beyond 1.618 extension. Sustained acceptance above $76.40 favours TP1 $78.80, TP2 $81.50, TP3 $86.20; losing $74.70 weakens momentum.
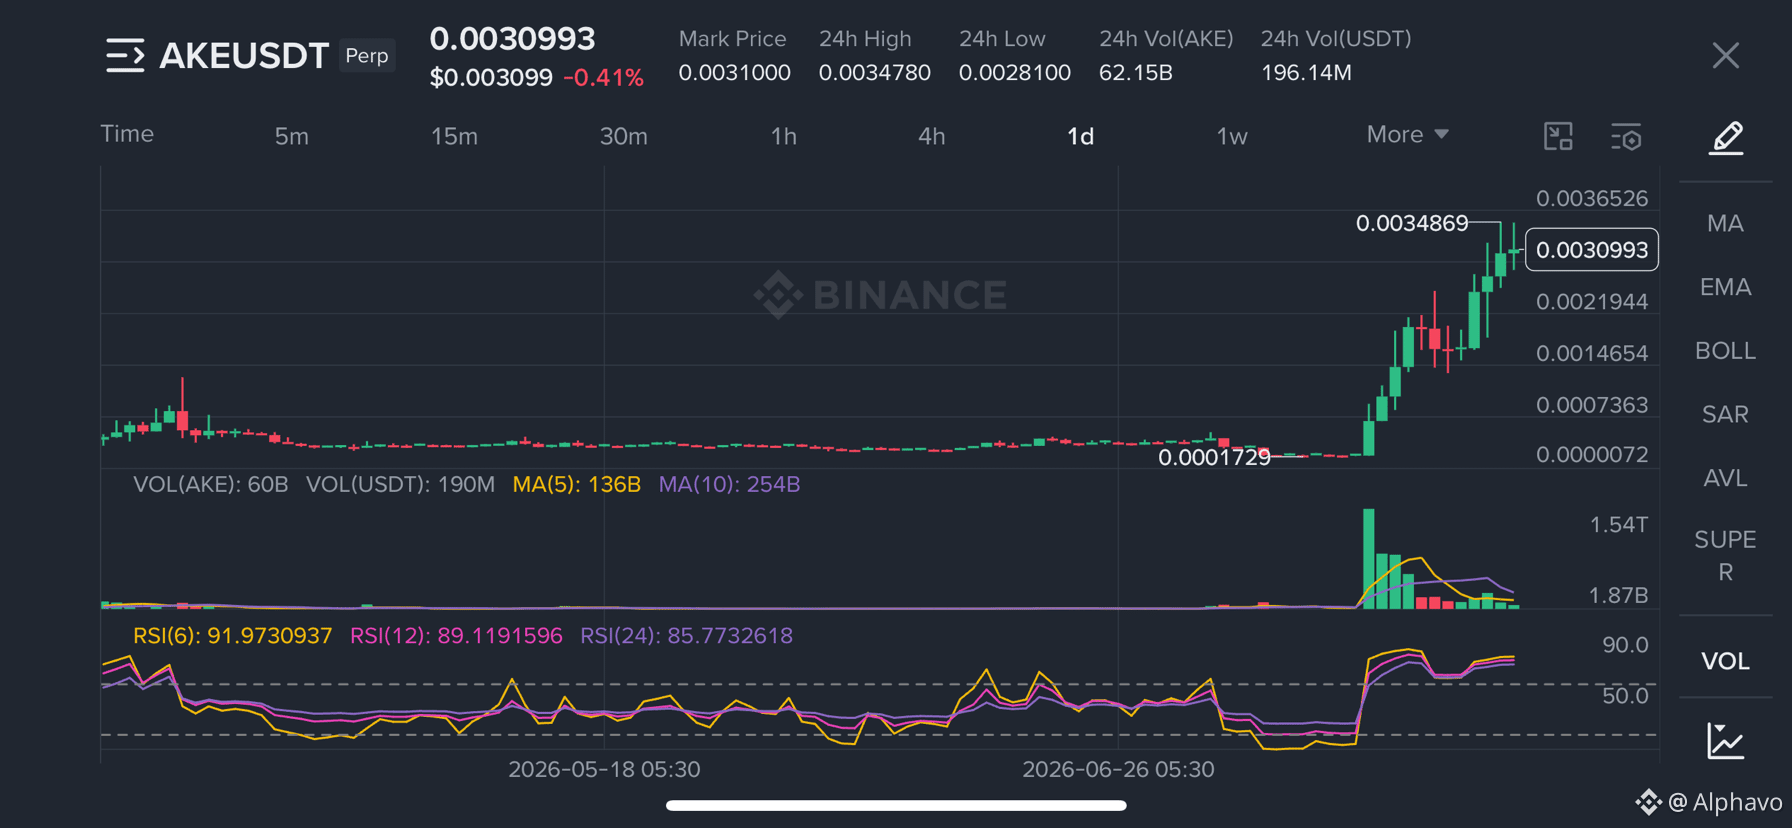
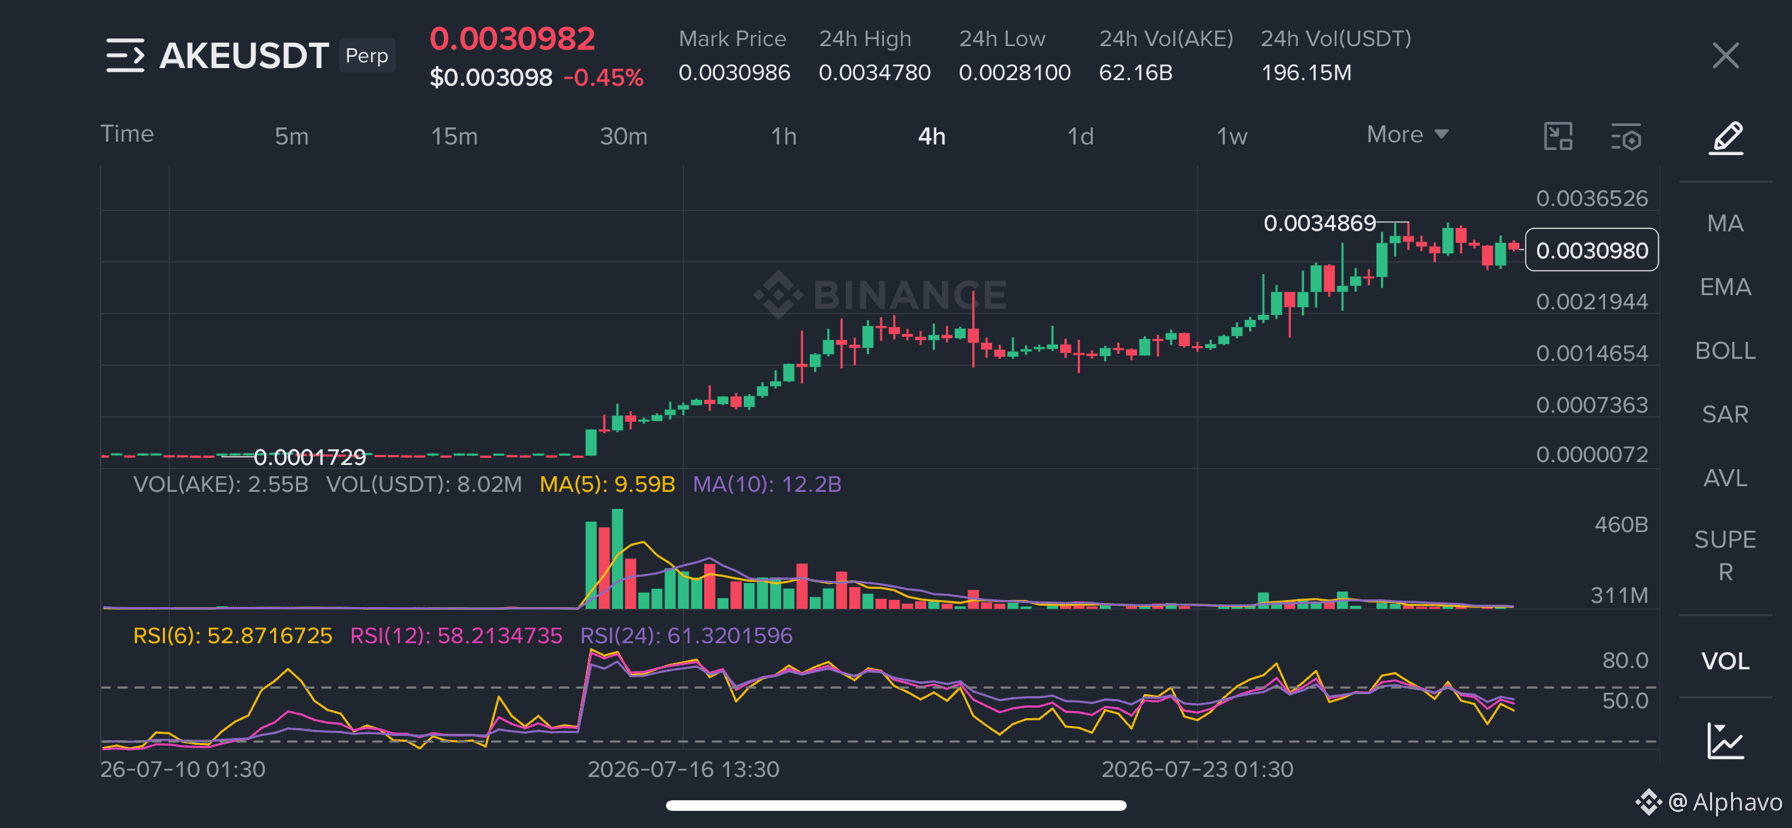
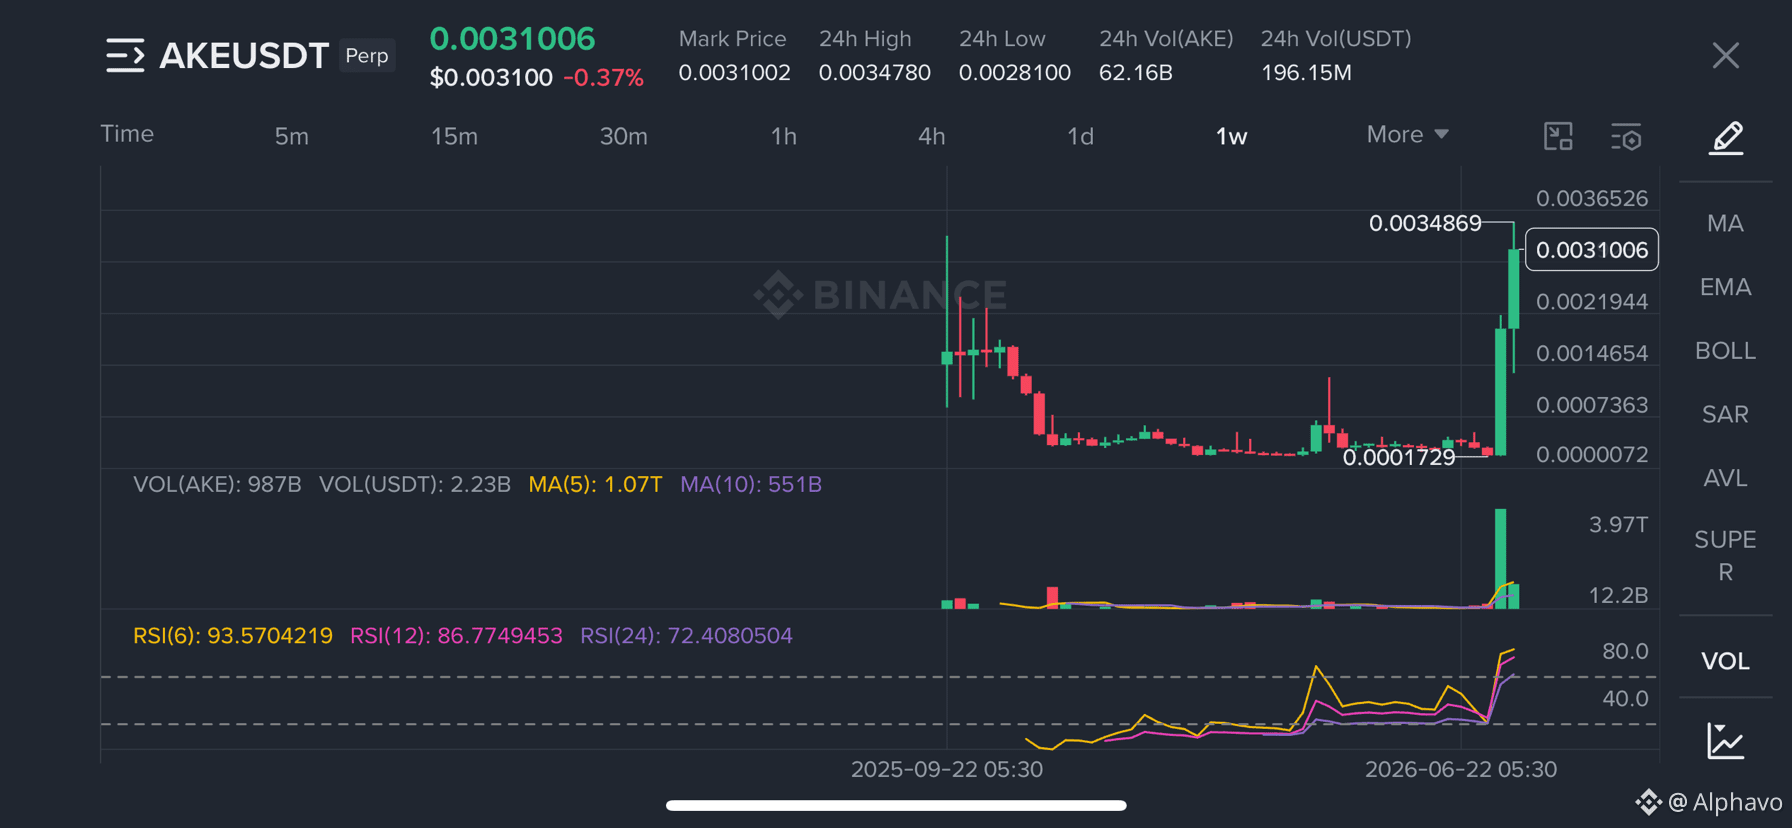
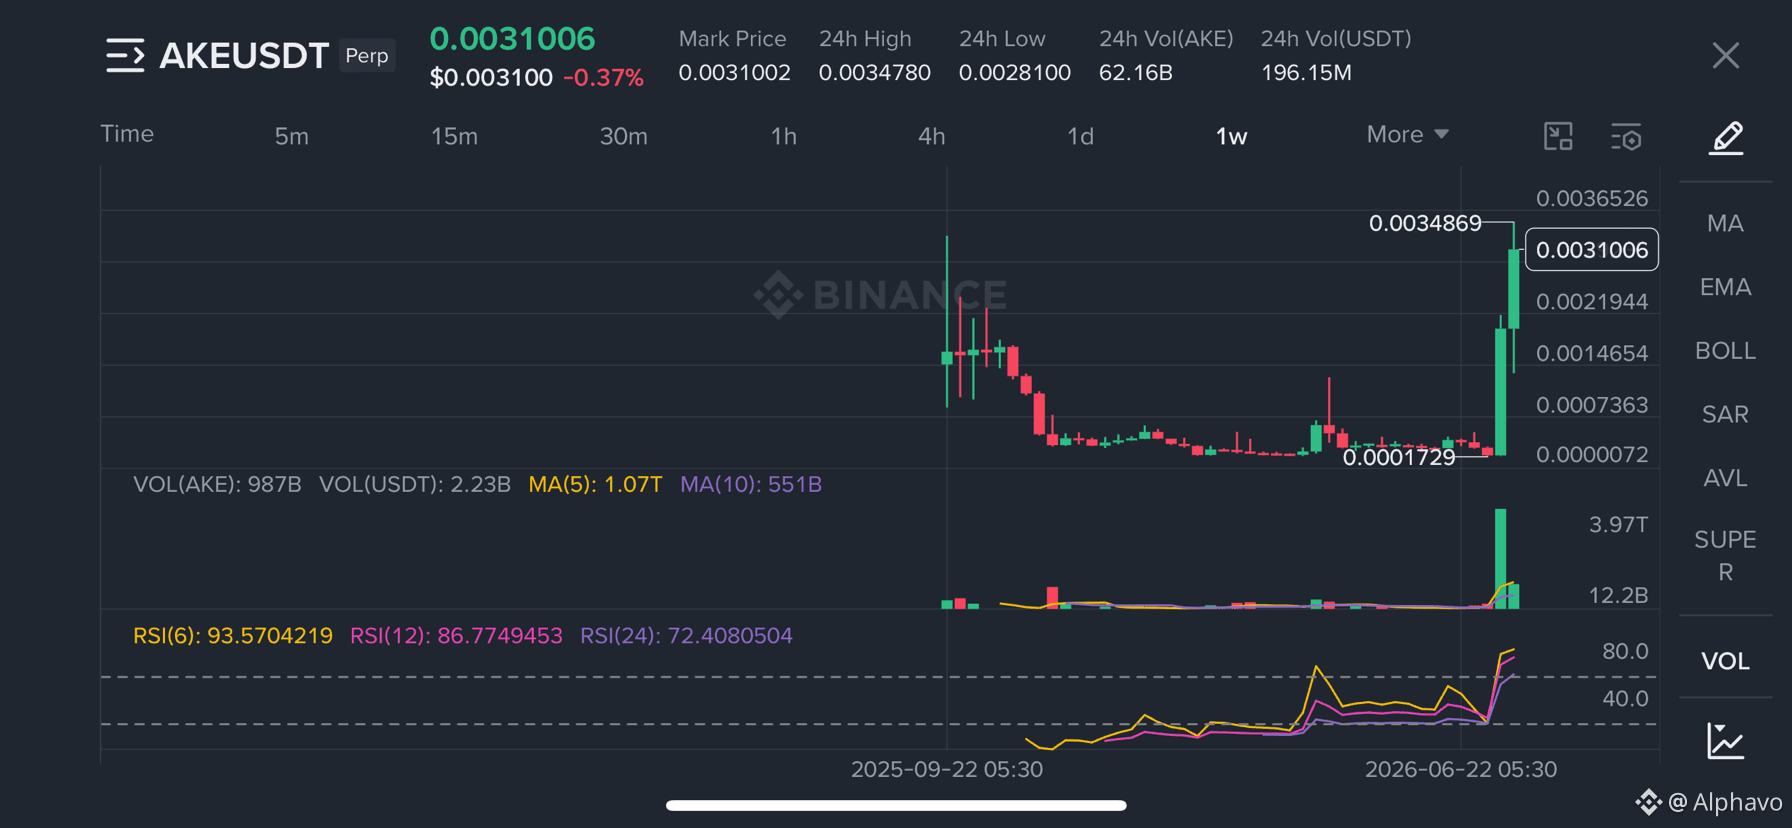
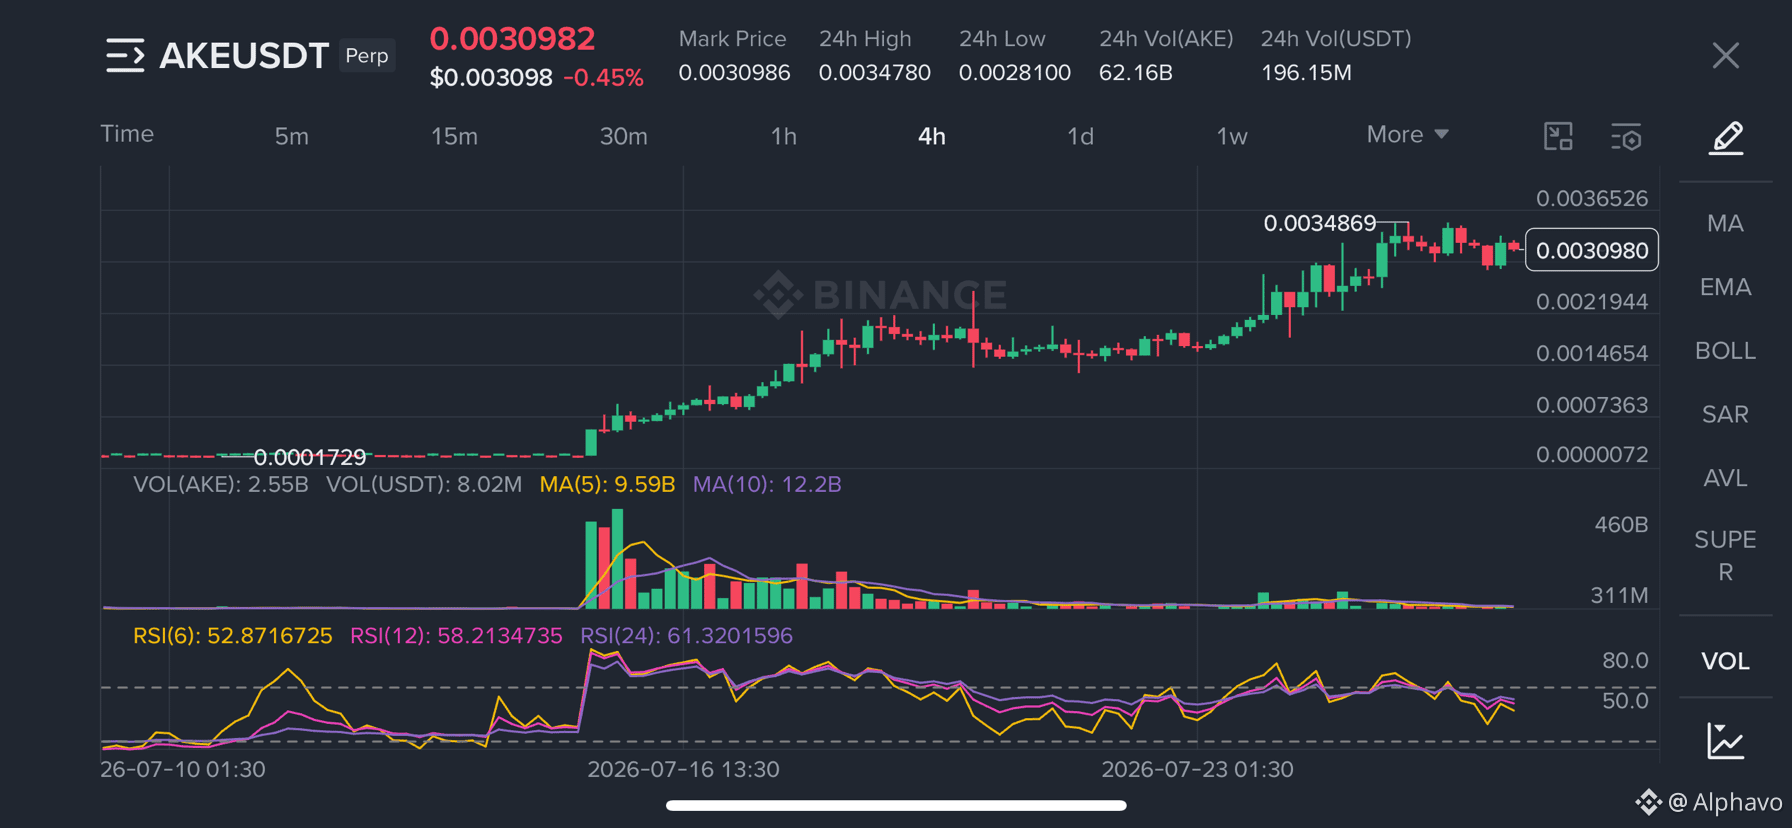
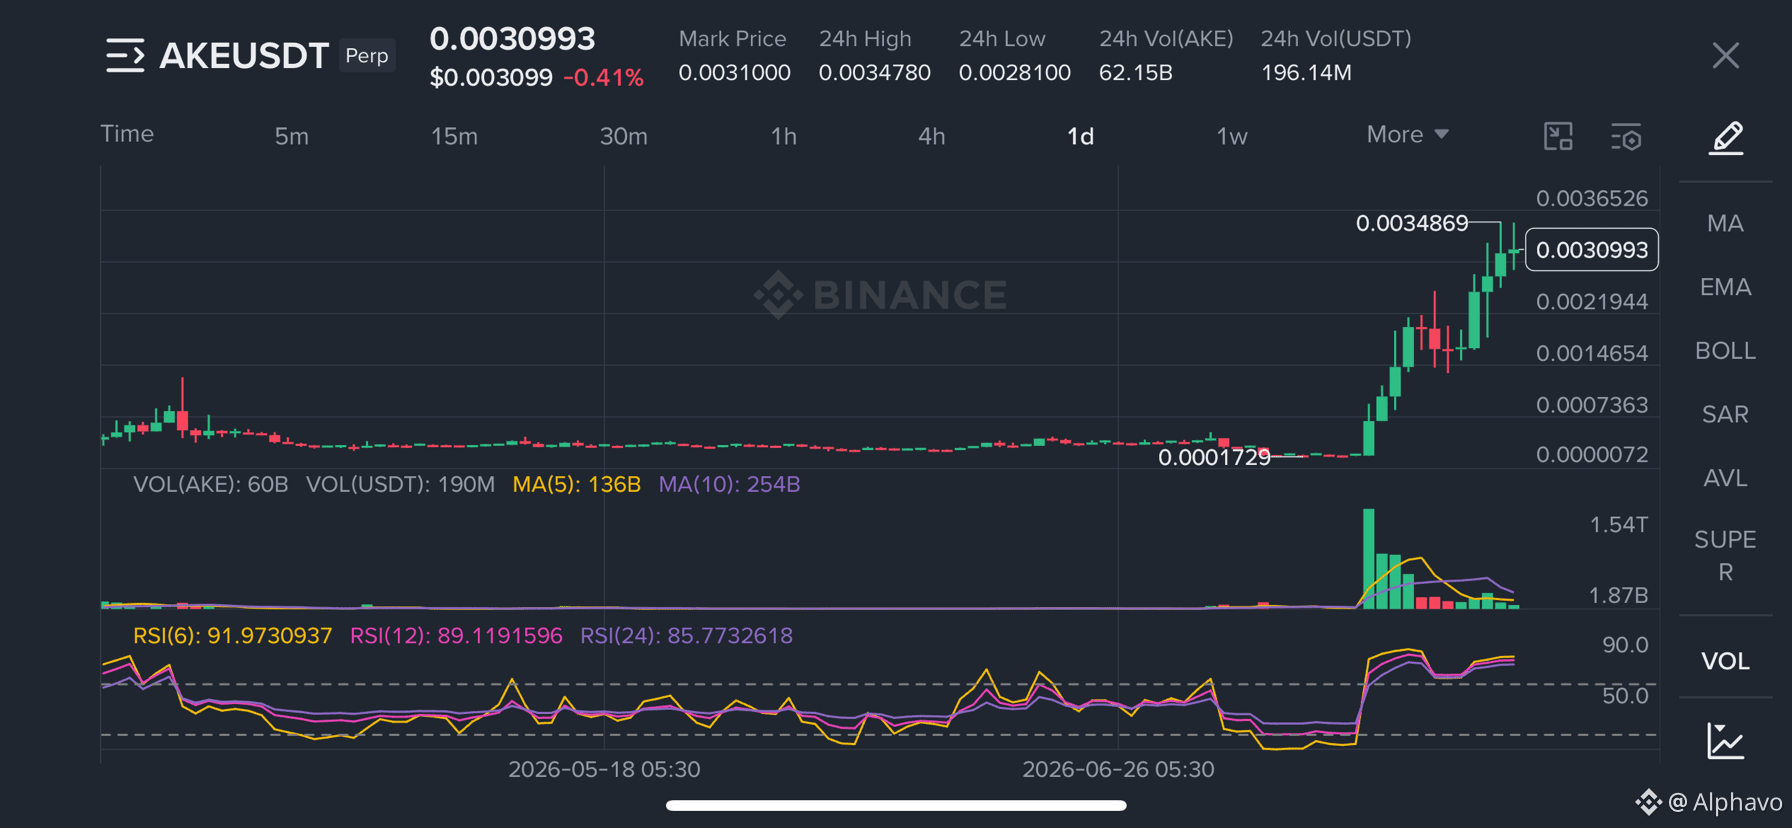
🚀 $AKE Is about to see a breakout? The next three take-profit targets announced: 0.00348, 0.00385, 0.00430
After $AKE clears the buy-side liquidity, it shows a strong ICT bullish displacement and confirms a market structure break (MSB). SMC (smart money concept) indicates that even though price has entered a premium zone, the overall bullish momentum remains strong. Elliott Wave theory suggests that it may currently be in the extension phase of Wave 5, and the Fibonacci projections also support further upside.
However, the RSI has entered the overbought zone, so before continuing higher, there may still be a healthy pullback.
Next take-profit targets (TP):
- 🎯 0.00348
- 🎯 0.00385
- 🎯 0.00430
After $AKE clears the buy-side liquidity, it shows a strong ICT bullish displacement and confirms a market structure break (MSB). SMC (smart money concept) indicates that even though price has entered a premium zone, the overall bullish momentum remains strong. Elliott Wave theory suggests that it may currently be in the extension phase of Wave 5, and the Fibonacci projections also support further upside.
However, the RSI has entered the overbought zone, so before continuing higher, there may still be a healthy pullback.
Next take-profit targets (TP):
- 🎯 0.00348
- 🎯 0.00385
- 🎯 0.00430
🚀 $AKE Ready to Explode? Next 3 Take-Profit Targets Revealed: 0.00348, 0.00385 & 0.00430
$AKE shows strong ICT bullish displacement after sweeping buy-side liquidity and confirming a market structure break. SMC indicates continued strength despite premium pricing. Elliott Wave suggests a developing Wave 5 extension, while Fibonacci projections favour higher targets. RSI is overbought, so a healthy retracement remains possible before continuation. Next TPs: 0.00348, 0.00385, 0.00430.
$AKE shows strong ICT bullish displacement after sweeping buy-side liquidity and confirming a market structure break. SMC indicates continued strength despite premium pricing. Elliott Wave suggests a developing Wave 5 extension, while Fibonacci projections favour higher targets. RSI is overbought, so a healthy retracement remains possible before continuation. Next TPs: 0.00348, 0.00385, 0.00430.
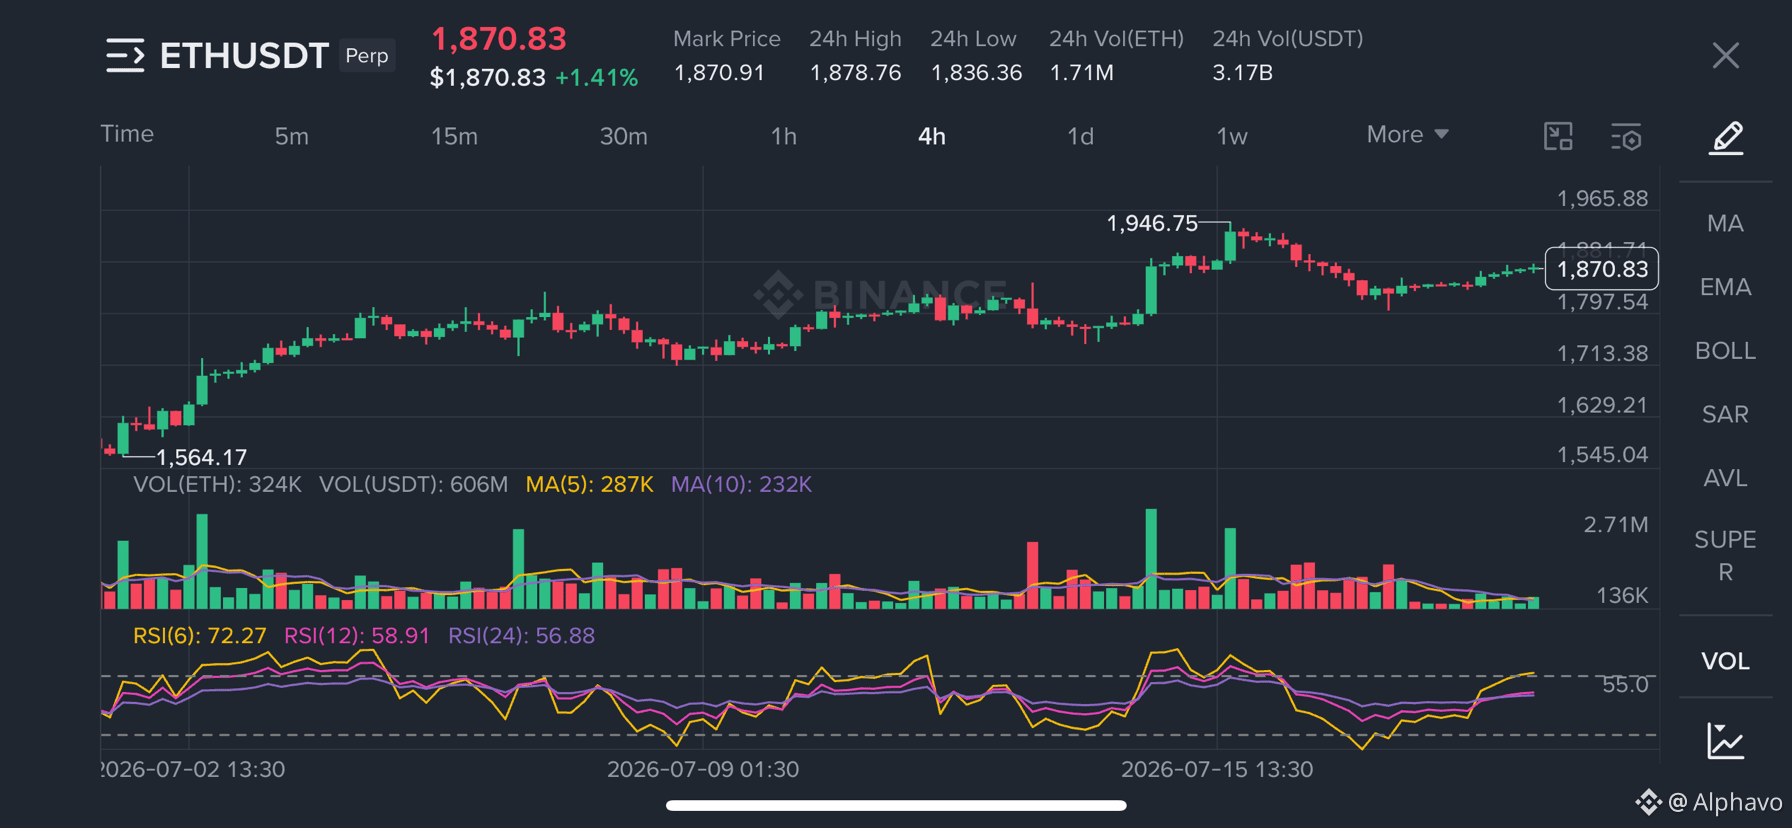
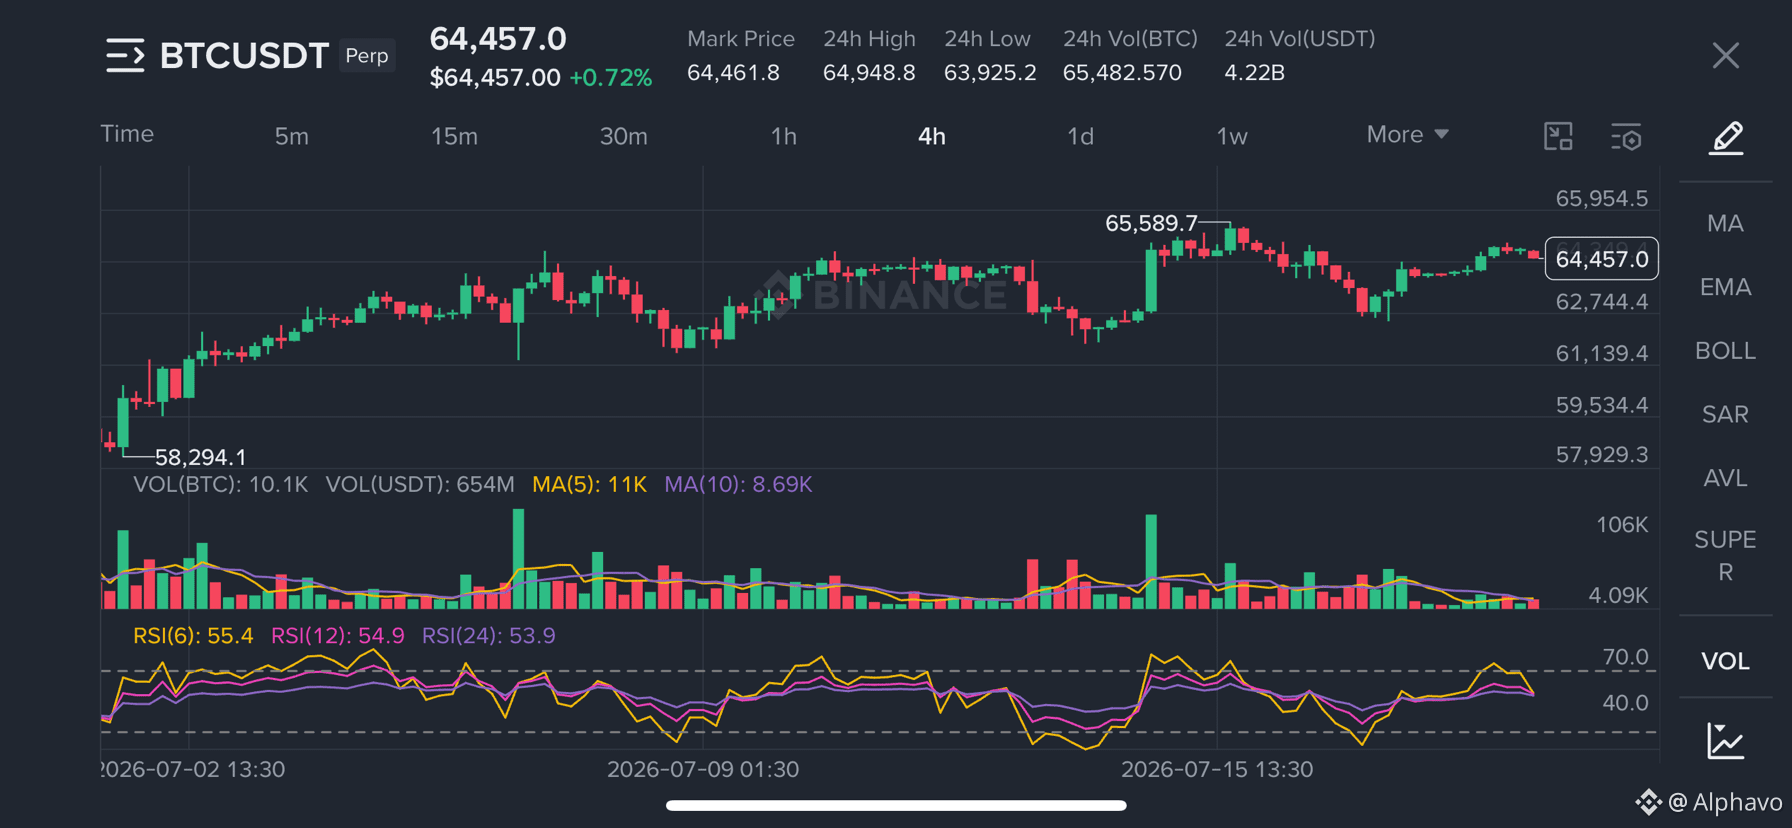
Crypto Market Outlook: $BTC , $ETH , and $SOL Signal Bullish Continuation Across Higher Timeframes
Bitcoin (BTC), Ethereum (ETH), and Solana (SOL) continue to show bullish momentum based on ICT, Smart Money Concepts (SMC), and Elliott Wave analysis. BTC has swept liquidity near $62.5K and maintains a bullish structure across the 1H, 4H, and 1D charts. Holding above $63.9K keeps targets at $64,950, $65,590, and $66,300–66,600 in focus.
SOL shows accumulation after clearing sell-side liquidity. A move above $76.8–79 confirms bullish continuation toward $77, $80, and $84, while a drop below $73.3 invalidates the setup.
ETH also reflects bullish accumulation, with Wave 3 potentially underway if $1,802 holds. Upside targets remain $1,947, $2,089, and $2,300. Traders should watch key support levels closely as bullish momentum
Bitcoin (BTC), Ethereum (ETH), and Solana (SOL) continue to show bullish momentum based on ICT, Smart Money Concepts (SMC), and Elliott Wave analysis. BTC has swept liquidity near $62.5K and maintains a bullish structure across the 1H, 4H, and 1D charts. Holding above $63.9K keeps targets at $64,950, $65,590, and $66,300–66,600 in focus.
SOL shows accumulation after clearing sell-side liquidity. A move above $76.8–79 confirms bullish continuation toward $77, $80, and $84, while a drop below $73.3 invalidates the setup.
ETH also reflects bullish accumulation, with Wave 3 potentially underway if $1,802 holds. Upside targets remain $1,947, $2,089, and $2,300. Traders should watch key support levels closely as bullish momentum
Log in to explore more content