

July 2023 Summary
In July, trading volumes of cryptocurrencies generally declined. CME traders shifted to a slight net short position in July. In addition, Bitcoin's annualized volatility fell to a quarterly low in July as trading volumes decreased. Bitcoin's price remained range-bound in July, consistent with its historical seasonal pattern. After Ripple's verdict on the SEC lawsuit in mid-July, some cryptocurrencies saw a significant increase in trading volume due to the $XRP market. The trading volume of major cryptocurrencies fell in the second half of July, and the market continued to slow down.
The Fed's monetary policy stance and the possibility of a "higher and longer" interest rate environment could lead to more uncertainty and heightened market volatility. Cryptocurrency markets are highly speculative and prices can be affected by a variety of factors, including regulatory developments, adoption rates, and monetary policy, among others. Investors and traders should carefully conduct a risk assessment before making any investment decisions.
Macroeconomics
Quantitative Tightening
The Fed is currently engaging in quantitative tightening and will continue to reduce its holdings of U.S. Treasury bonds, agency bonds, and mortgage-backed securities. This will effectively remove liquidity from the market and the economy. Reference: Federal Open Market Committee July Statement.
Inflation and interest rates
July's inflation data showed signs of moderation, with the U.S. CPI falling to 3% year-on-year in June and the core CPI falling to 0.2% month-on-month.
At the July FOMC meeting, the Fed raised its lending rate by 25 basis points.
Although inflation data fell to a yearly low, at the FOMC press conference, Chairman Powell said that the process of reducing inflation to 2% still has a long way to go. Later, the Chicago Mercantile Exchange's FedWatch tool reflected that the market expected the FOMC to raise interest rates again in September.
Inflation in European countries remains high, with CPI (year-on-year) falling to 5.5% in June and the ECB interest rate spread of 25 basis points in July. The ECB is also conducting quantitative tightening.
Cryptocurrency Market Review
2.1 Chicago Mercantile Exchange (CME) Bitcoin futures commercial institutions arbitrage in the rebound in June and turn to a slight net short position in July
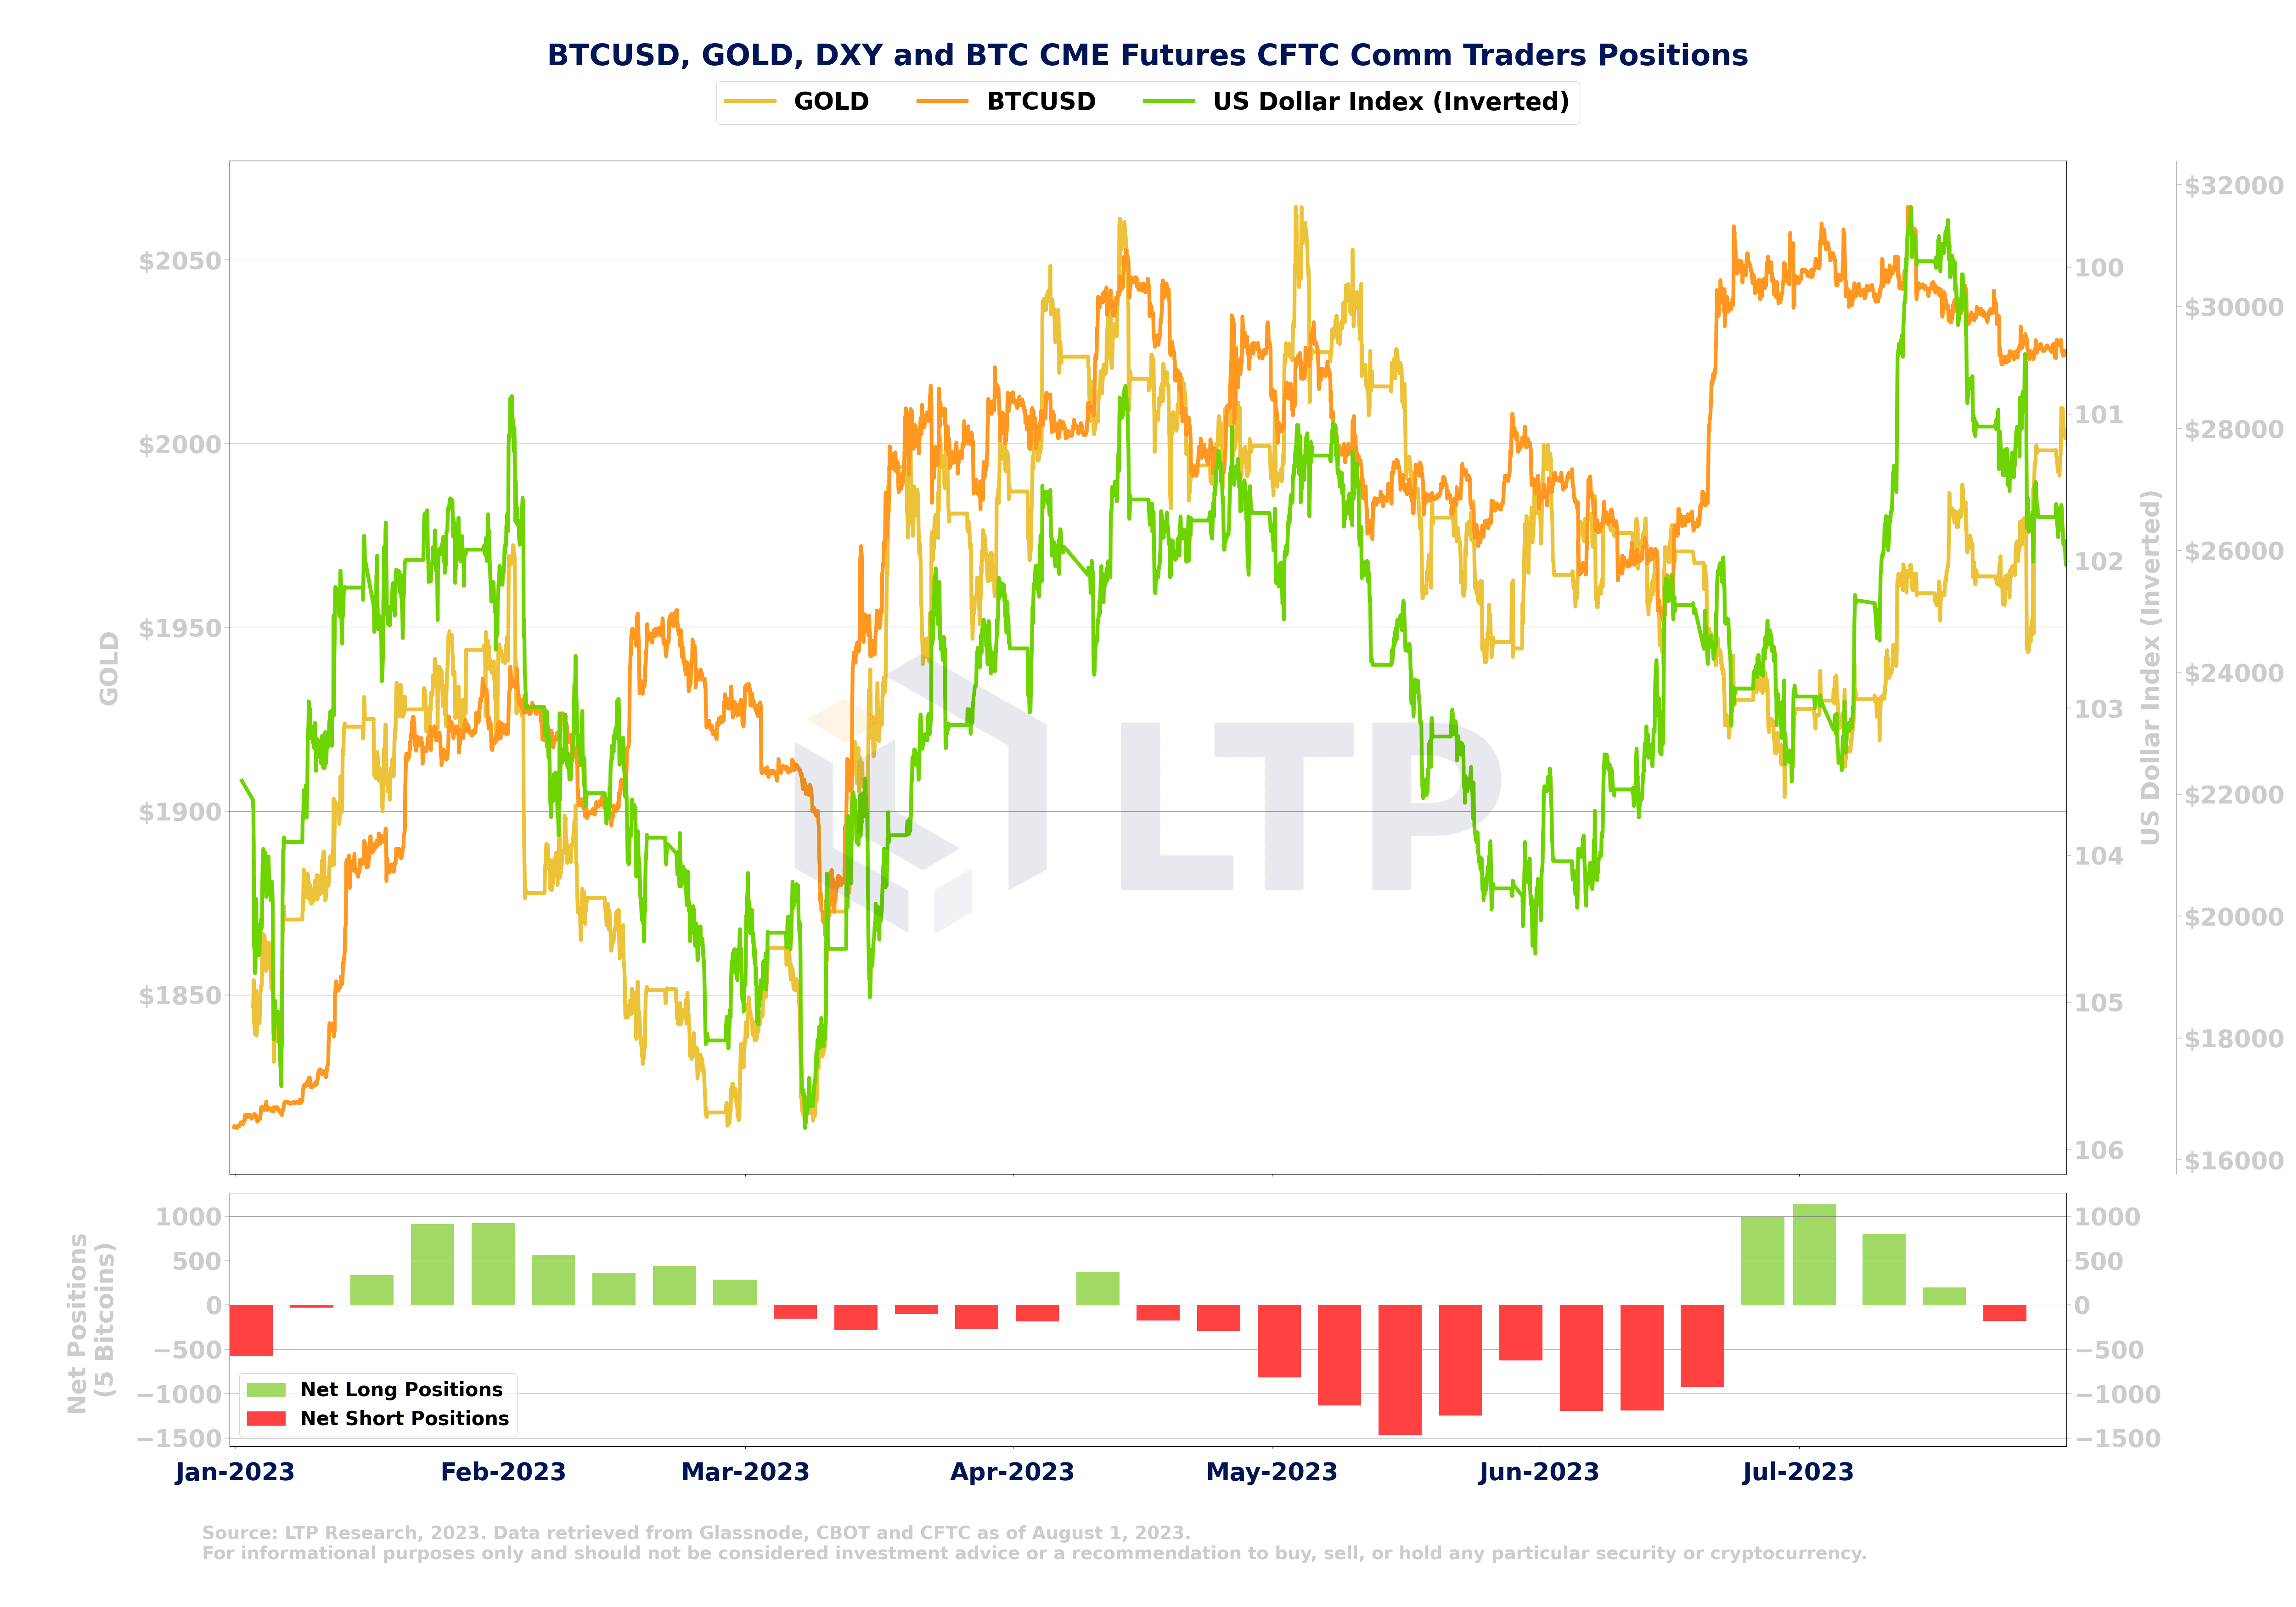
In July, CME commercial houses took advantage of June’s rally to reduce their net long positions. In the second half of the month, the U.S. dollar index rose significantly after falling sharply.
2.2 Bitcoin price remains above the cost basis of short-term and long-term holders
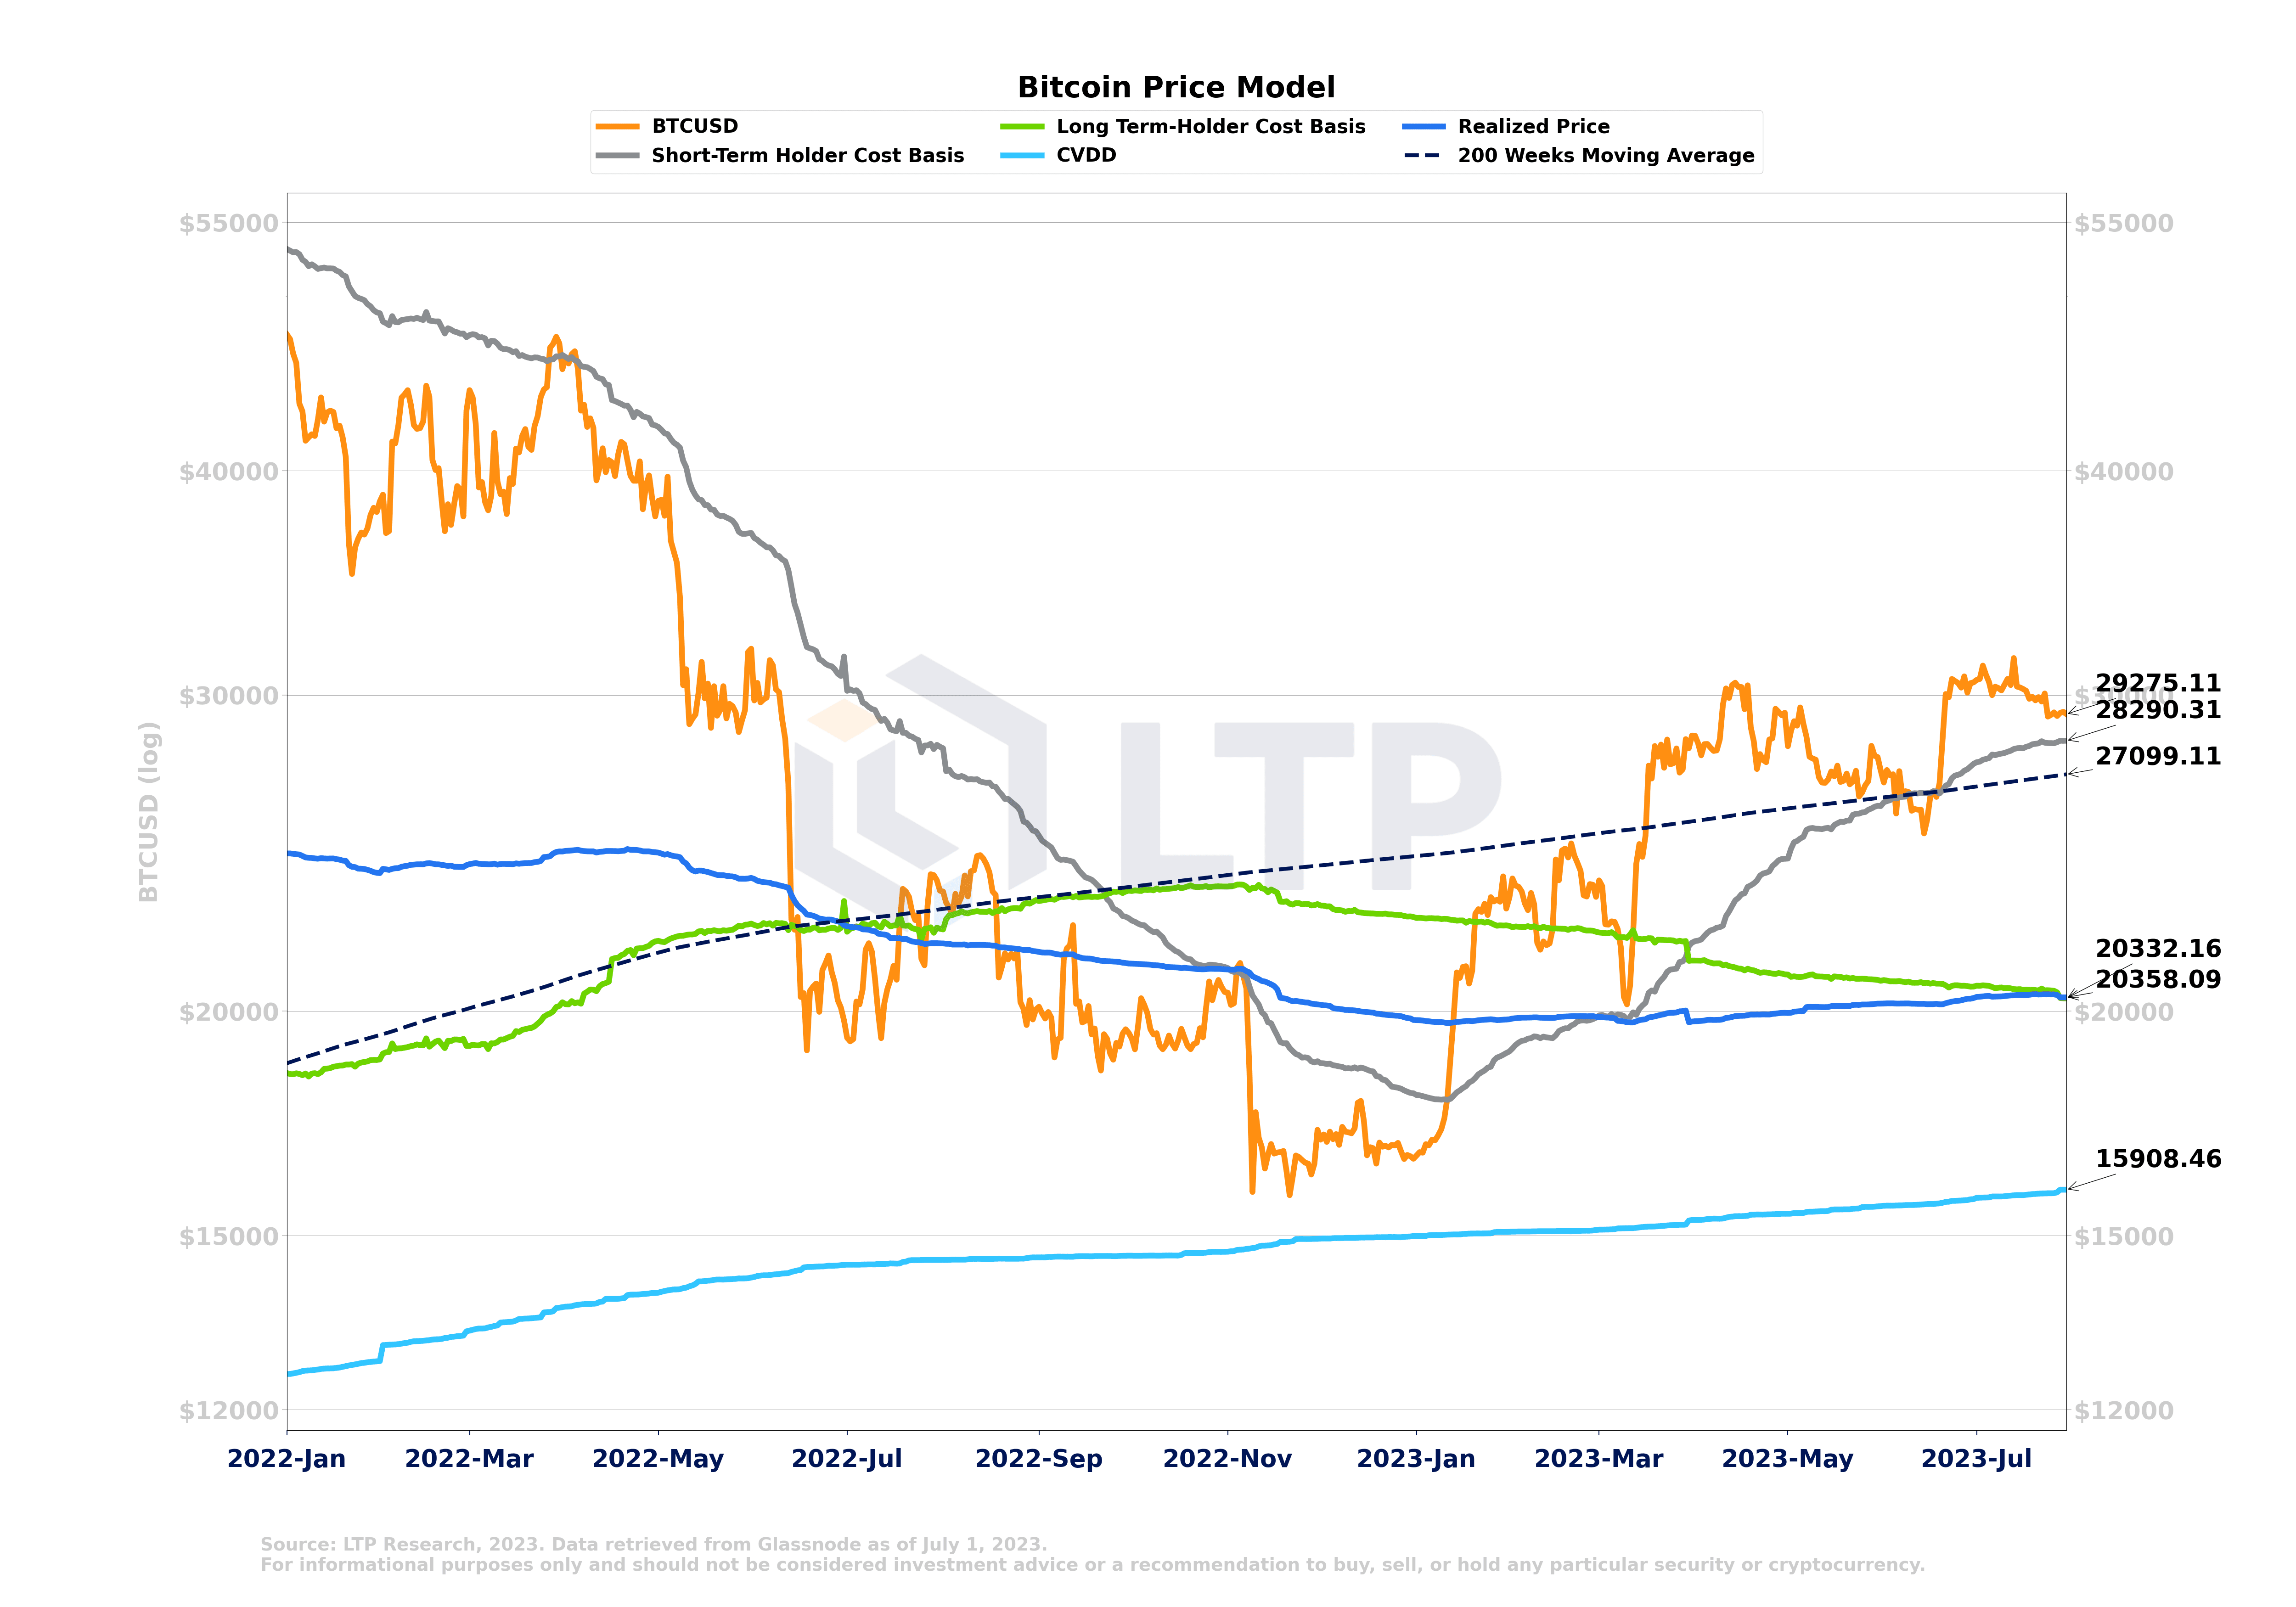
In July, Bitcoin price was consolidating between the 200-week moving average and the short-term holders’ cost basis. The realized price and the long-term holders’ cost basis are at $20,300. Given the renewed strength of the US dollar index and the CME commercial institutions turning slightly net short, Bitcoin price may steadily recover to the short-term holders’ cost basis. It will be interesting to see whether trend-following investors will then add to their long positions.
2. 3 The total circulating supply of the top 4 stablecoins continues to decline, ETH pledge increases, and the stablecoin supply rate oscillator indicates that the current Bitcoin price is in the middle range
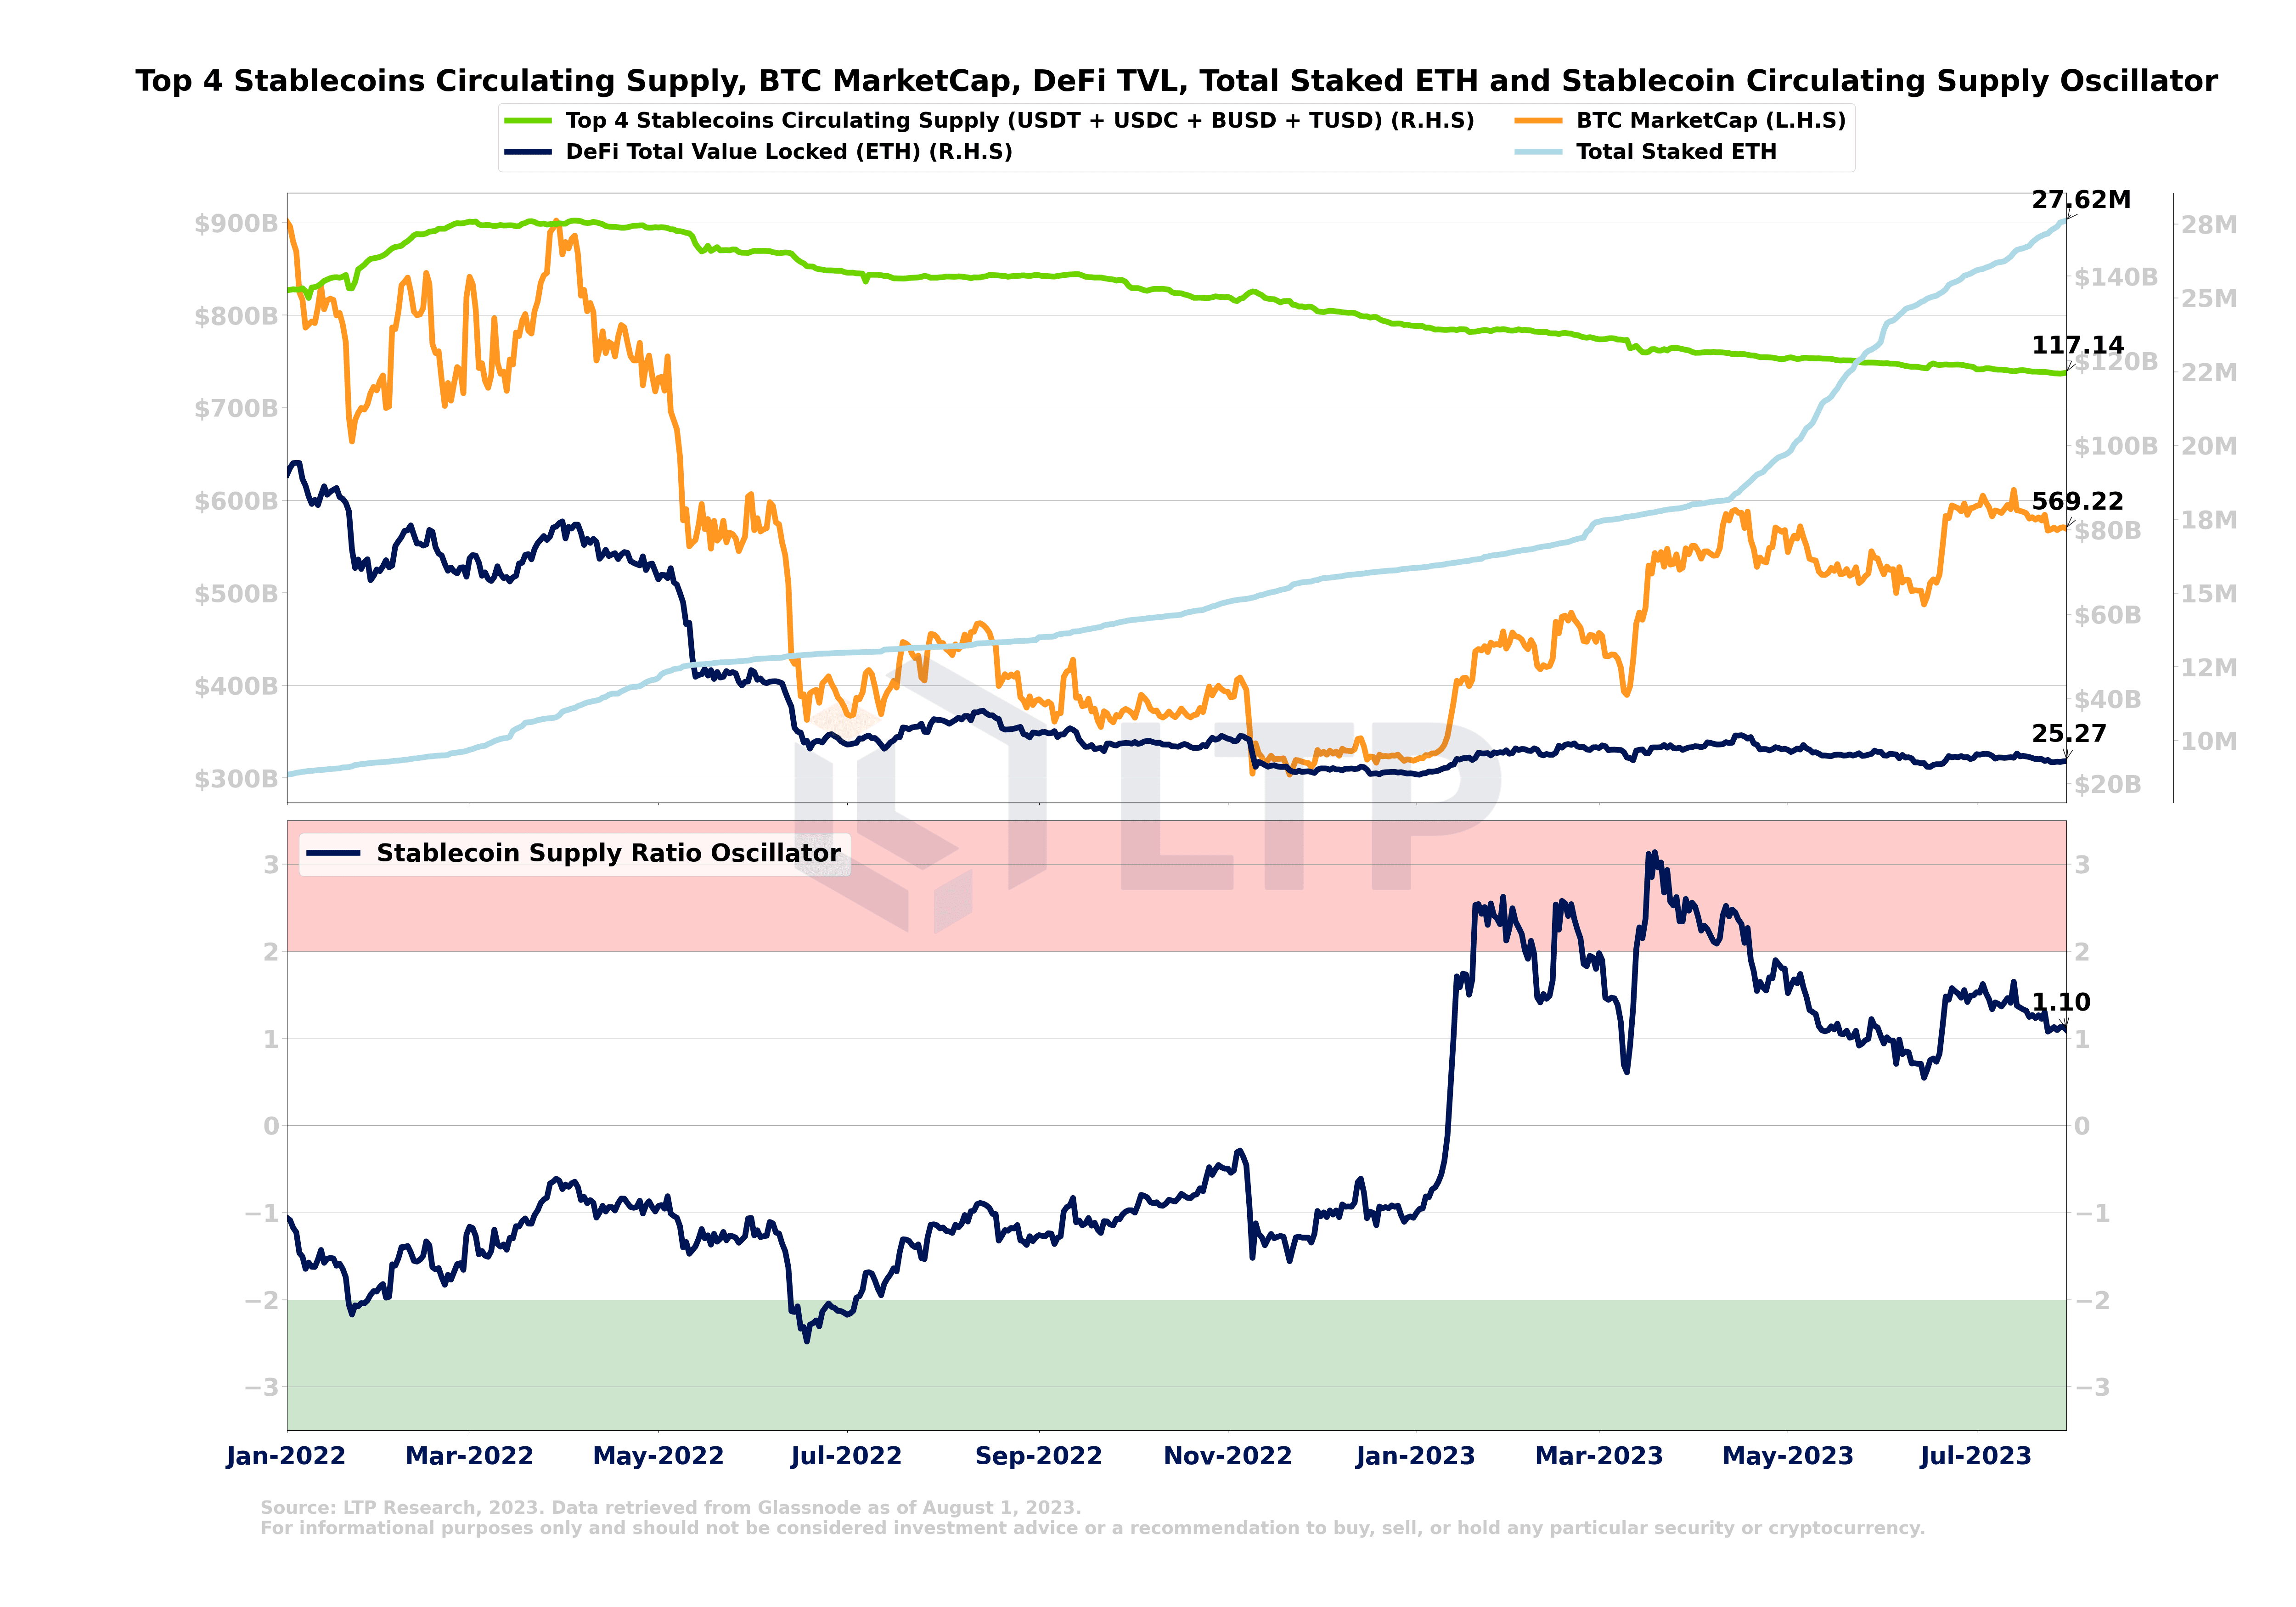
The Stablecoin Supply Ratio Oscillator is in the mid-range in July, indicating no overbought or oversold conditions. The total circulating supply of the top 4 stablecoins continues to decline, reaching $117 billion by the end of July. This downward trend indicates a weakening of capital inflows and purchasing power of cryptocurrencies.
Meanwhile, the total value locked in decentralized finance (ETH chain) remains relatively stagnant, lagging behind the market expansion of Bitcoin and Ethereum. In addition, the total staked ETH continues to rise, reaching a peak of 27.62 million ETH at the end of July. This performance difference may indicate that investors are turning to more mature cryptocurrencies such as Bitcoin and Ethereum.
2.4 Cryptocurrency exchange trading volume declined in July
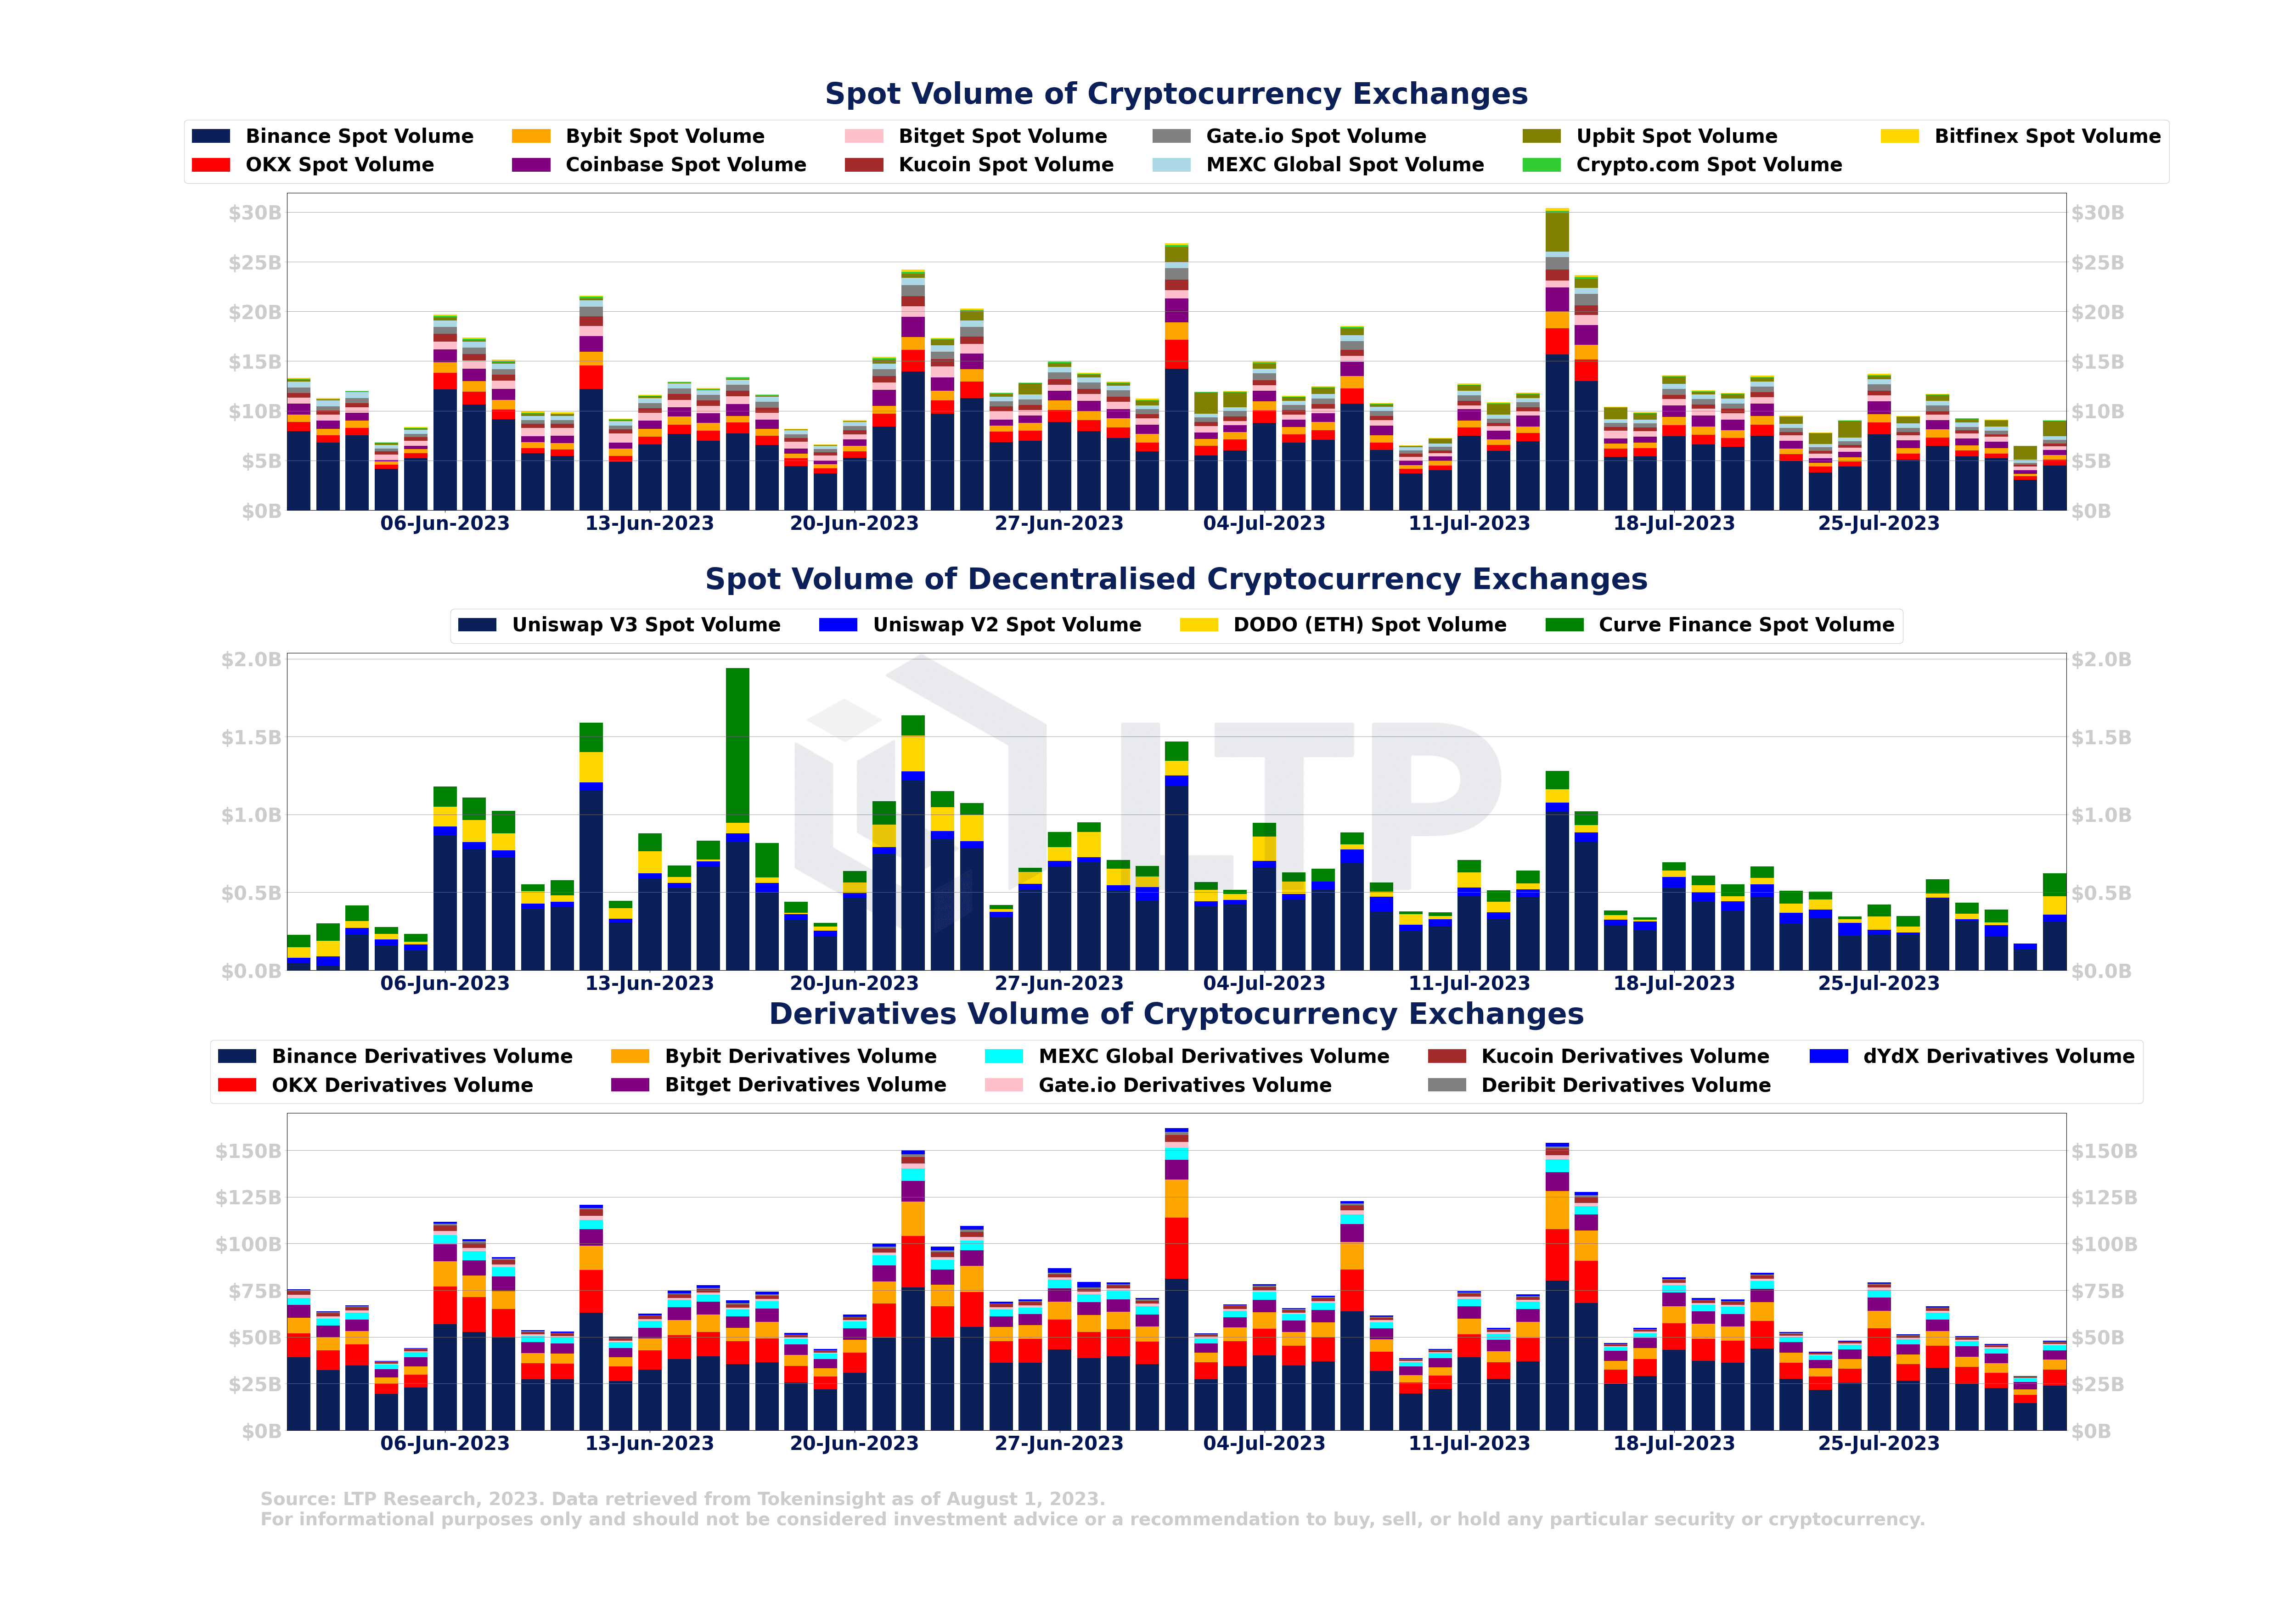
Trading volumes on major cryptocurrency exchanges declined in July compared to June. This downward trend can be attributed to the absence of high-impact news events in July following the increase in market activity in June.
However, it is worth noting that on July 13, the ruling in the lawsuit between Ripple and the Securities and Exchange Commission (SEC) injected optimism into the market. However, in the second half of July, trading volumes declined due to a lack of industry news.
2.5 The relative trading volume of major cryptocurrencies fell in July, falling below the 90-day average benchmark
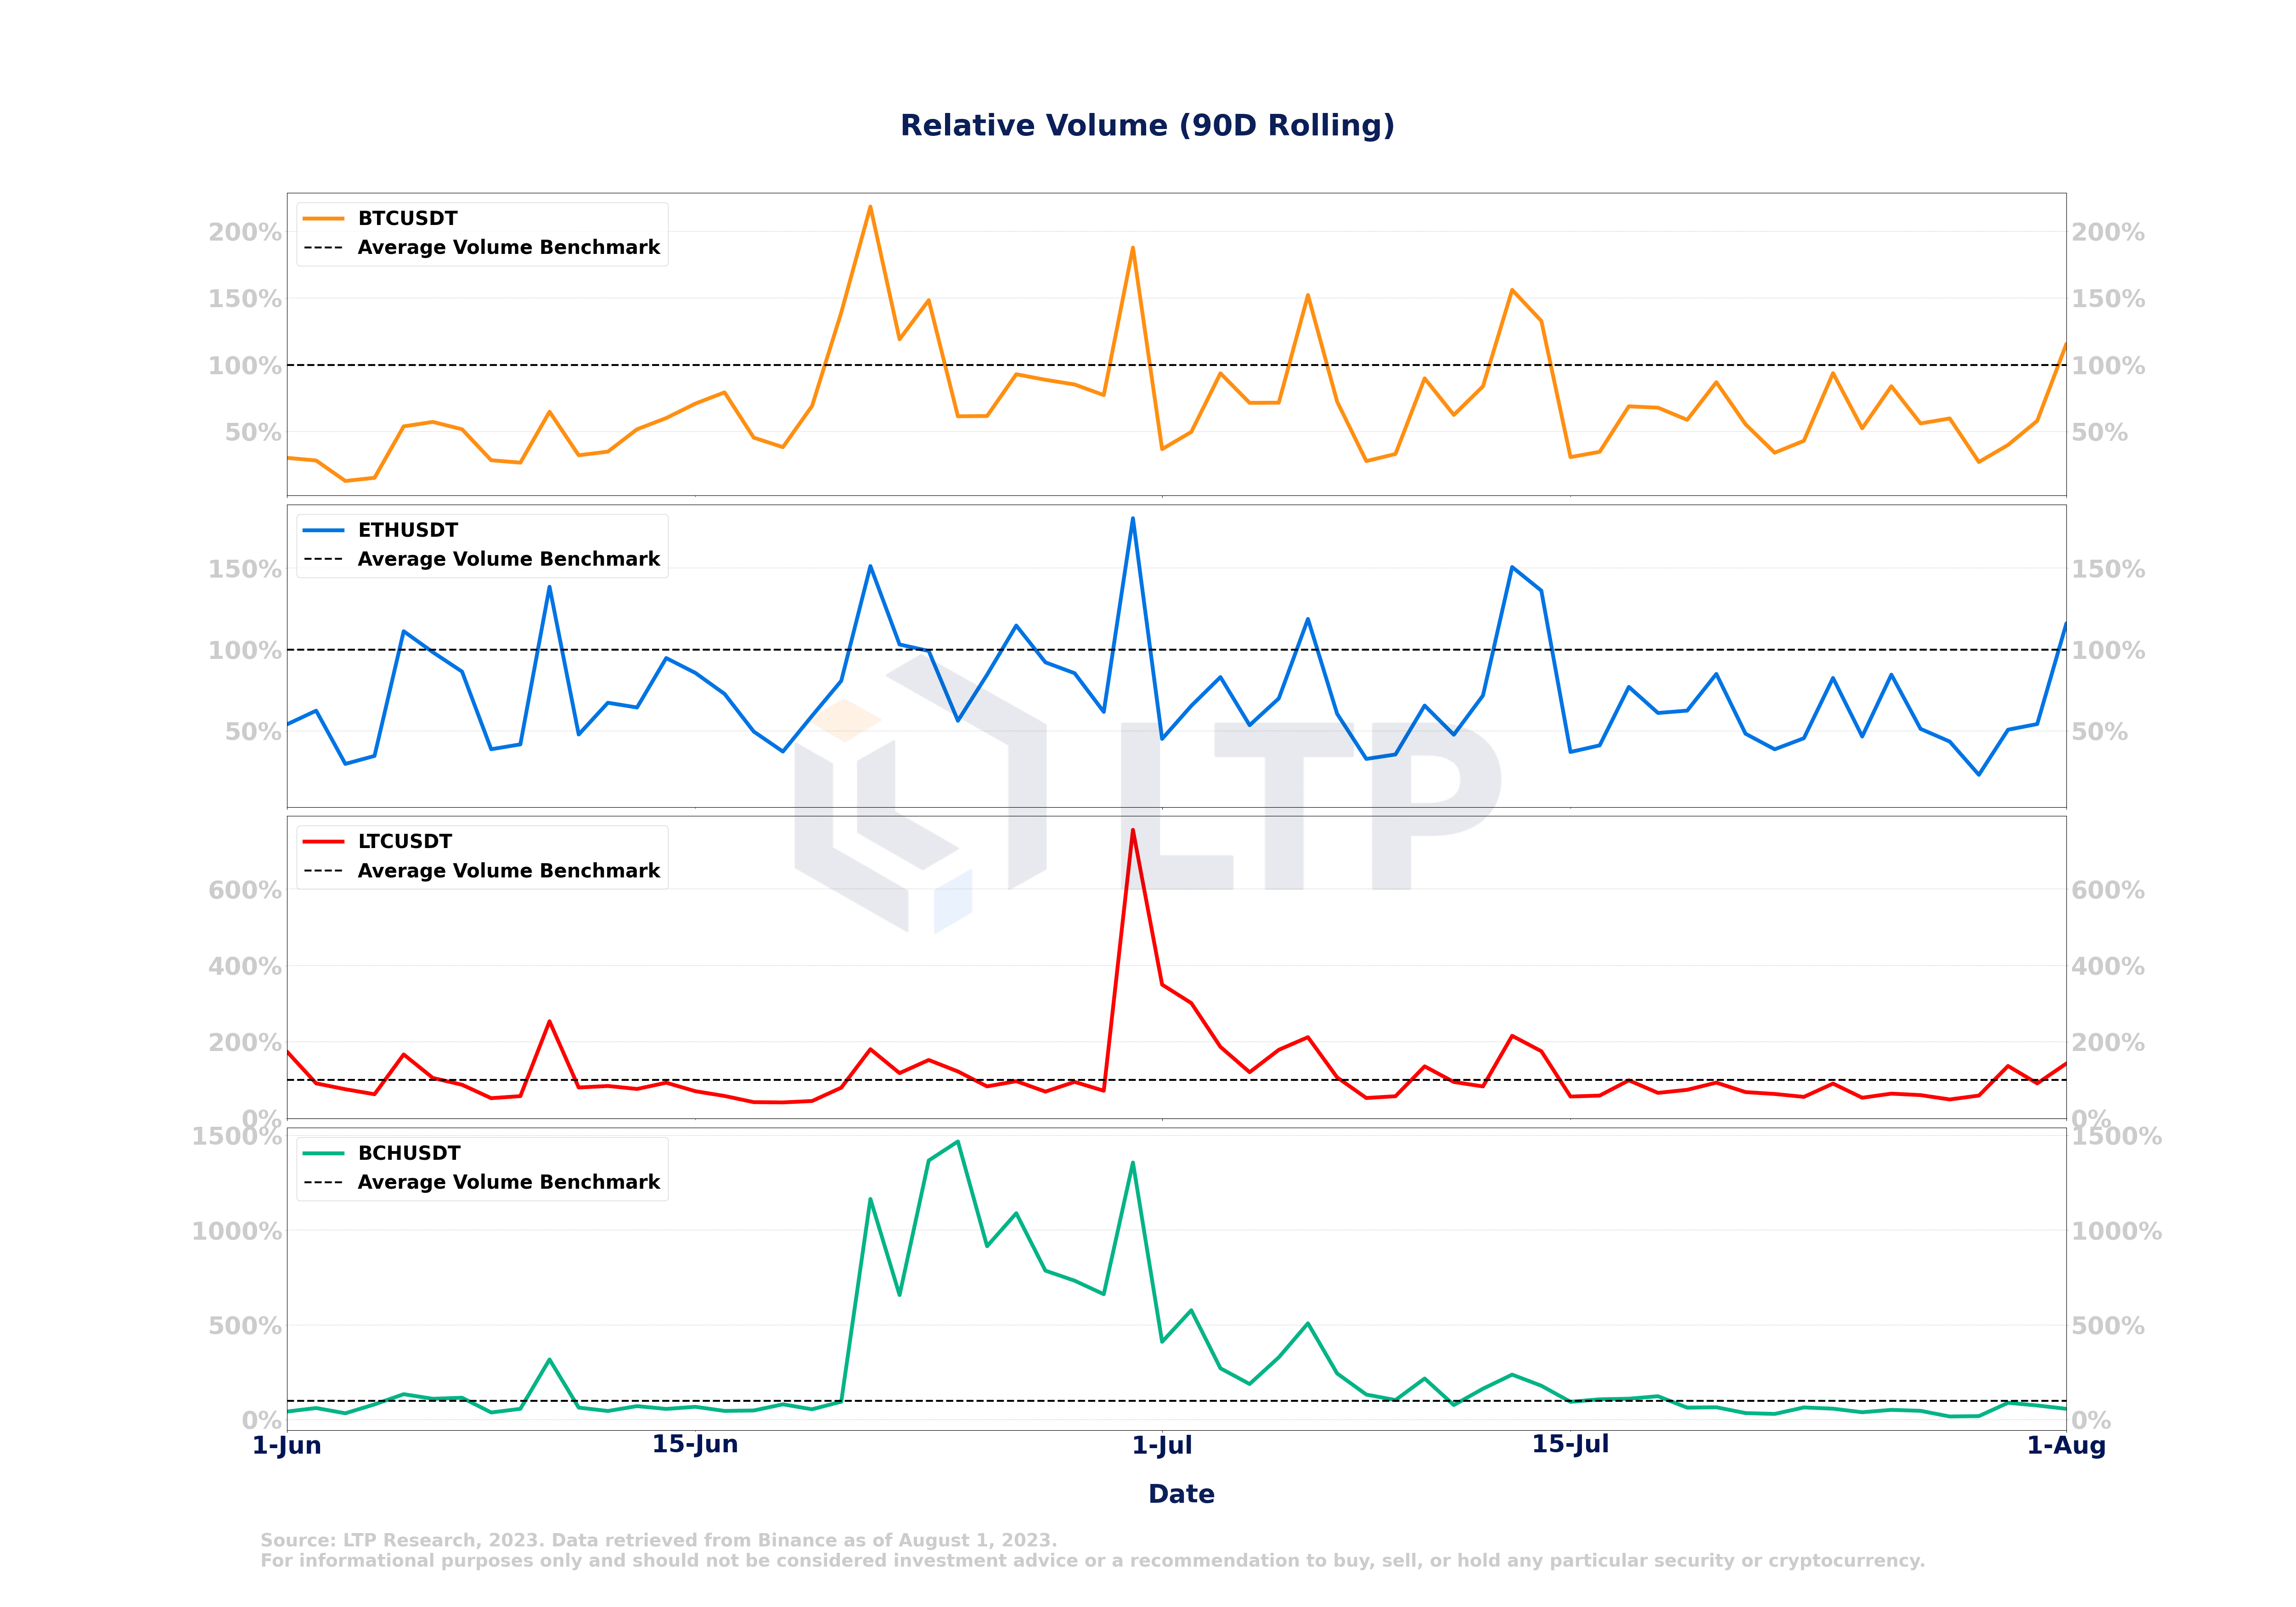
Relative volumes for Bitcoin, Ethereum, Litecoin, and Bitcoin Cash declined, falling below their 90-day average benchmarks.
2.6 Annualized volatility of major cryptocurrencies declined in July
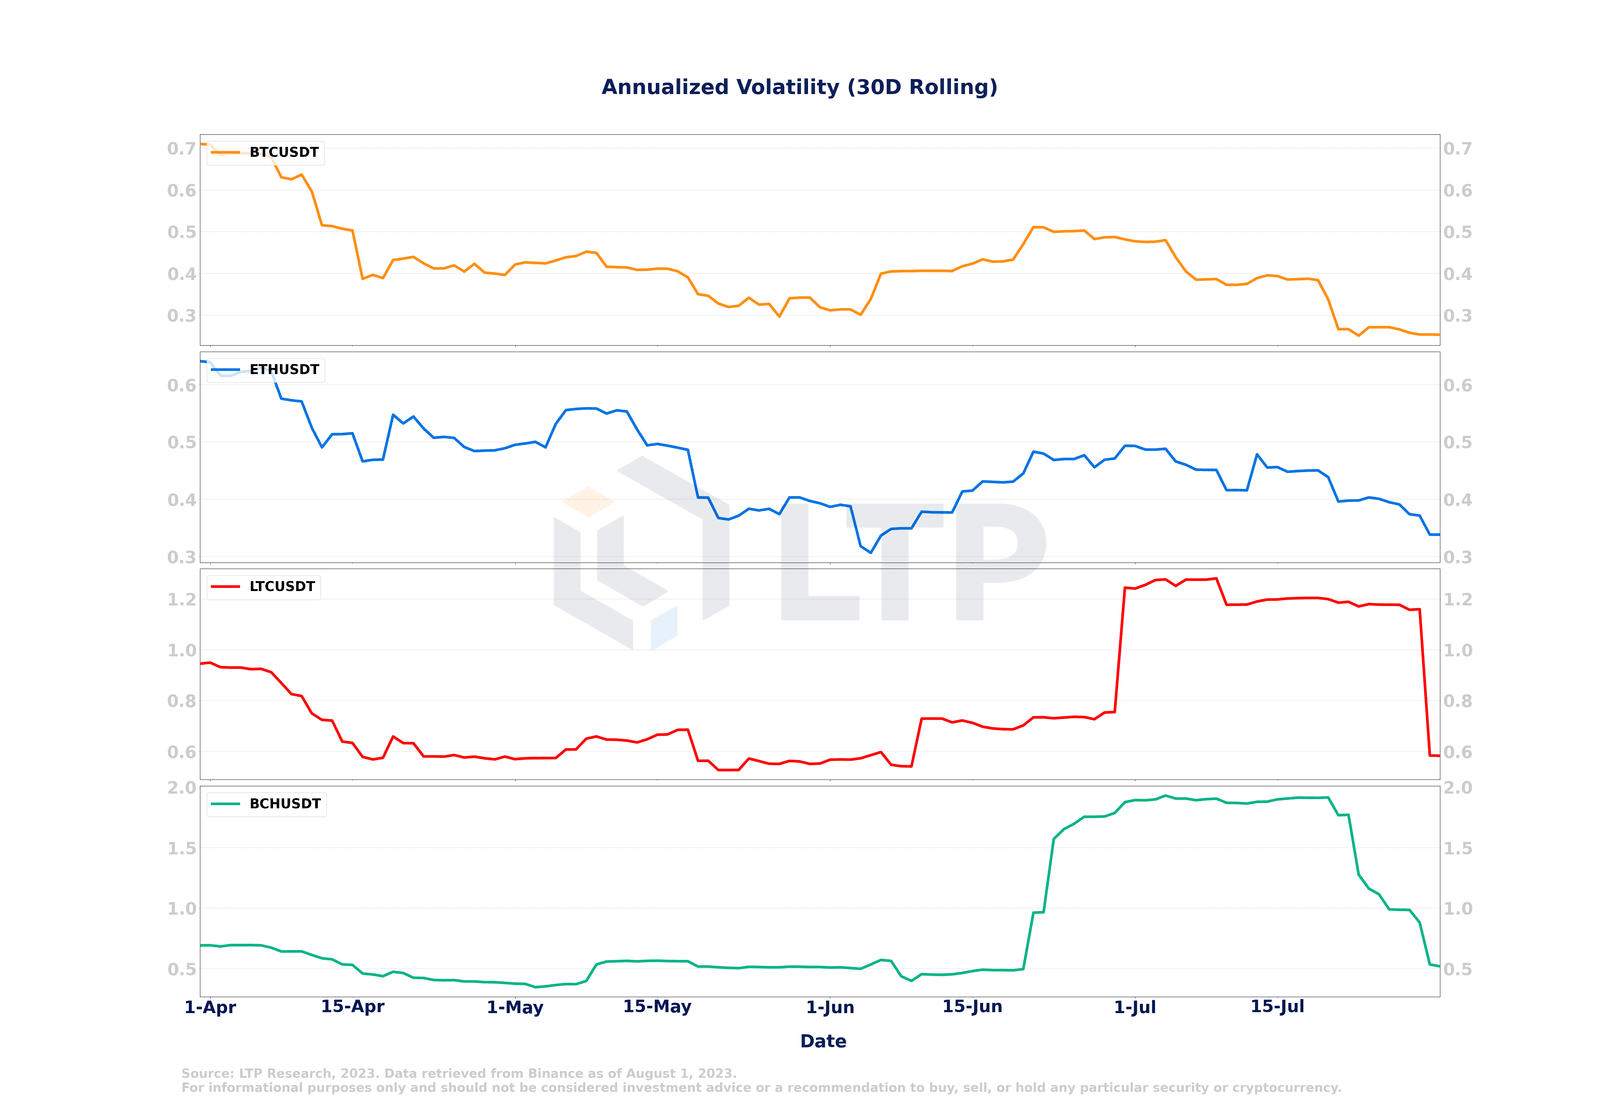
Annualized volatility for Bitcoin, Ethereum, Litecoin, and Bitcoin Cash has all declined. Bitcoin’s annualized volatility has fallen below Q2 levels, further indicating a slowing market.
2.7 Transaction Flow
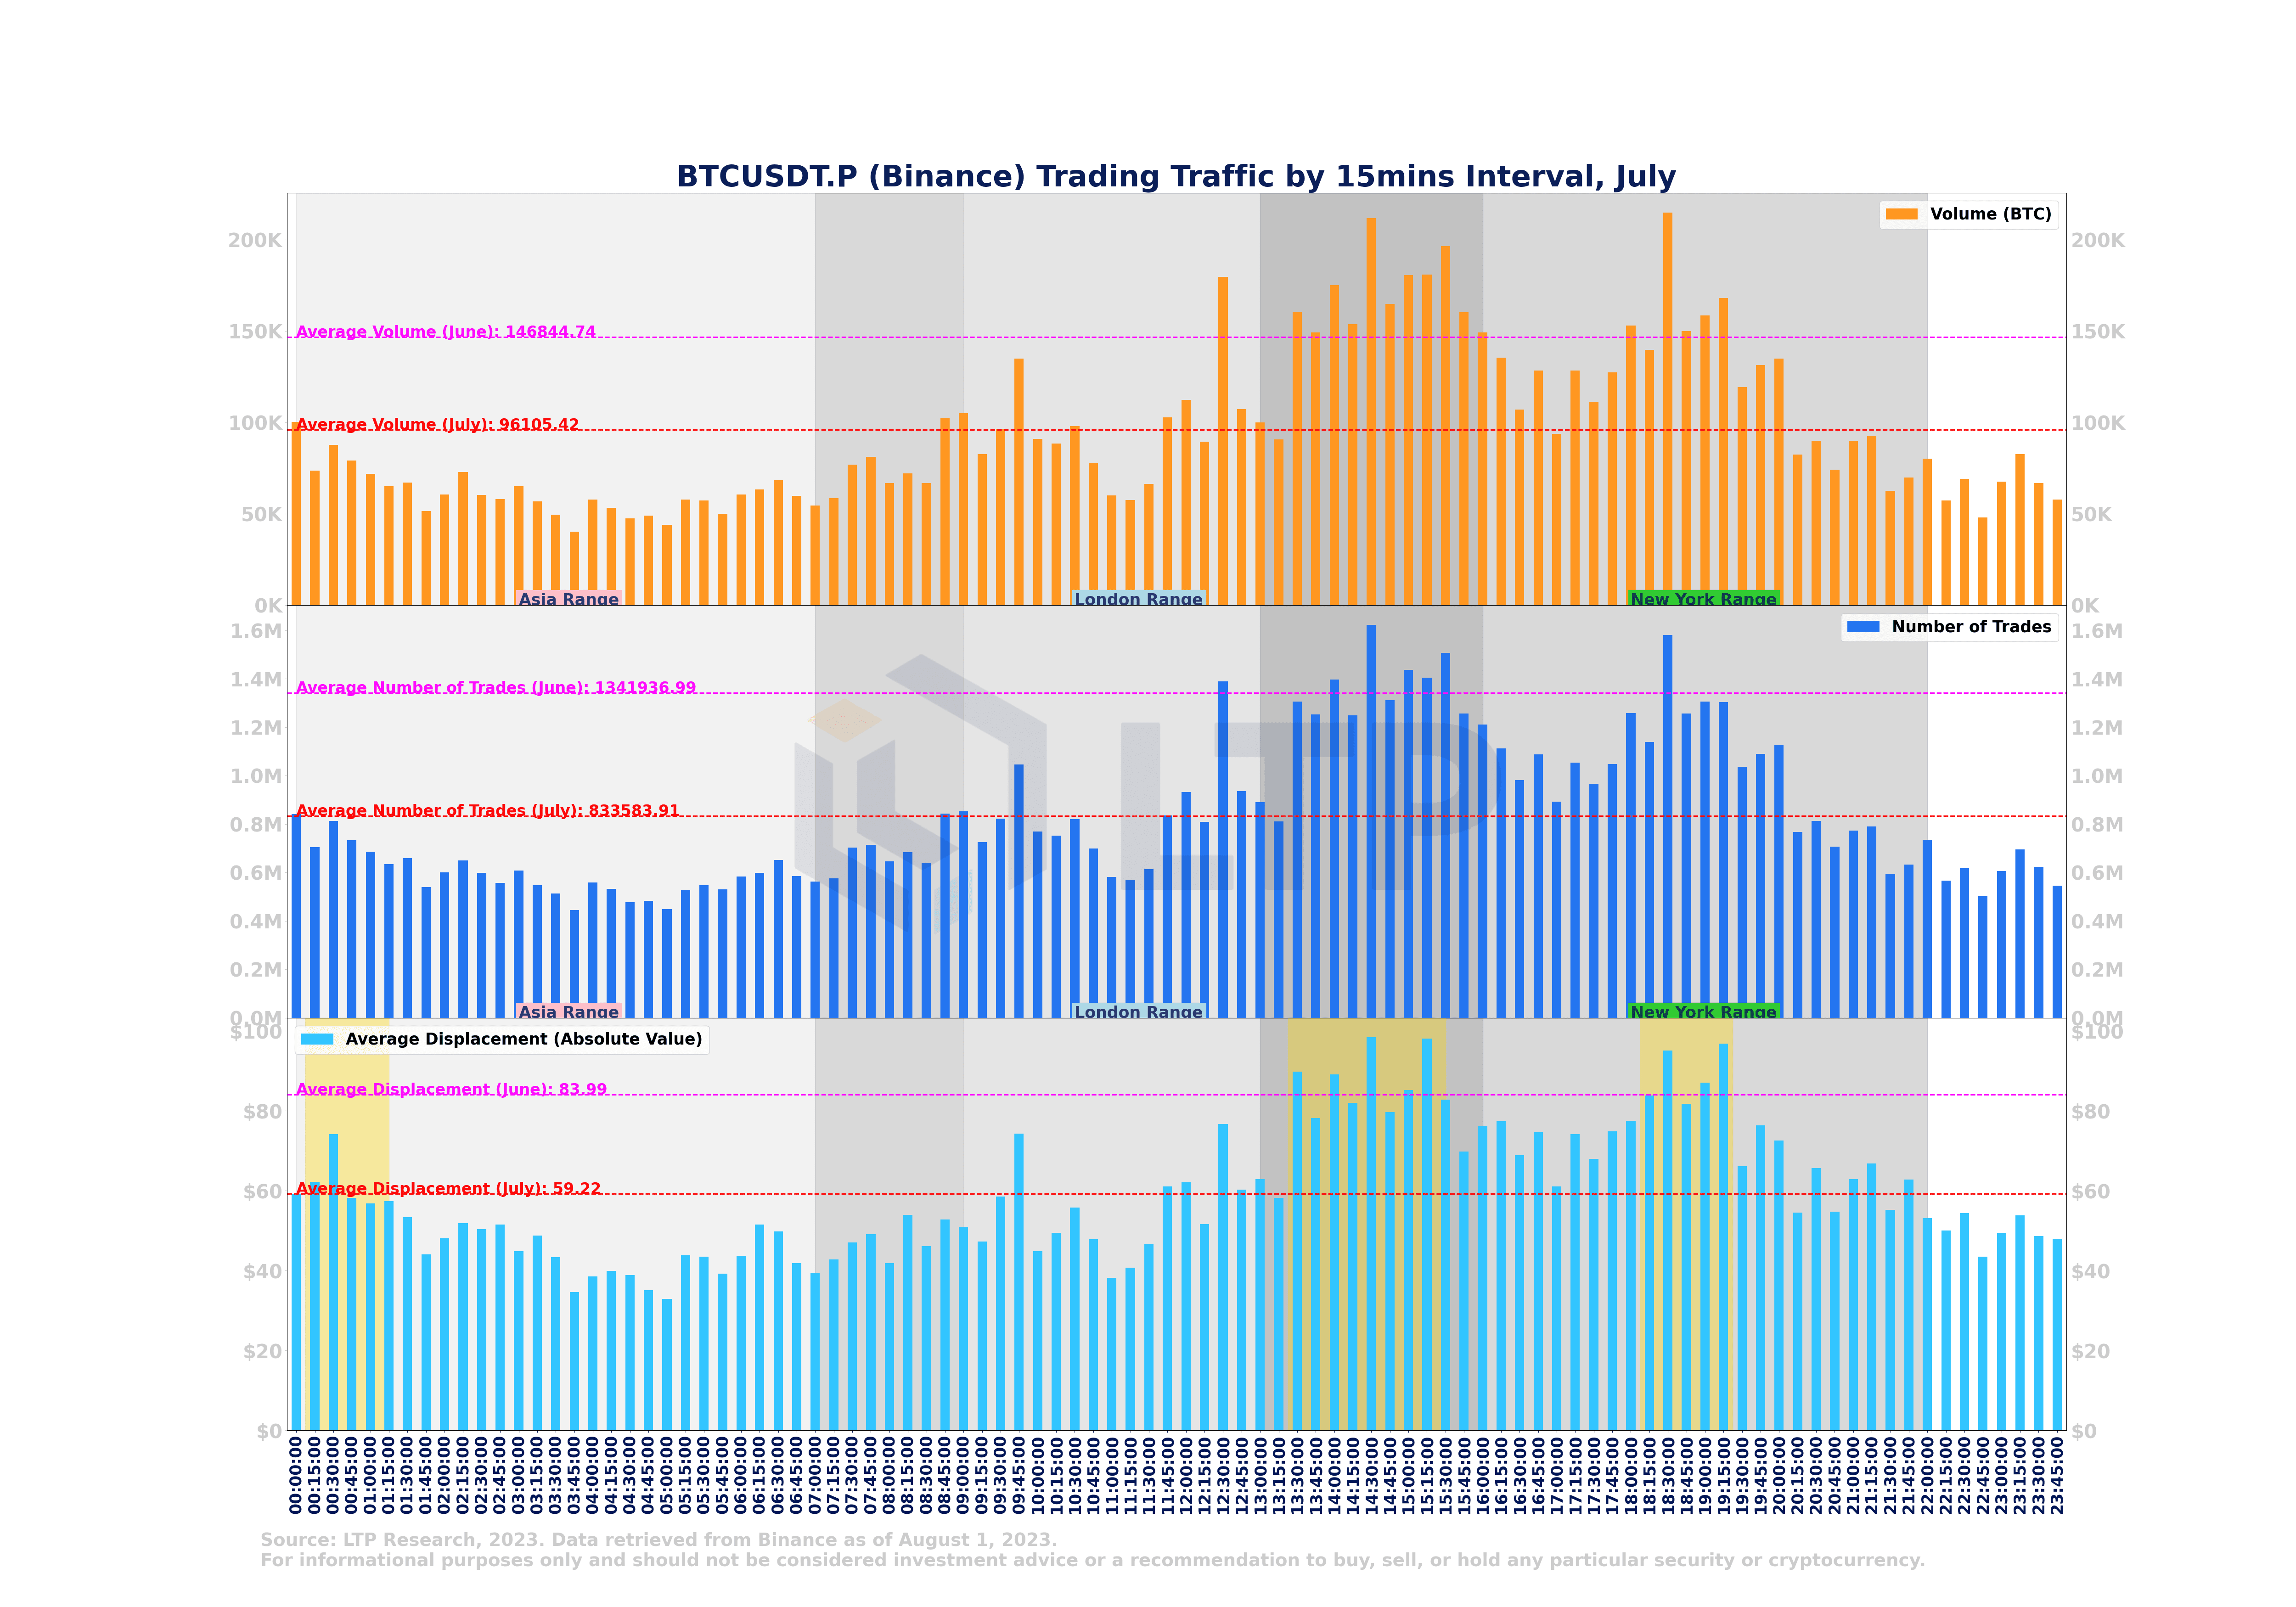
Trading activity in July decreased compared to June, with the average volume of transactions per 15-minute interval (monthly total) at 94,523 BTC, down from 146,845 BTC in June. The average number of transactions per 15-minute interval (monthly total) also decreased, from 1,341,937 in June to 819,965 in July. In addition, the average displacement per 15-minute interval decreased from $84 to $60, indicating lower volatility.
The most active trading occurs during two sessions: 13:30-15:30 (UTC) between the London close and New York open, and 18:15-19:15 (UTC) in the middle of the New York trading session.
2.8 Bitcoin transaction volume distribution chart shows that $28,000 is the volume control point in the second quarter
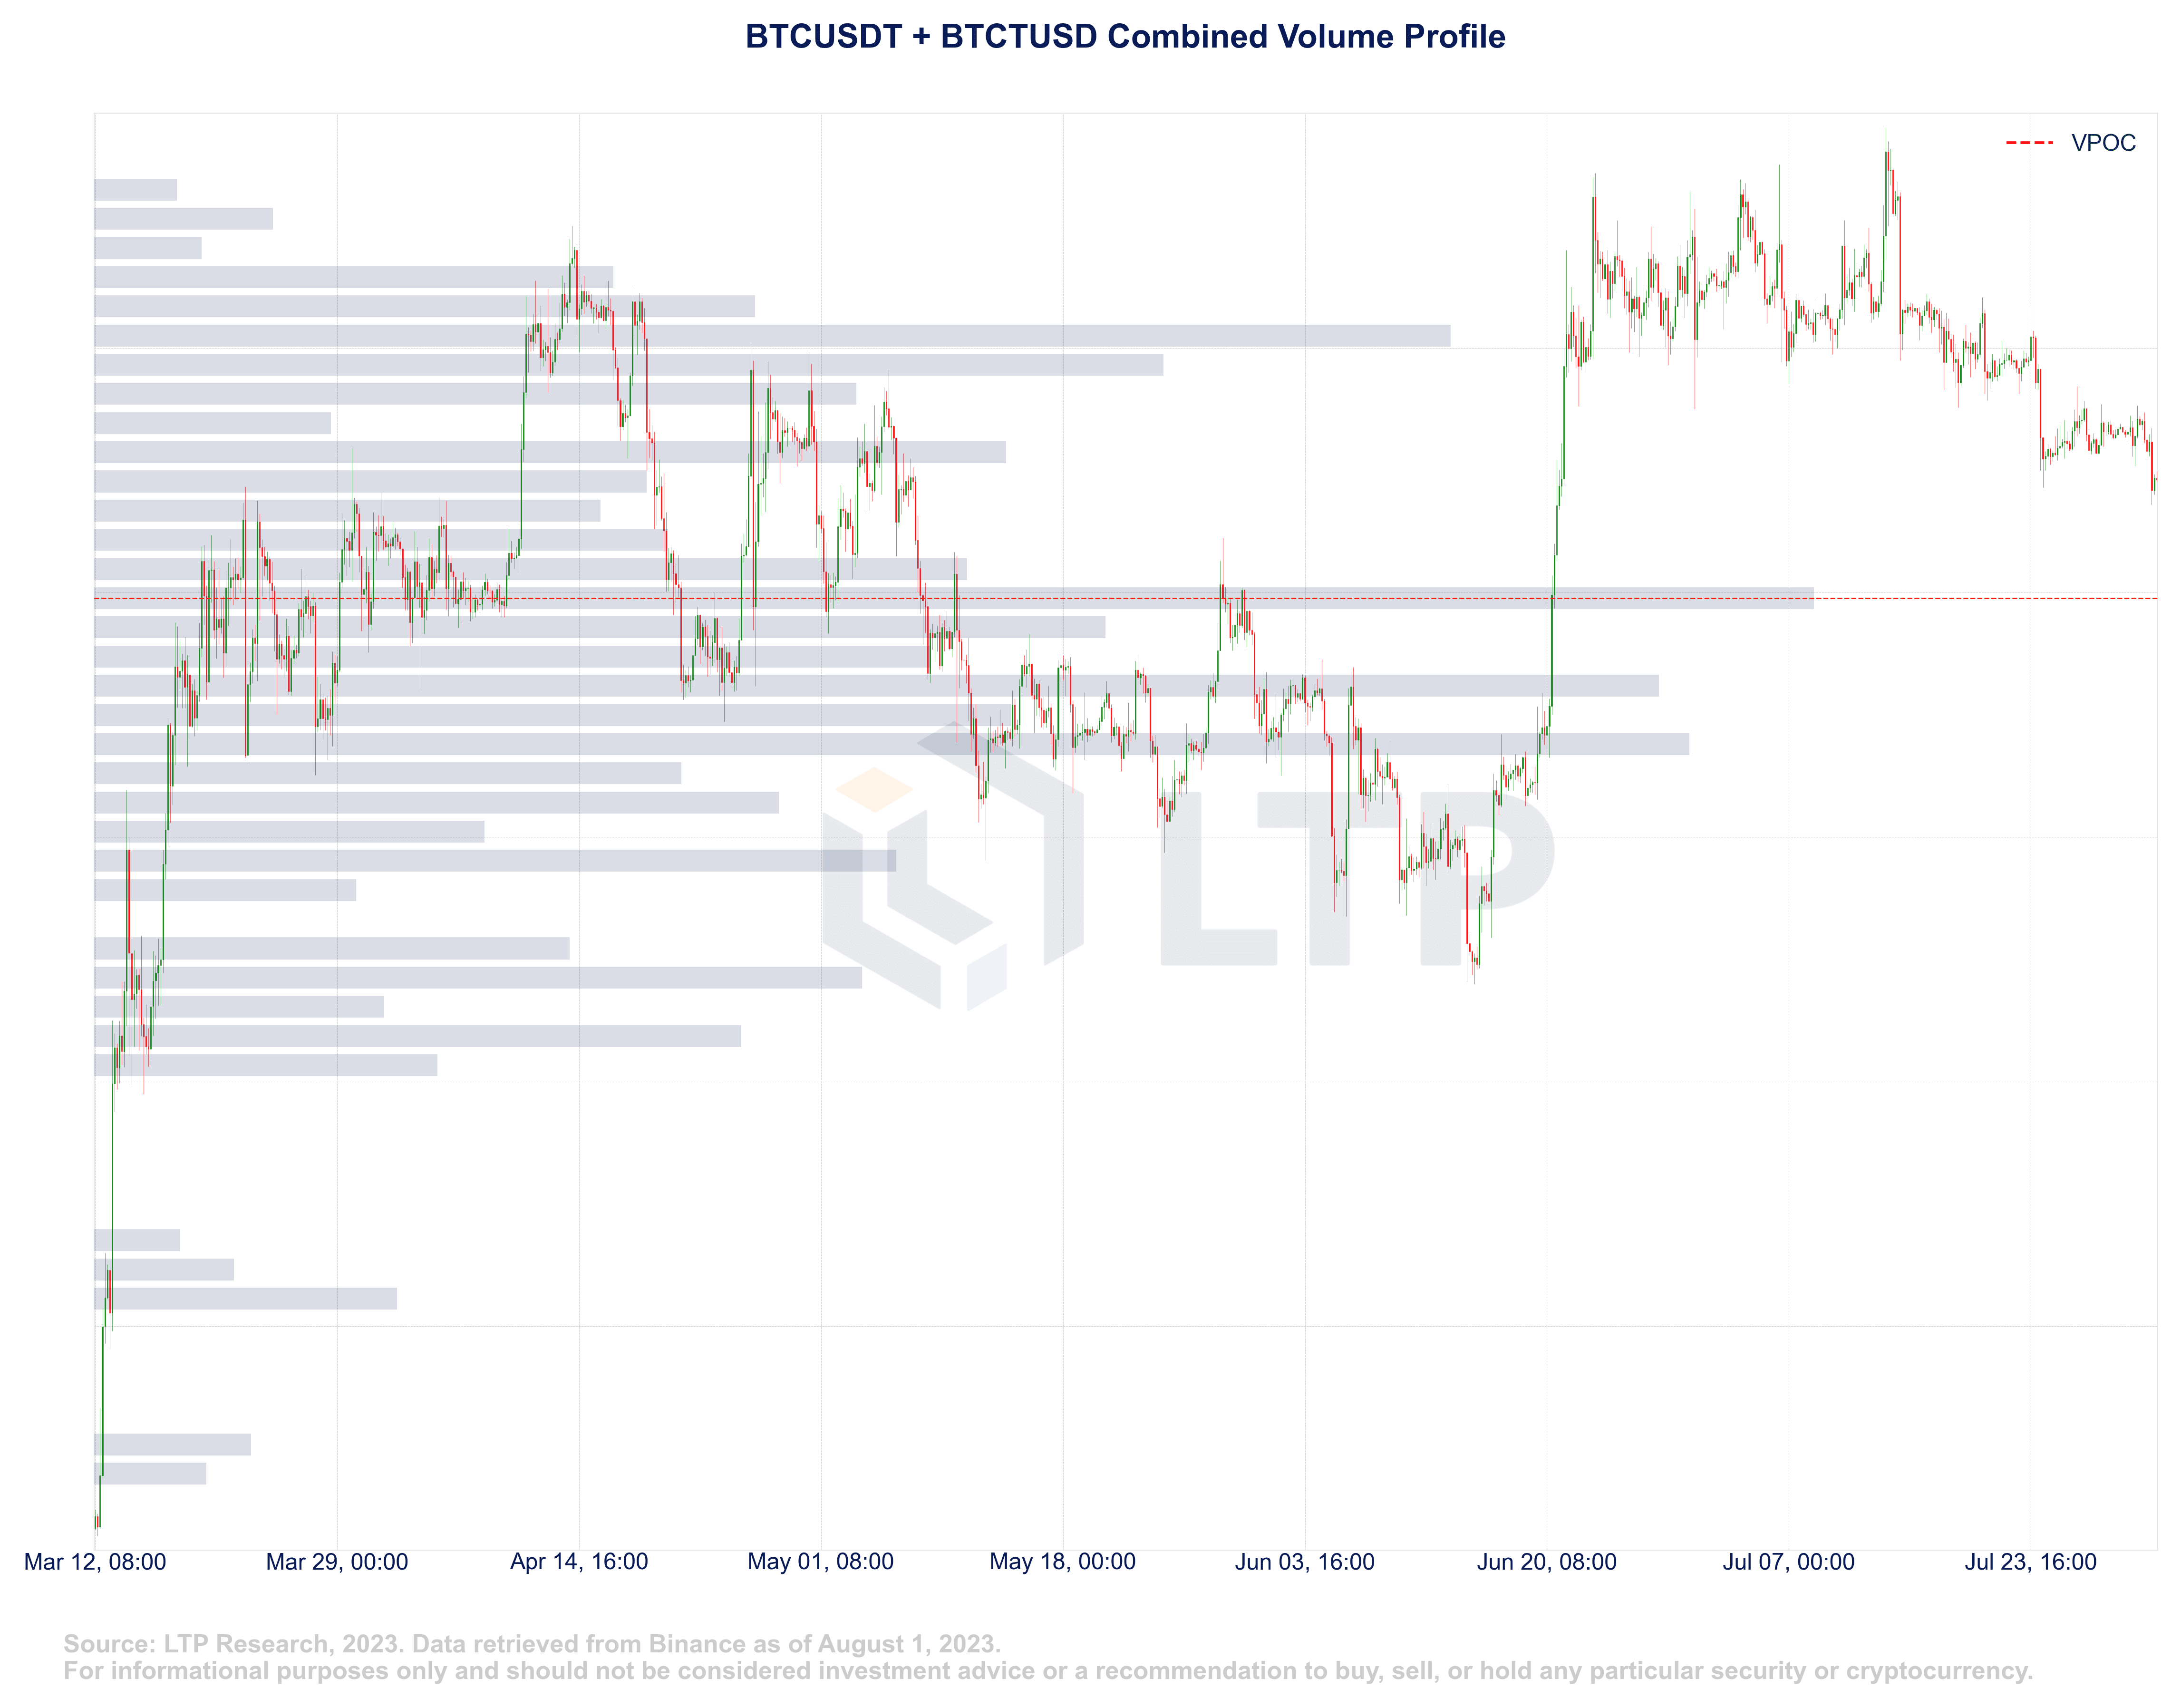
The Volume Point of Control (VPOC), represented by the red dotted line, indicates the price level with the highest volume during a specific period. The volume distribution chart shows two areas of note: 1) the $28,000 level, and 2) the level currently centered at $30,250. The VPOC for Q2 2023 is $28,000, and a large number of market participants are willing to trade at this price level.
2.9 BTCTUSD trading volume exceeds BTCUSDT and maintains premium over BTCUSDT (Binance Spot)
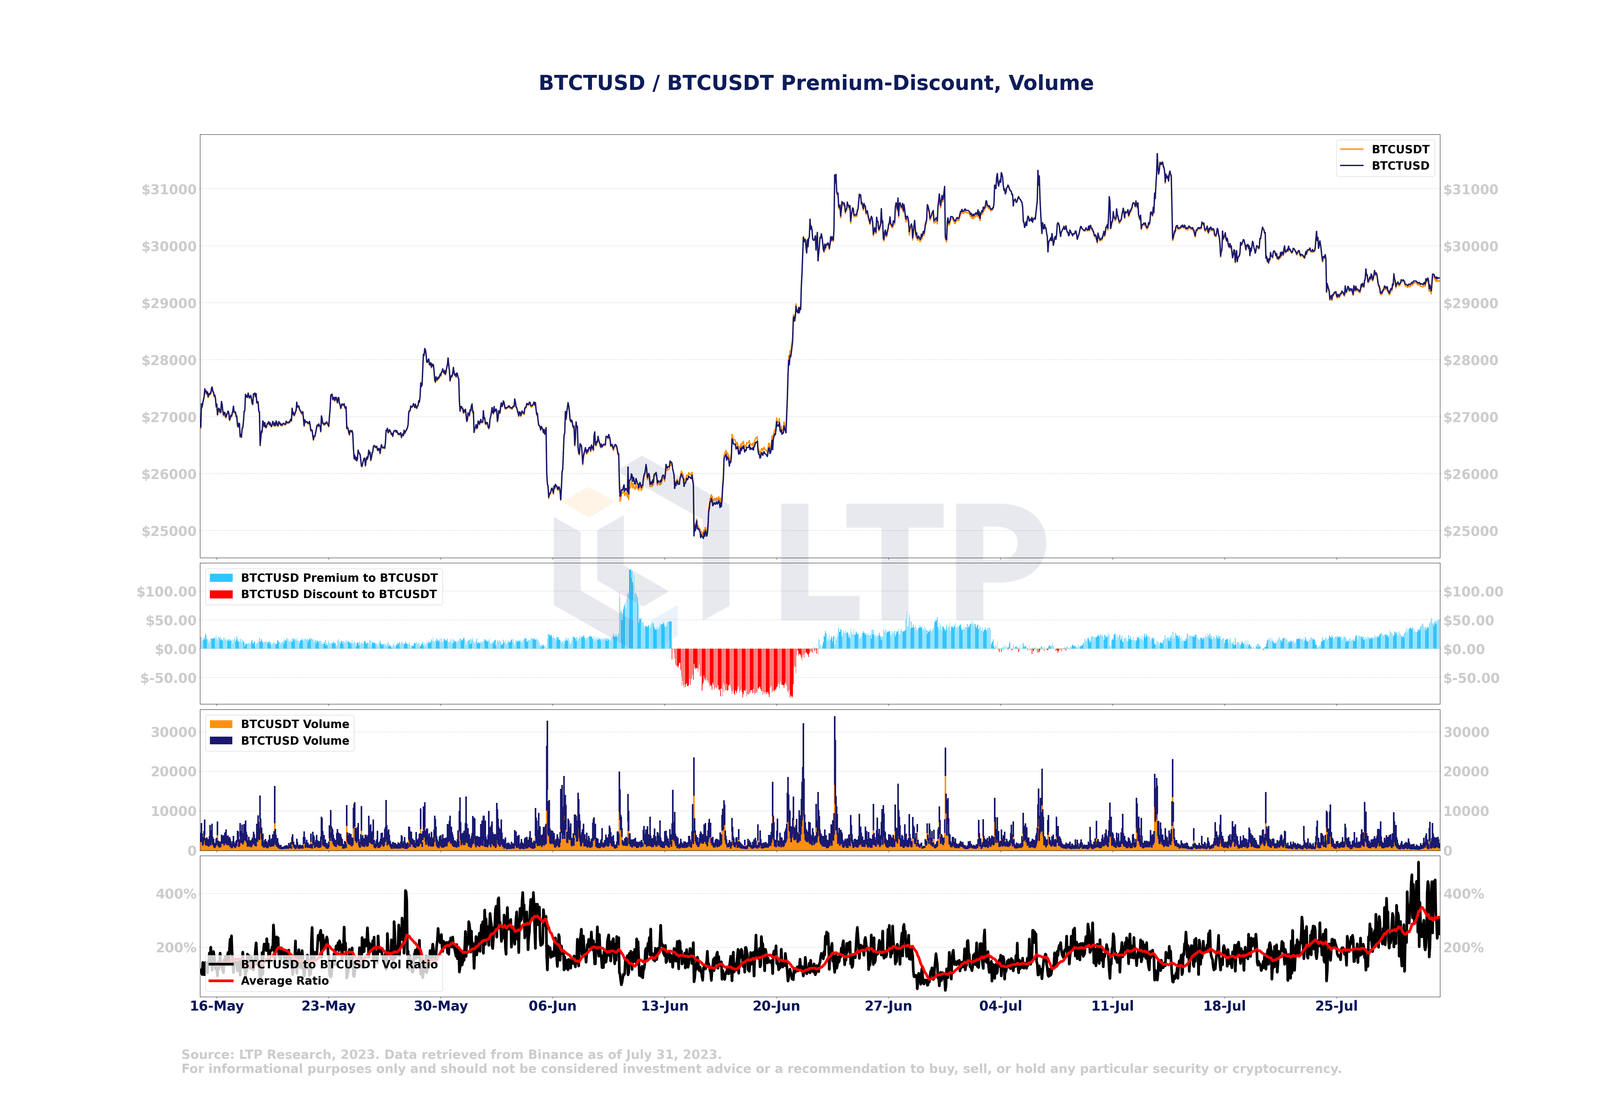
The price of Bitcoin (BTC) for the BTCTUSD pair continued to trade at a higher price than the BTCUSDT pair in July. In addition, the trading volume of BTCTUSD increased significantly at the end of July. Notably, the trading volume of BTCTUSD exceeded 5 times that of BTCUSDT at its peak. Since Binance launched a zero-fee promotion for the BTCTUSD pair in March, traders have migrated from trading the BTCUSDT pair to the BTCTUSD pair, enhancing the liquidity of the latter.
2.10 ETHTUSD’s trading volume is significantly smaller than ETHUSDT, despite maintaining a premium (Binance Spot)
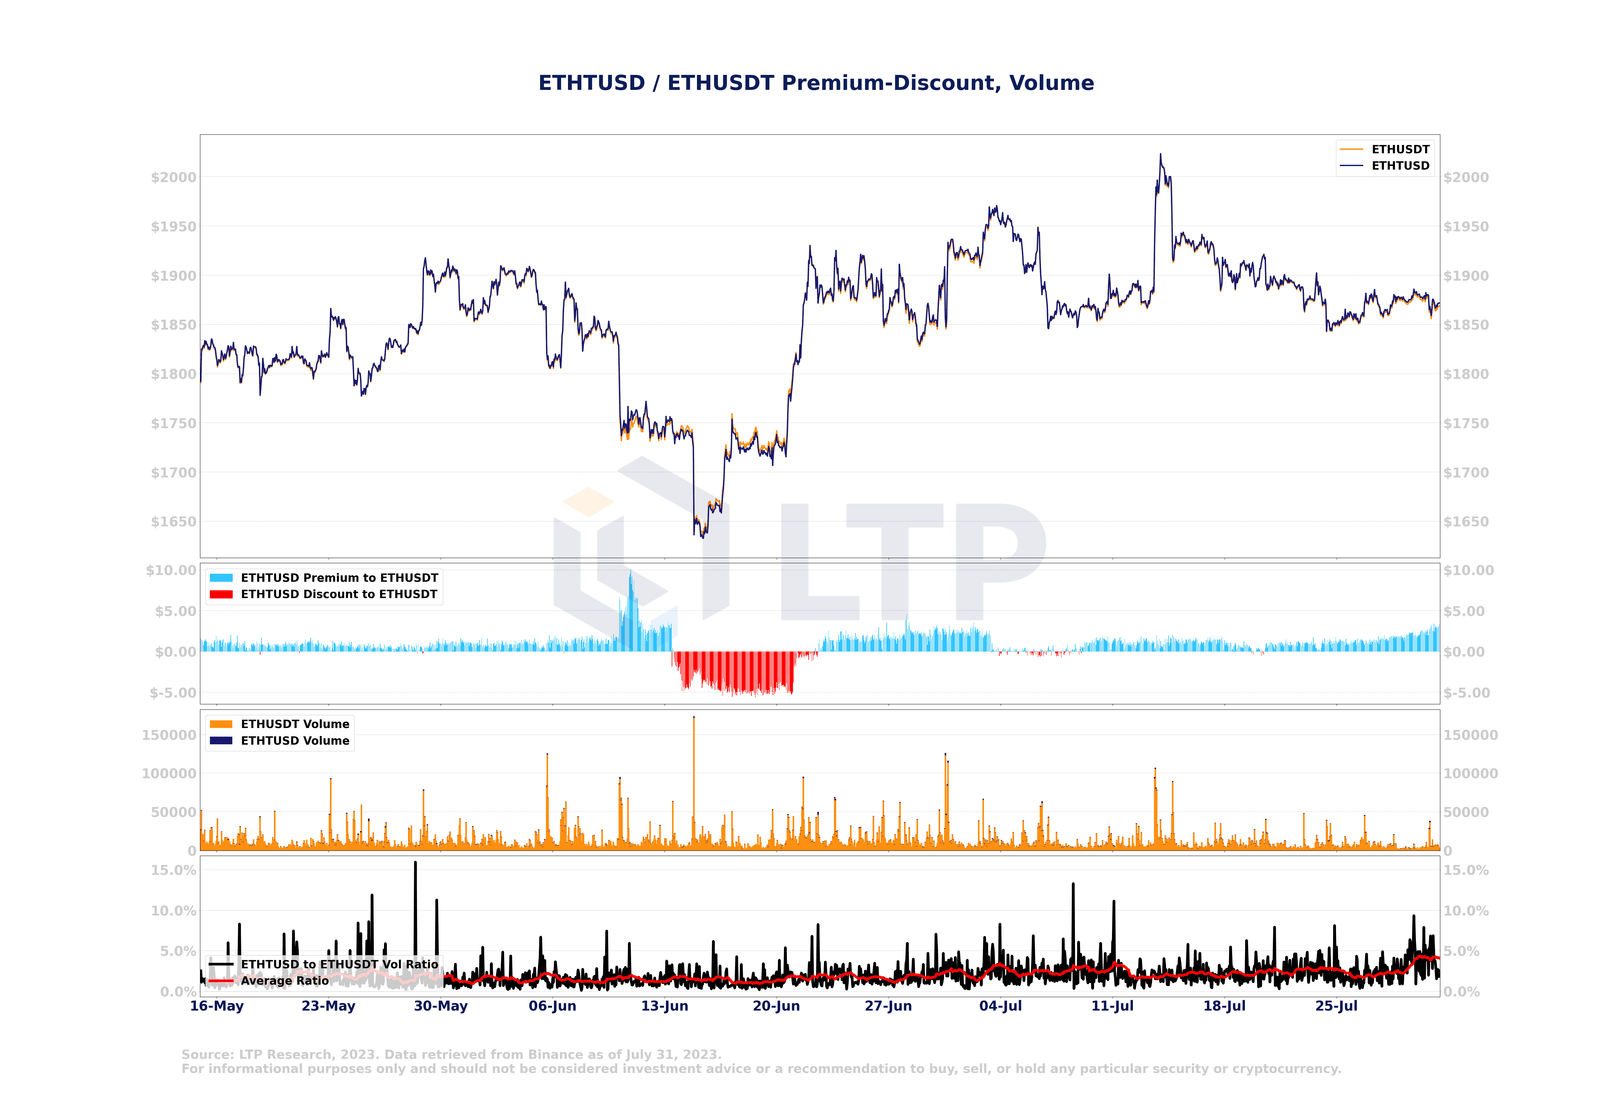
The Ethereum (ETH) price for the ETHTUSD pair remains higher than the ETHUSDT pair. However, ETHTUSD’s trading volume as a percentage of total ETHUSDT trading volume is significantly lower at less than 5%, as the ETHTUSD pair does not have a zero-fee promotion on Binance. This is in stark contrast to the trading volume for the BTCTUSD pair BTCUSDT, which shows a much higher level of activity.
2.11 Bitcoin continues to maintain a close correlation with Ethereum
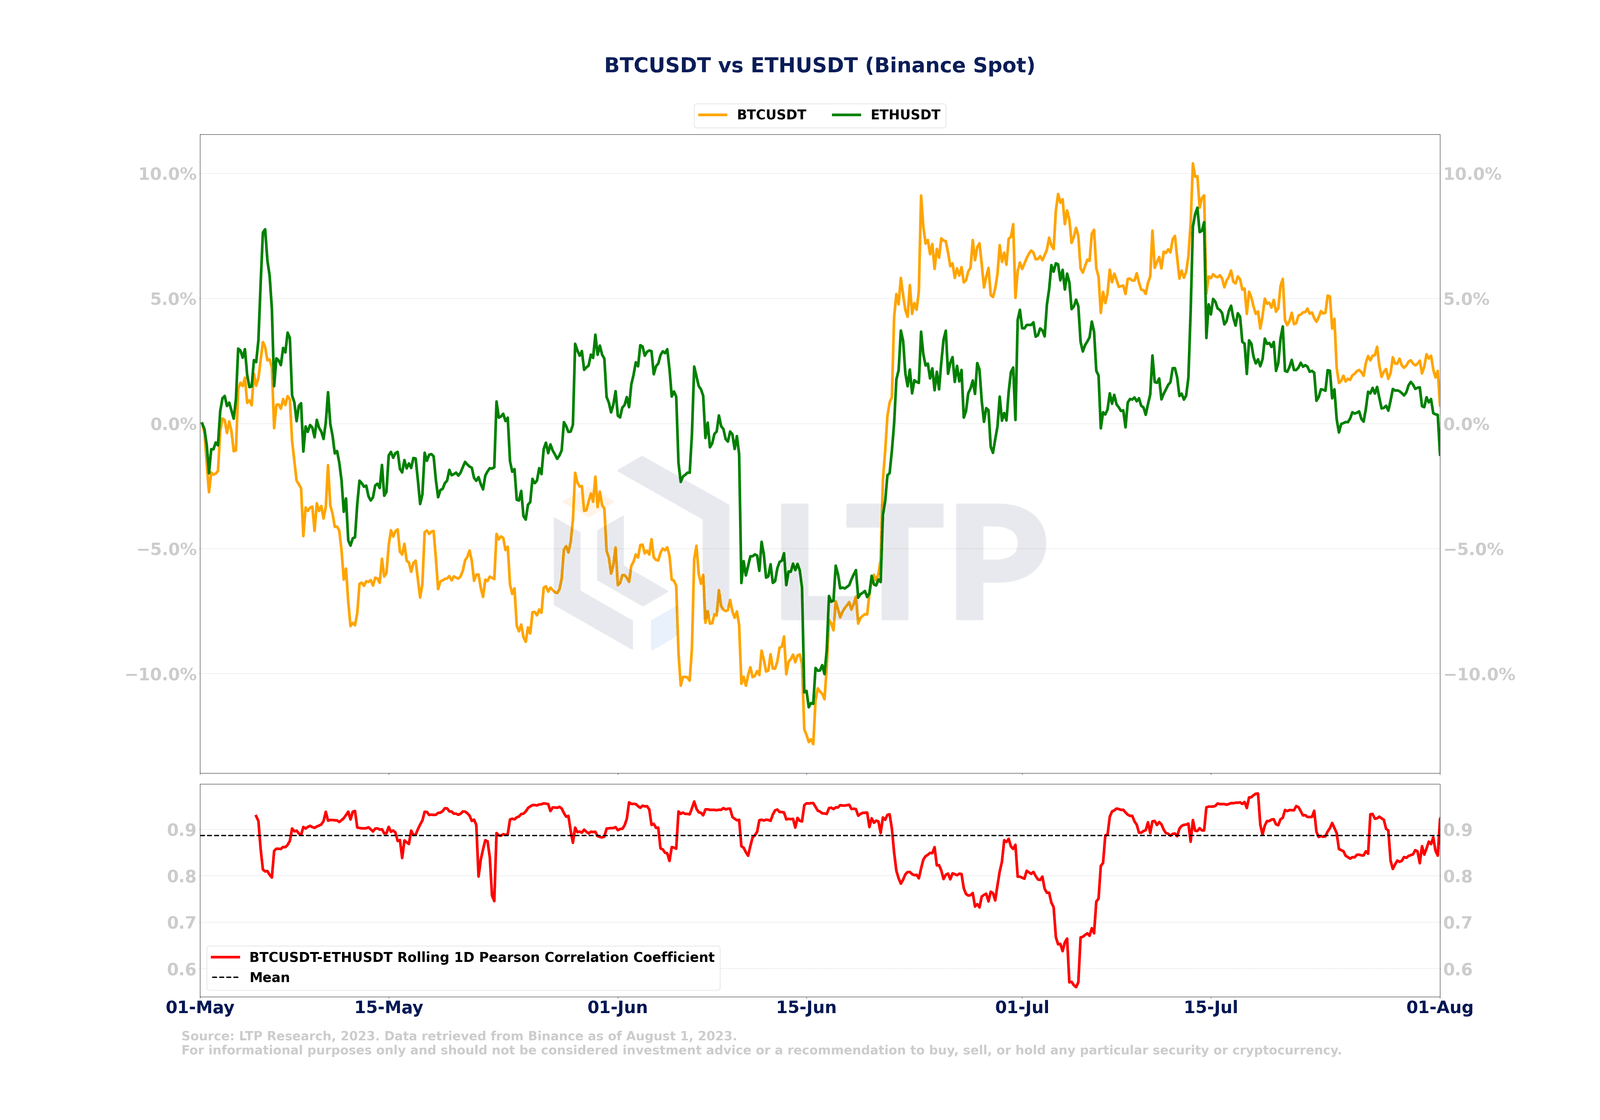
Bitcoin and Ethereum have been moving in parallel, with a Pearson correlation of 0.9 on daily returns. However, there was a temporary deviation in the correlation between Bitcoin and Ethereum in early July, mainly due to the positive industry news in June that mainly supported Bitcoin rather than Ethereum.
2.12 Litecoin volatility increased before the halving, but returned to being in line with Bitcoin’s price action
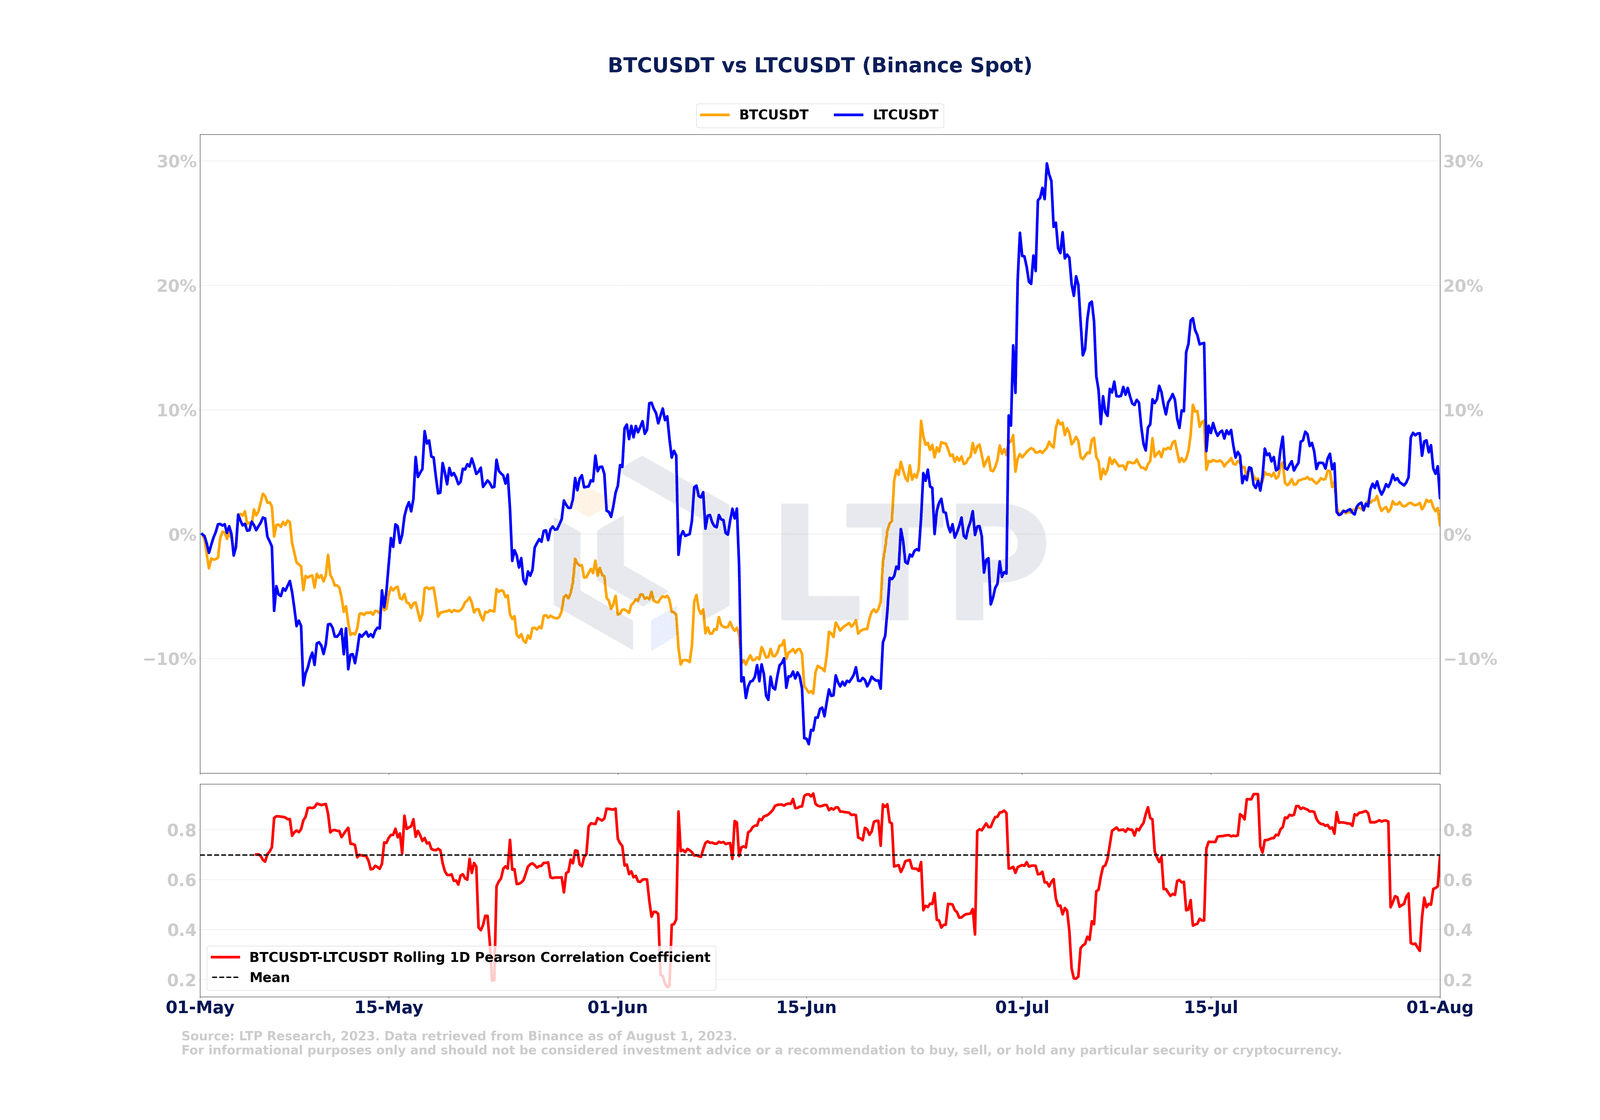
Throughout June and July, Litecoin’s volatility increased significantly as it approached its halving event in early August. Notably, despite the heightened volatility, Litecoin eventually realigned its price dynamics with those of Bitcoin, largely influenced by Bitcoin’s gravitational pull in the cryptocurrency market. When the one-day return correlation between Litecoin and Bitcoin drops below 0.4, Litecoin tends to revert to its mean. The average correlation is centered around 0.7, indicating that Litecoin’s price action is trending in line with Bitcoin. This observation further highlights the impact of Bitcoin market dynamics on Litecoin and its role in driving convergence in its price action.
2.13 Ripple vs SEC’s decision
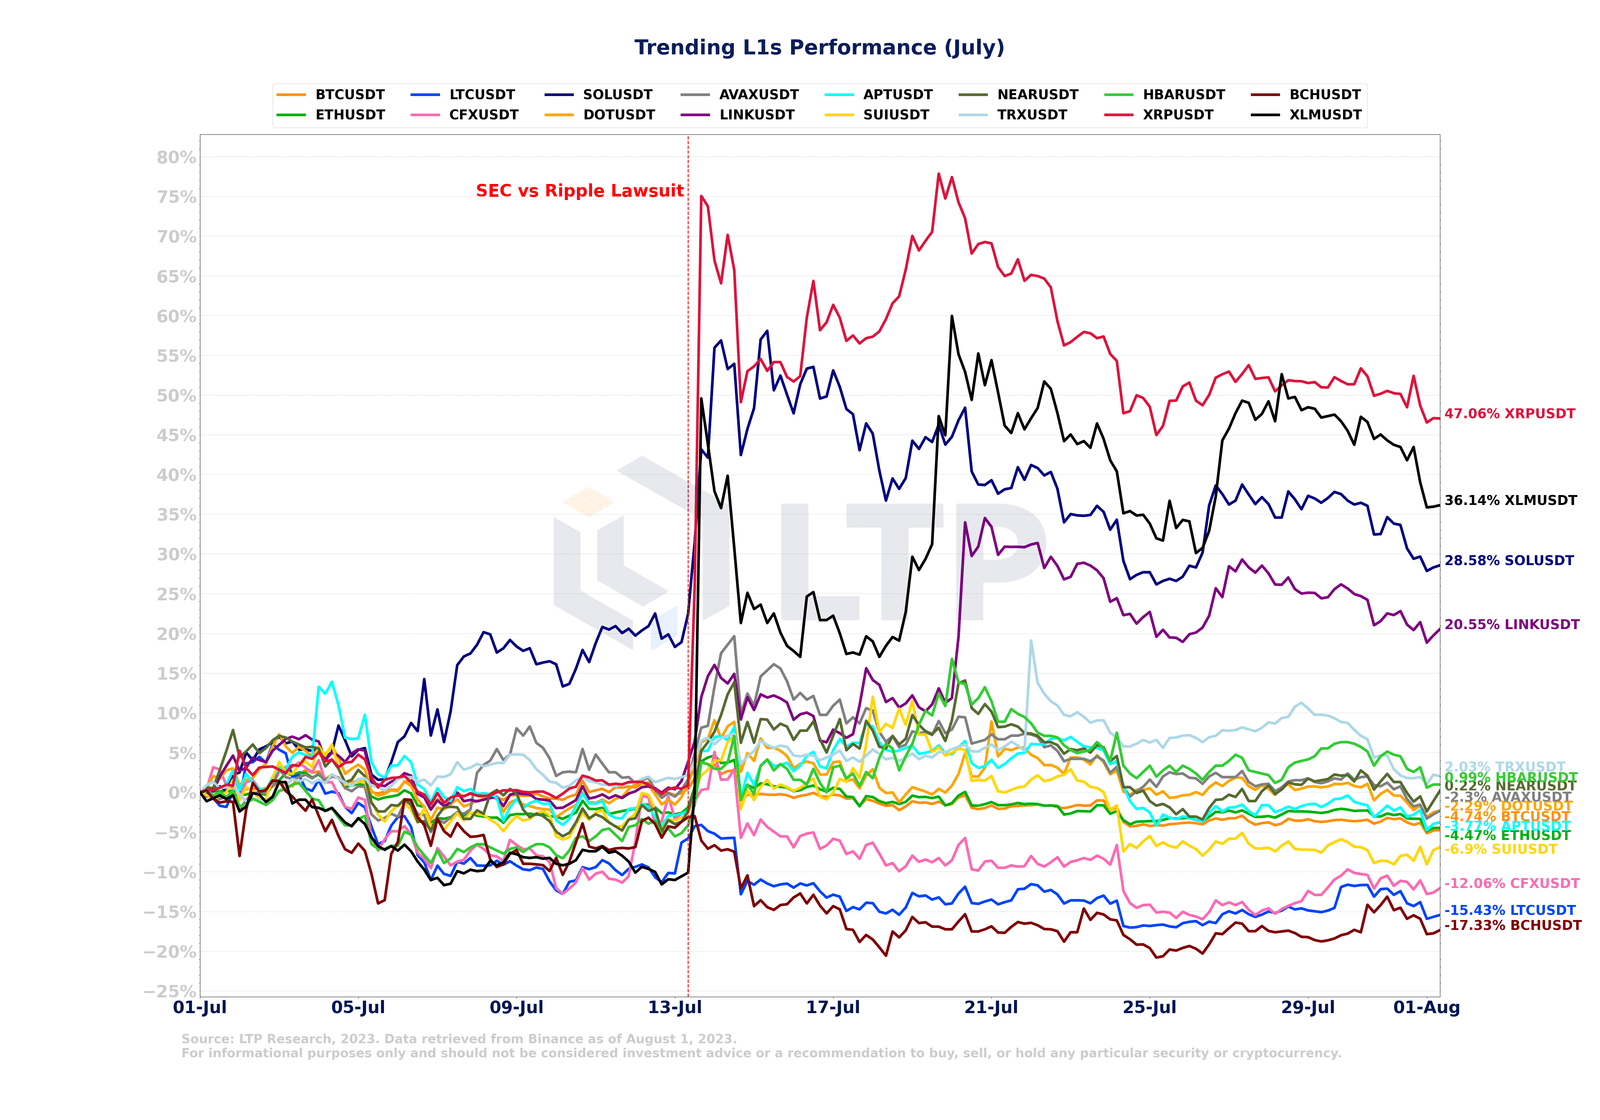
On July 13, 2023, the United States District Court for the Southern District of New York ruled on a case involving Ripple's sale of $XRP, in which the court determined that Ripple's institutional sales of $XRP met the conditions of an unregistered offer and sale of an investment contract, thereby violating securities laws. However, the court also determined that Ripple's programmatic sales of XRP (sold through exchanges) did not constitute a violation. This mixed ruling triggered a sharp rise in the price of $XRP, which soared 102% in a single day. In addition, cryptocurrency exchange Coinbase relisted $XRP on its platform. It is important to note that the legal battle between Ripple and the SEC is ongoing, and the SEC may choose to appeal the decision.
The volatility of $XLM, $SOL, and $LINK also increased simultaneously.
2.14 Popular second-tier performance (July)
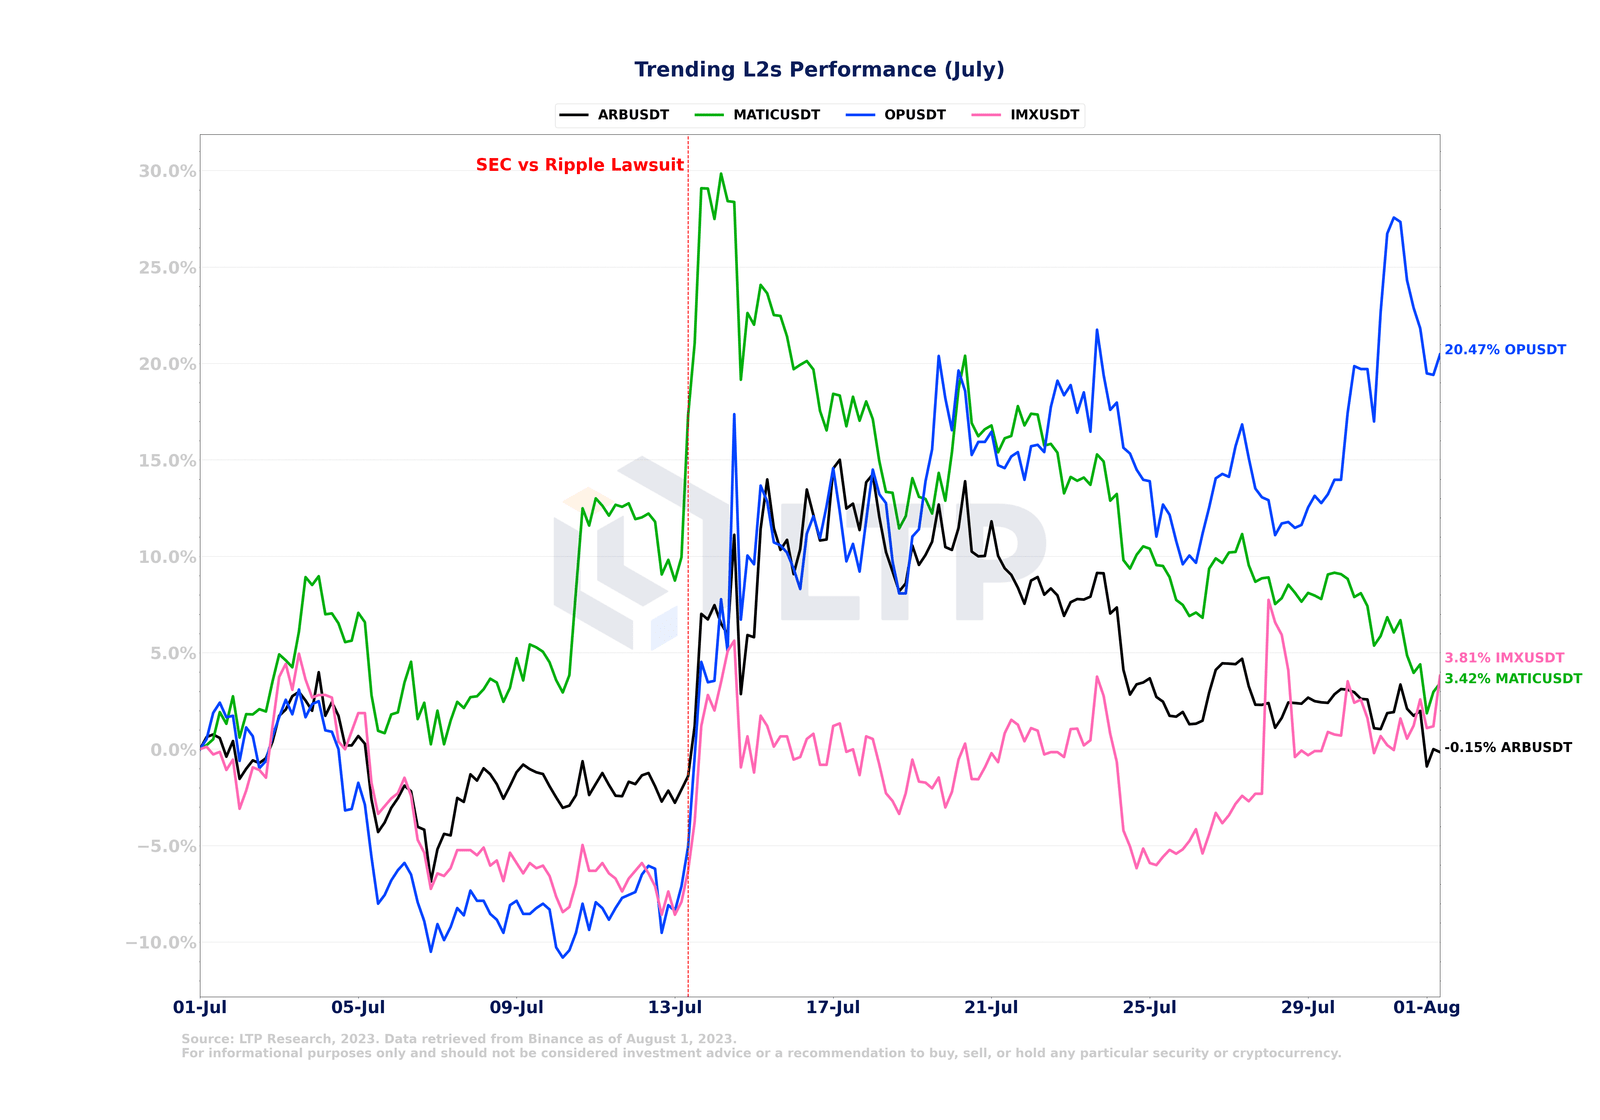
Following the Ripple vs. SEC ruling, volatility for $Matic, $IMX, $ARB, and $OP increased significantly.
2.15 GameFi/Metaverse Token Performance (July)
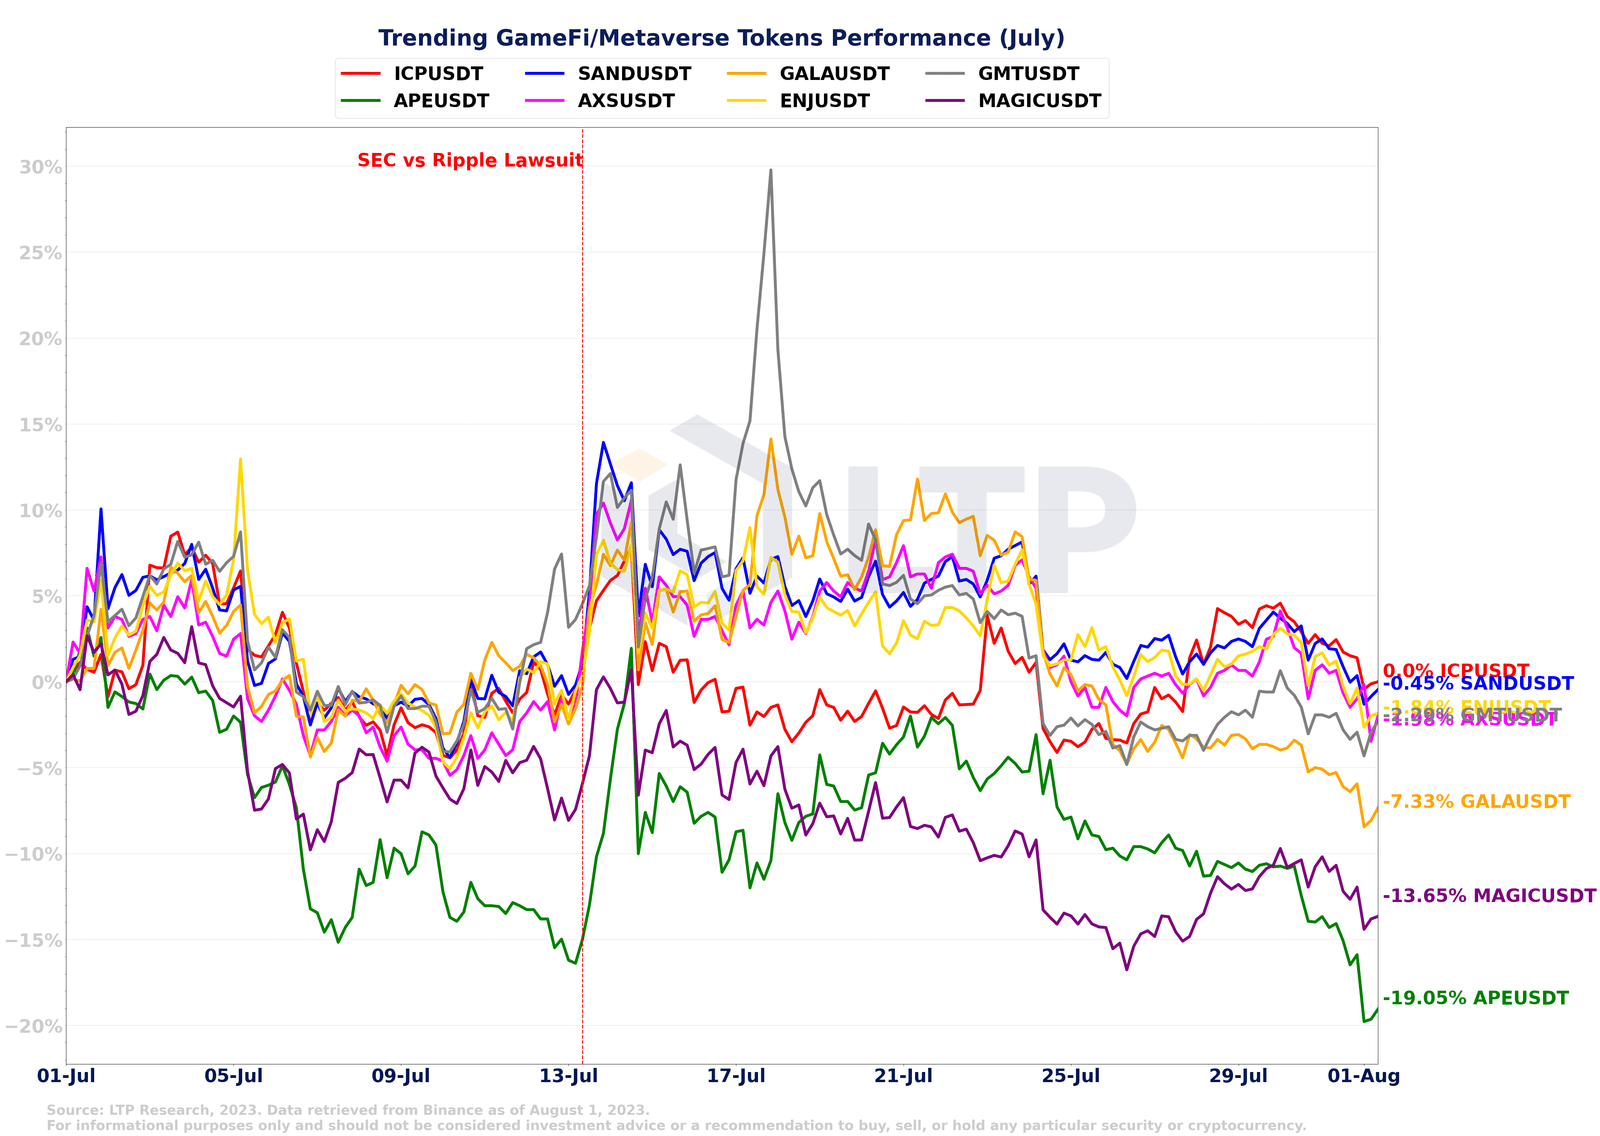
GameFi and Metaverse concept tokens have been performing poorly recently as investors turn to more mature non-security cryptocurrencies such as Bitcoin and Bitcoin Cash.
2.16 Decentralized Finance Token Performance (July)
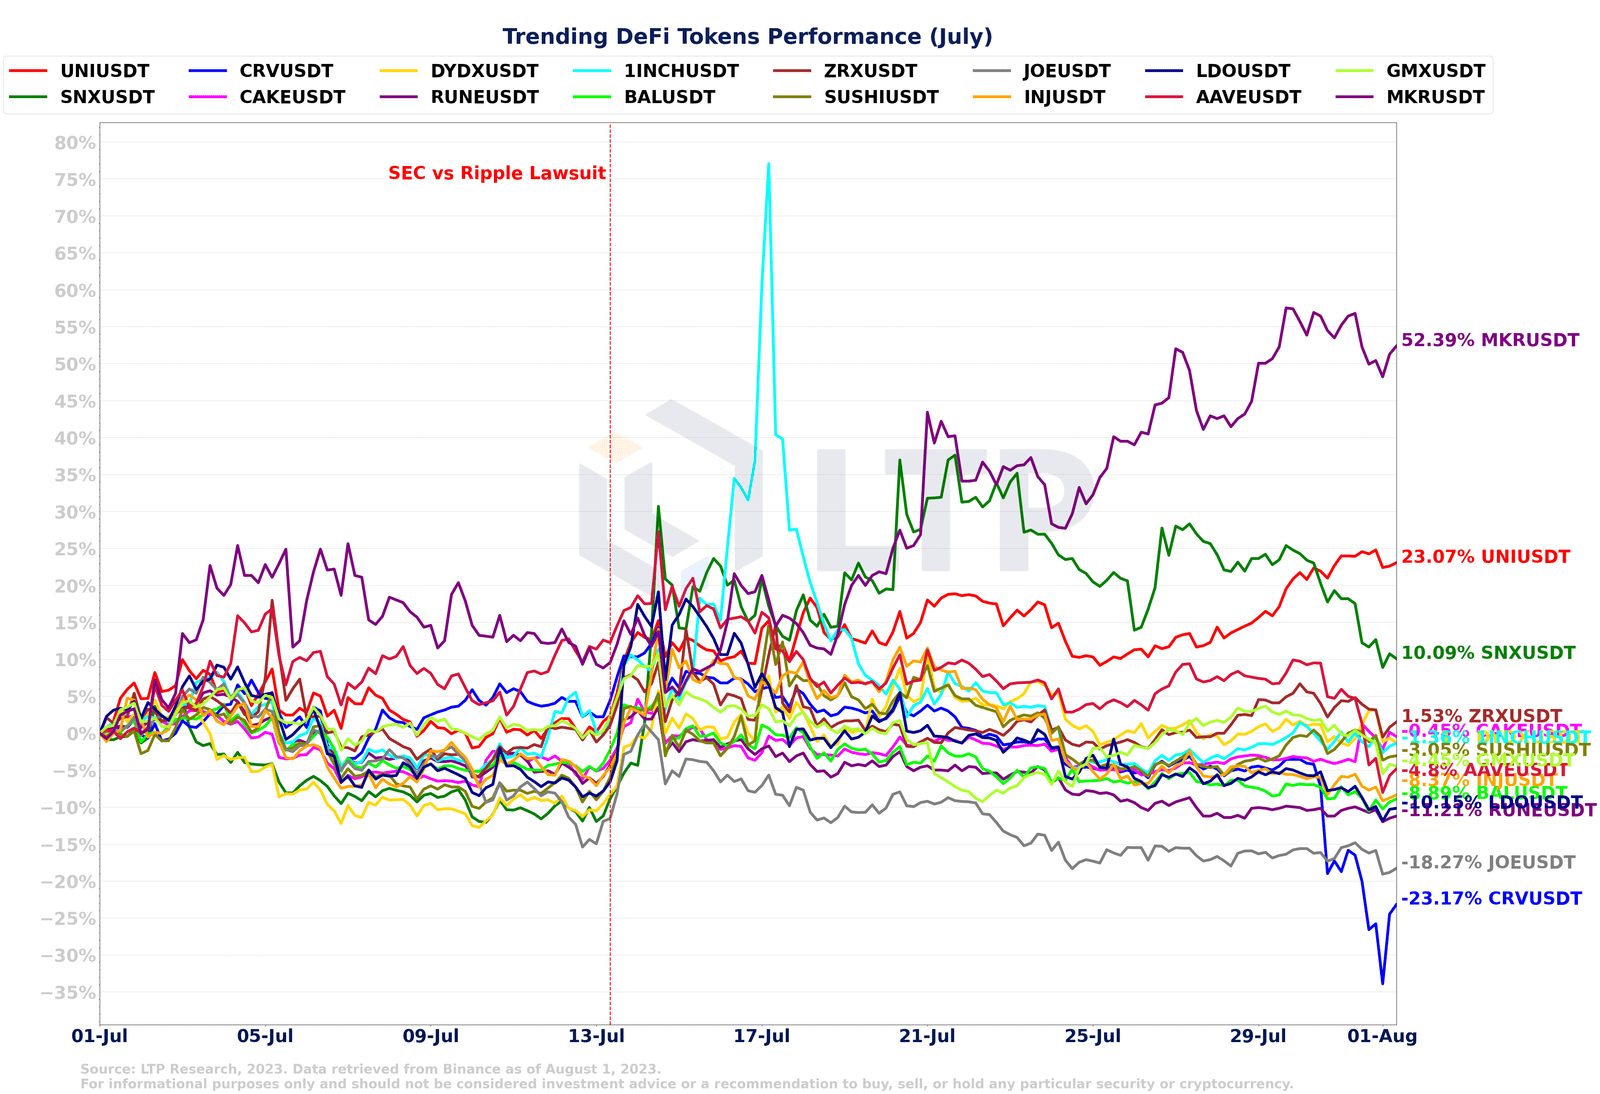
Among currencies related to the decentralized finance concept (DeFi), $MKR has risen significantly.
2.17 Performance of Centralized Exchange Tokens and Memecoin (July)
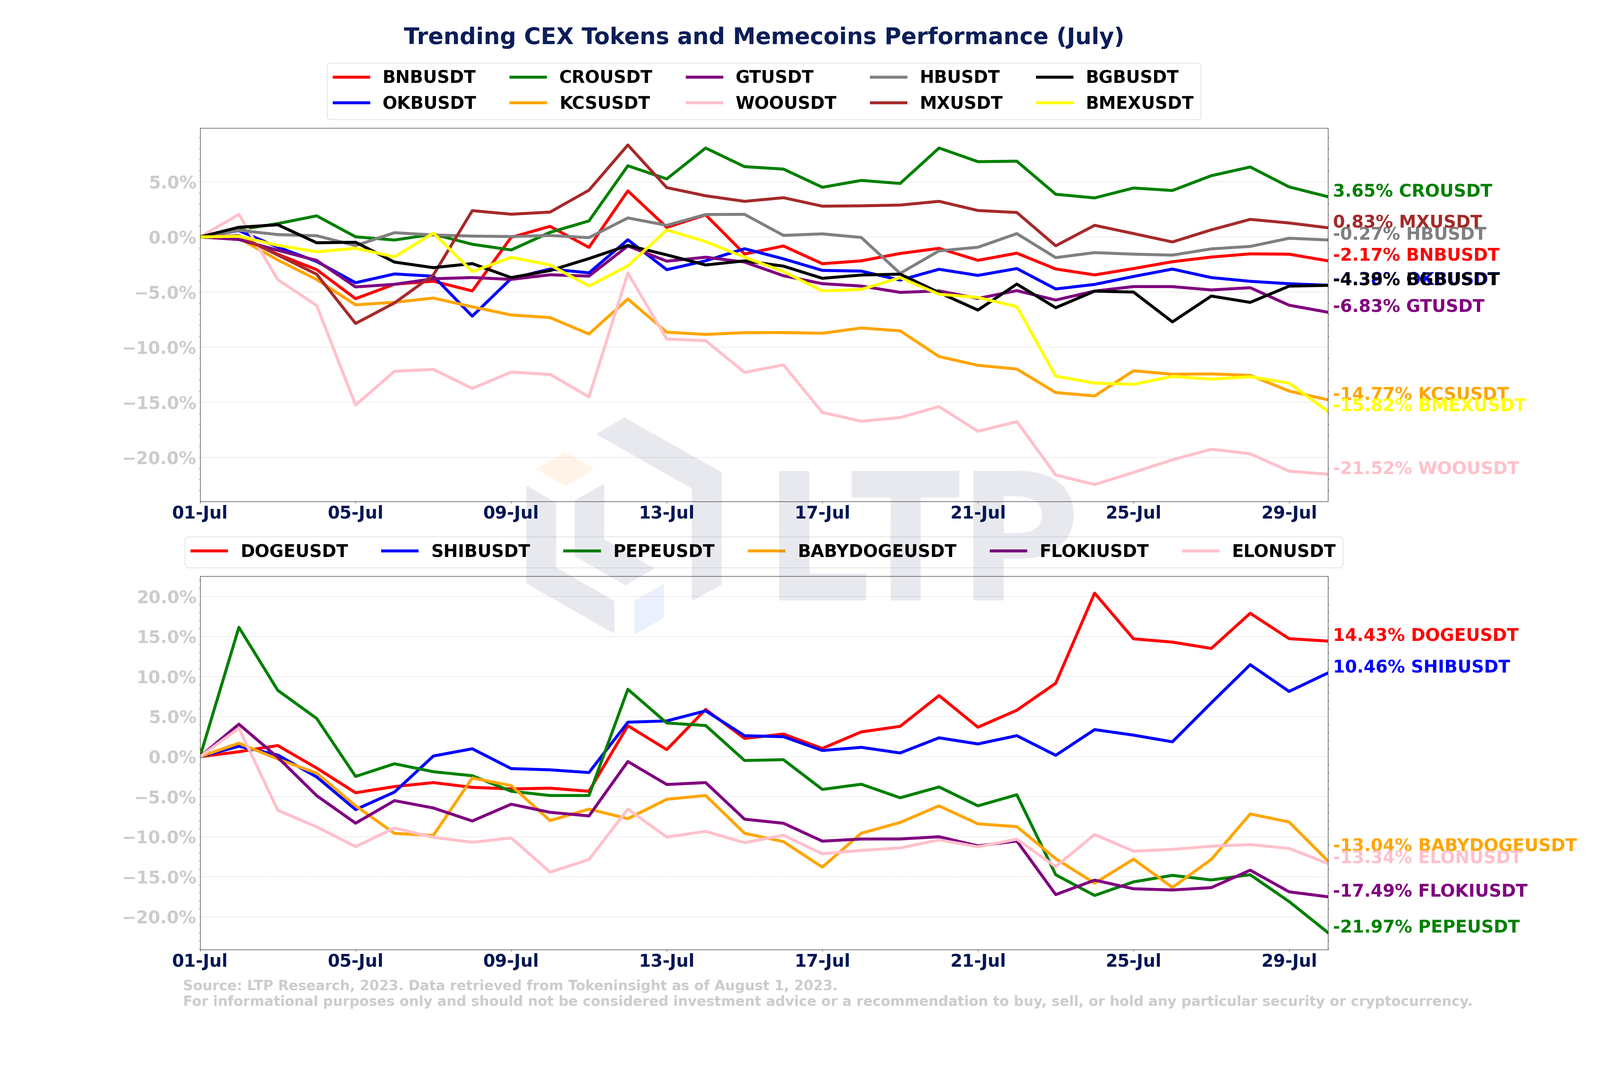
$DOGE recorded a significant increase due to rumors on Twitter that X would adopt mainstream cryptocurrencies.
2.18 Historical August seasonal Bitcoin volatility will increase
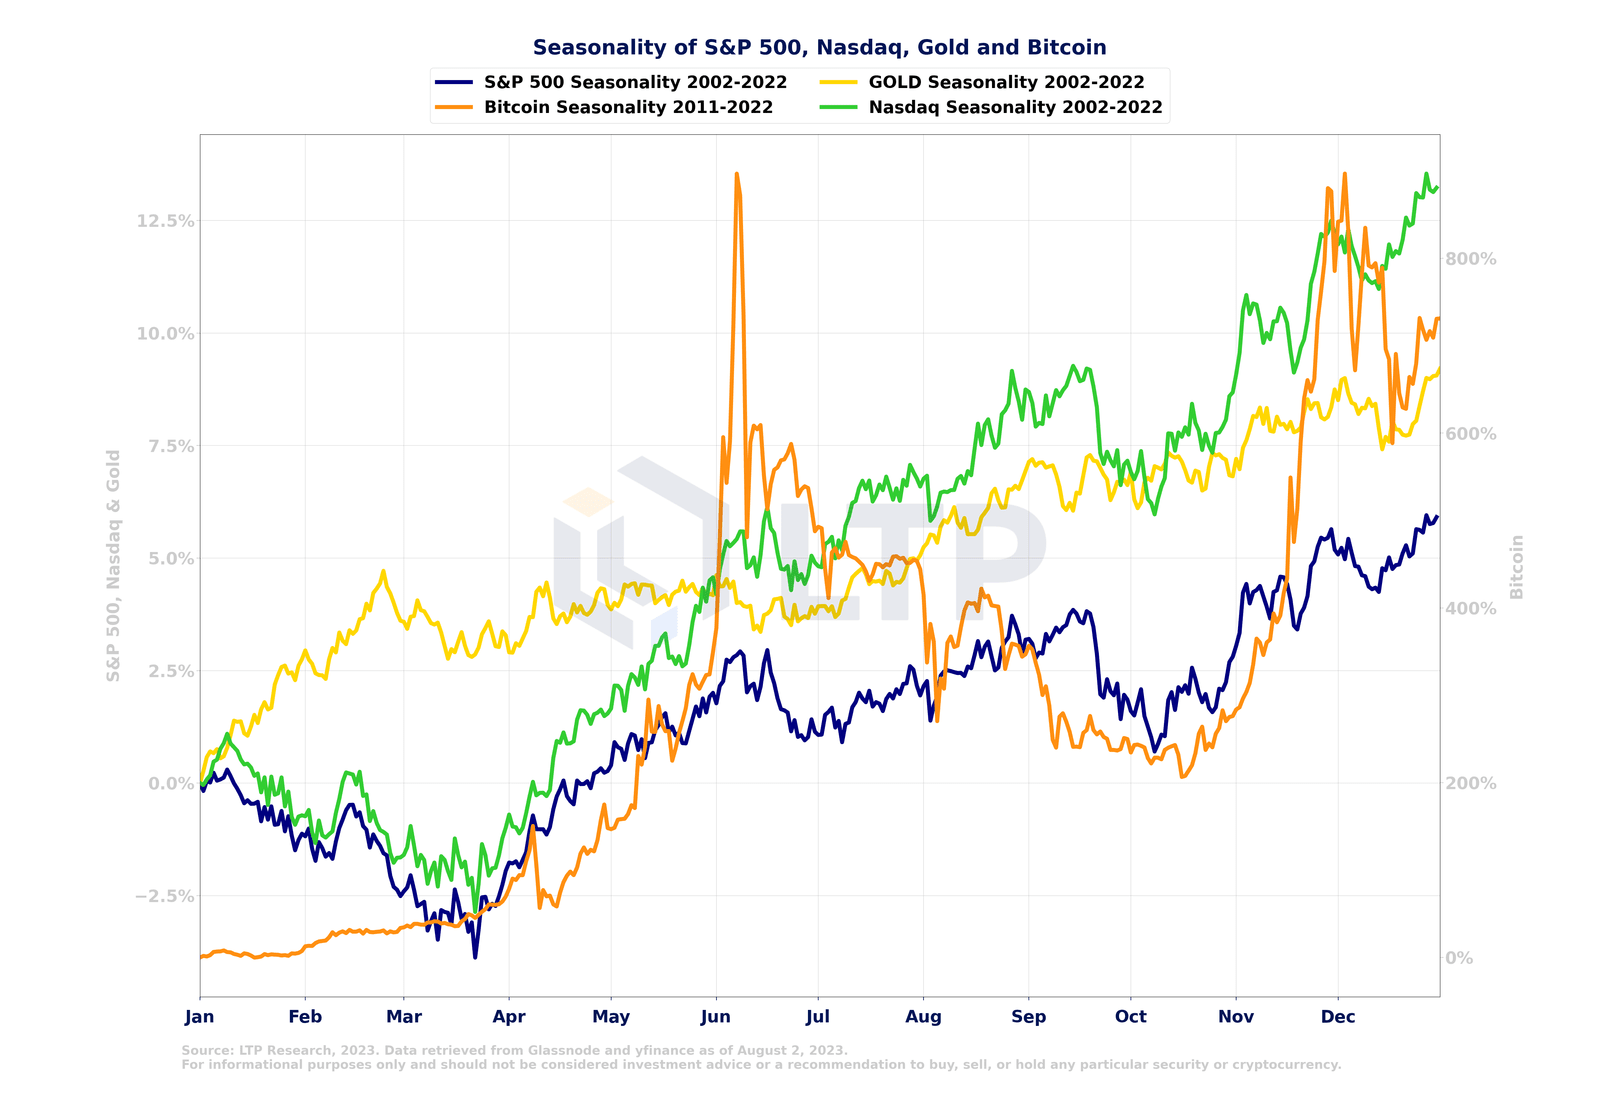
The S&P 500, Nasdaq, gold and Bitcoin markets generally showed a consolidation trend in July. As we head into August, the quarterly patterns for the S&P 500, Nasdaq, and gold are generally bullish. However, Bitcoin’s August seasonal pattern generally follows a downward trend.
News
Coinbase Will Be Surveillance Partner for Fidelity, Other Bitcoin ETFs, Refiled Applications Say
Court Orders Kraken to Turn Over History Transaction and Account Information to IRS
Litecoin blasts past $100 amid surging hash rate, upcoming 'halving'
BlackRock CEO Larry Fink sees bitcoin as 'digitizing gold'
Binance senior execs quit over CEO's response to investigations: Fortune
FBI searched former Kraken CEO's home: The New York Times
Gemini sues Digital Currency Group, Barry Silbert over alleged fraud
Multichain was exploited for more than $120M in assets
Circle, Tether freezes over $65M in assets transferred from Multichain
Ripple, Crypto Industry Score Partial Win in SEC Court Fight Over XRP
Former SEC Chair Says Bitcoin ETF Could Be Approved—If These Conditions Are Met
Europe’s first spot Bitcoin ETF eyes 2023 debut after year-long delay
First spot bitcoin ETF application filed under new Australian regulations
Cboe reaches surveillance agreement with Coinbase for spot bitcoin ETFs
Binance Labs invests $10 million in cross-chain DeFi lender Radiant Capital
SEC sues Celsius Network, Alex Mashinsky
Worldcoin's Mainnet, WLD Token Goes Live
Dogecoin Bumps 10% on X Payments Speculation, DOGE Futures Traders Lose $10M
Binance lists new stablecoin FDUSD with zero trading fees
Ripple runs CBDC pilot with Pacific island nation of Palau
Optimism Tokens Worth $36M to Be Unlocked on Sunday; OP Slides 3.5%
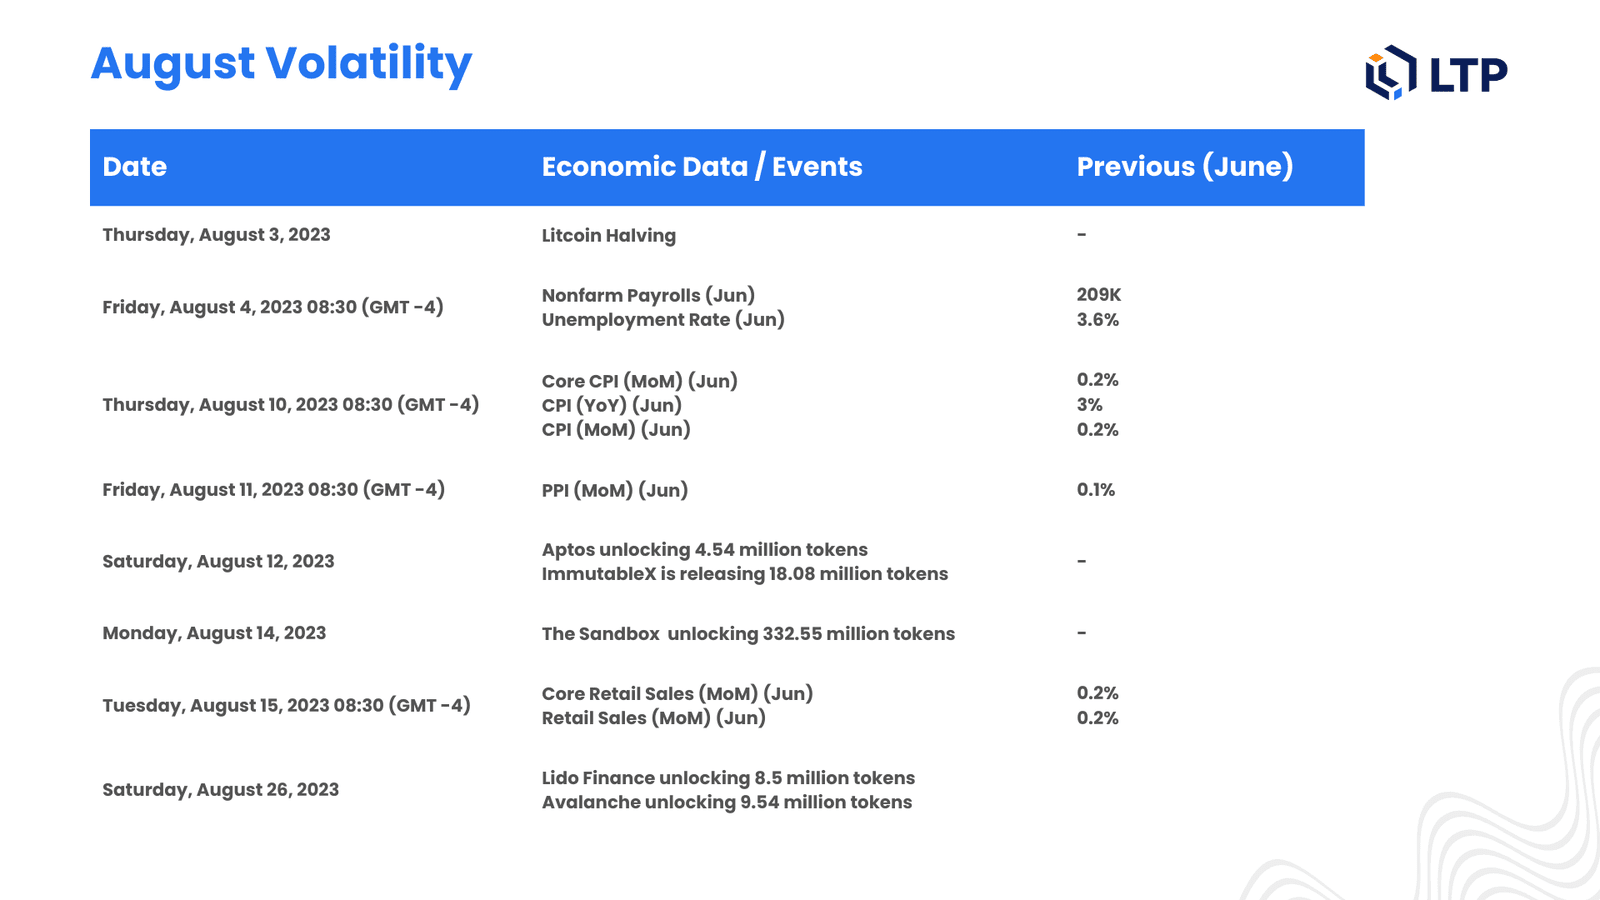
August Volatile Days
appendix
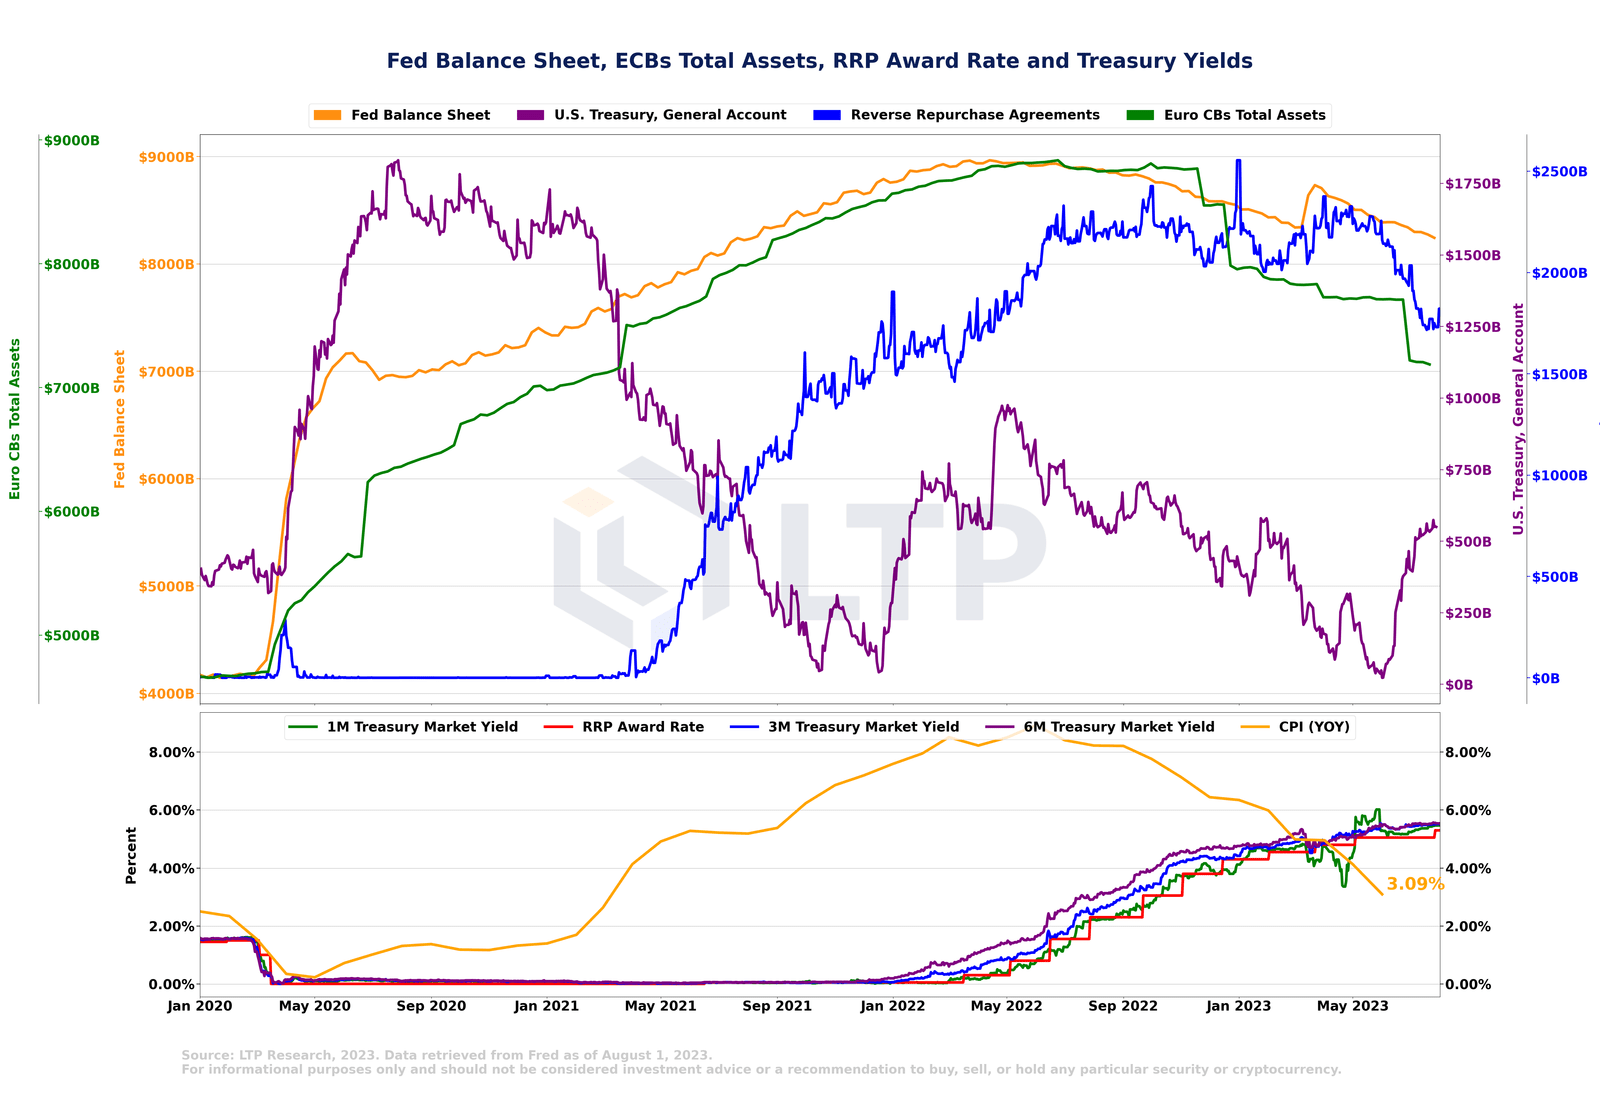
Figure A. Fed Balance Sheet, US Treasury General Account (TGA), Reverse Repo (RRP), and ECB Total Assets
Source: LTP Research, 2023. Data retrieved from Fred as of August 1, 2023.
It is provided for informational purposes only and should not be considered investment advice or a recommendation to buy, sell or hold any specific security or cryptocurrency.
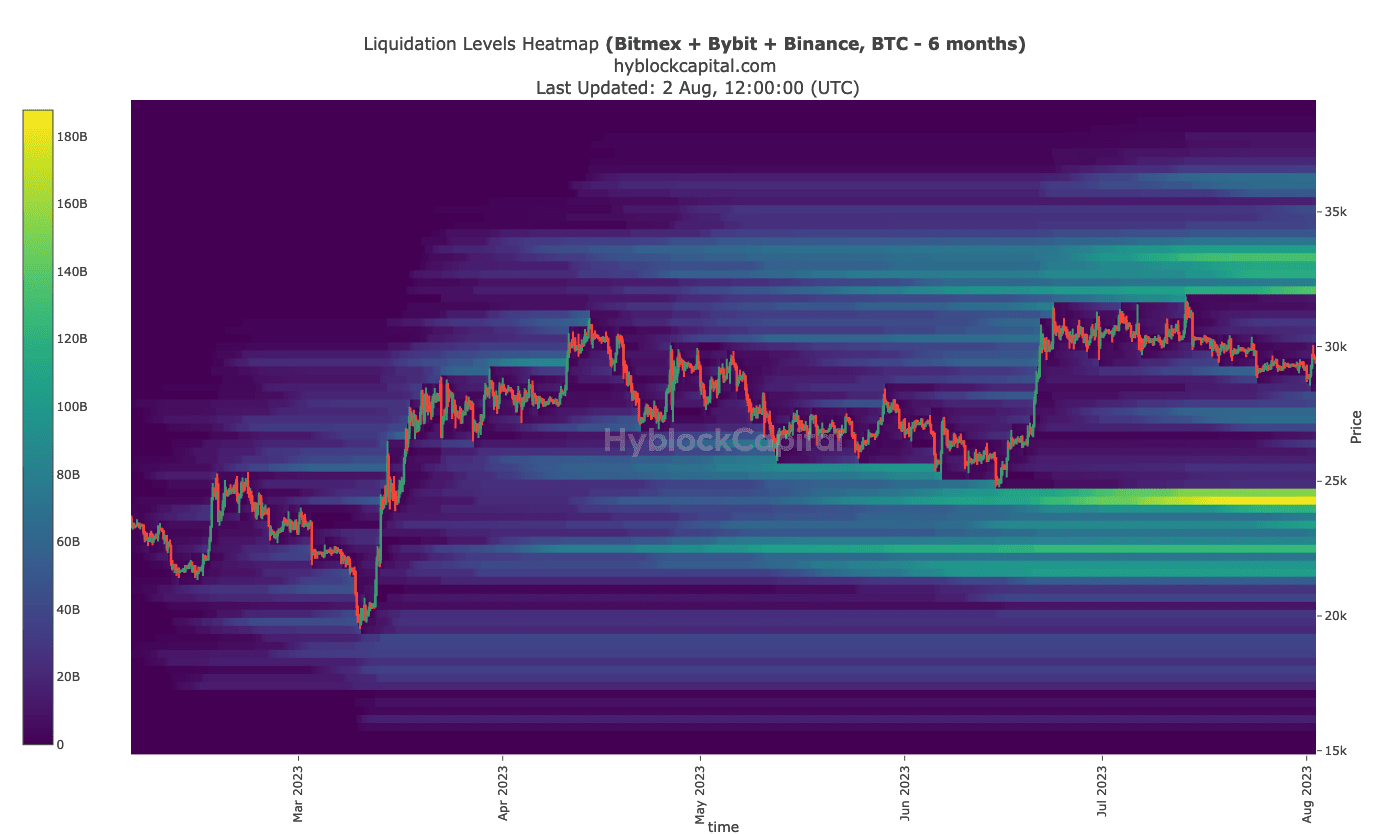
Figure B. Liquidation heat map
Source: Hyblock Capital. As of August 1, 2023.
It is provided for informational purposes only and should not be considered investment advice or a recommendation to buy, sell or hold any specific security or cryptocurrency.
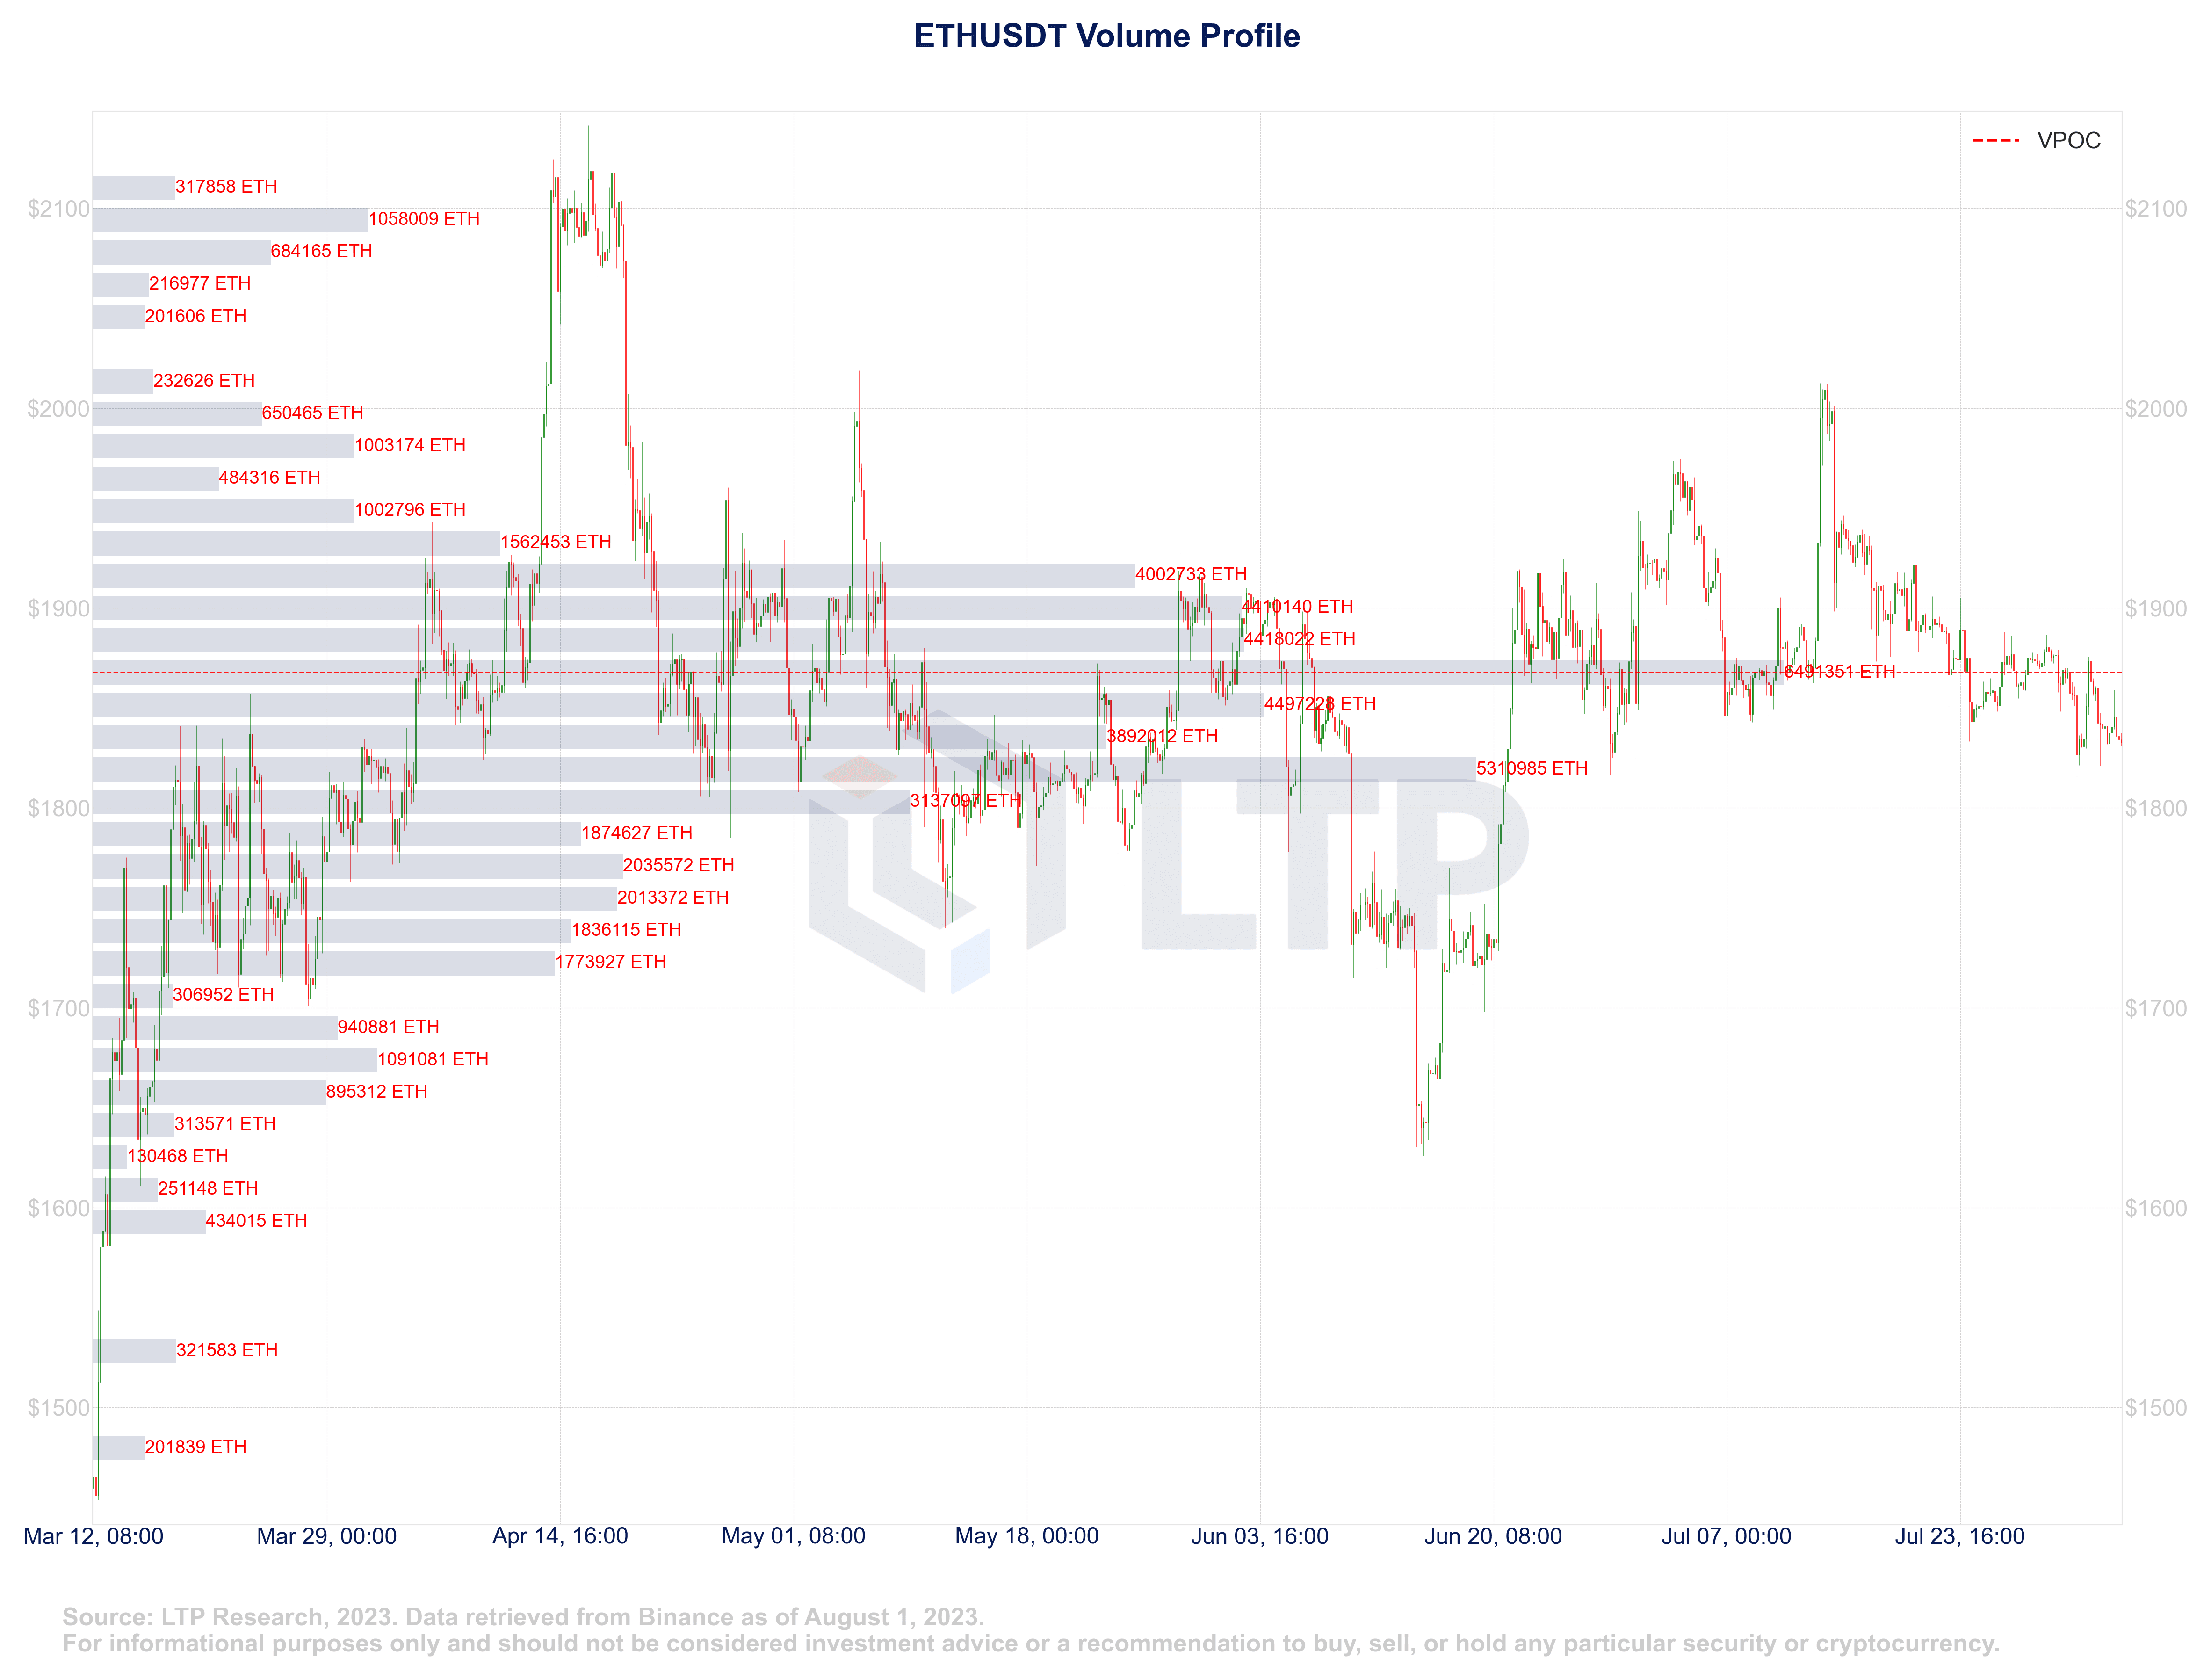
Figure C. ETHUSDT (Binance spot) trading volume distribution
Source: LTP Research, 2023. Data retrieved from Binance as of August 1, 2023.
It is provided for informational purposes only and should not be considered investment advice or a recommendation to buy, sell or hold any specific security or cryptocurrency.
Based on the volume profile, the price range of $1800 to $1900 has been the most active trading area. Above the price range of $1900, trading activity is relatively light.
Disclaimer
The information, opinions, estimates and forecasts contained in this cryptocurrency market review (collectively, the "Information") are provided by Liquidity Technologies Inc. (the "Company"). The Information is provided for informational purposes only and is not intended to provide investors with any formal understanding or recommendation. The Company has made reasonable efforts to ensure the accuracy and validity of the information provided, but does not make any guarantee as to its accuracy or completeness. The financial opinions expressed reflect the judgment of the author as of the date of publication and are subject to change without notice. This Information should not be construed as an offer or solicitation to buy, sell or trade any cryptocurrency, security or financial instrument. It does not take into account the personal investment objectives or situation of any reader. Cryptocurrencies are highly volatile and complex products and are subject to significant risks, including the risk of sudden and large price fluctuations. Investors in cryptocurrencies do not have any legal liability protection in the event of bankruptcy of the Company. Investors whose value of cryptocurrencies may be affected by changes in currency exchange rates, regulatory intervention or other political and economic developments should be aware that the value of their investment may decline and they may not be able to recover. Any historical information contained in this information is based on our own analysis and is provided for illustrative purposes only. Past performance is not an indicator of future results and results may vary. In no event shall the Company, its directors, employees, agents, partners, suppliers or affiliates be responsible or liable for any indirect, incidental, special, consequential or punitive damages, including but not limited to loss of profits, data, use or other intangible losses, arising out of the use of this information. The Company reserves the right to modify, change, add or delete portions of this information at any time and for any reason without prior notice.