
At these minutes there is another breakdown of the upward trend and, in general, according to the indicators we are focusing on, the priority is a decline with a test of the volume level of $50,312. As they wrote in the last review, you need to see the reaction of buyers from it.
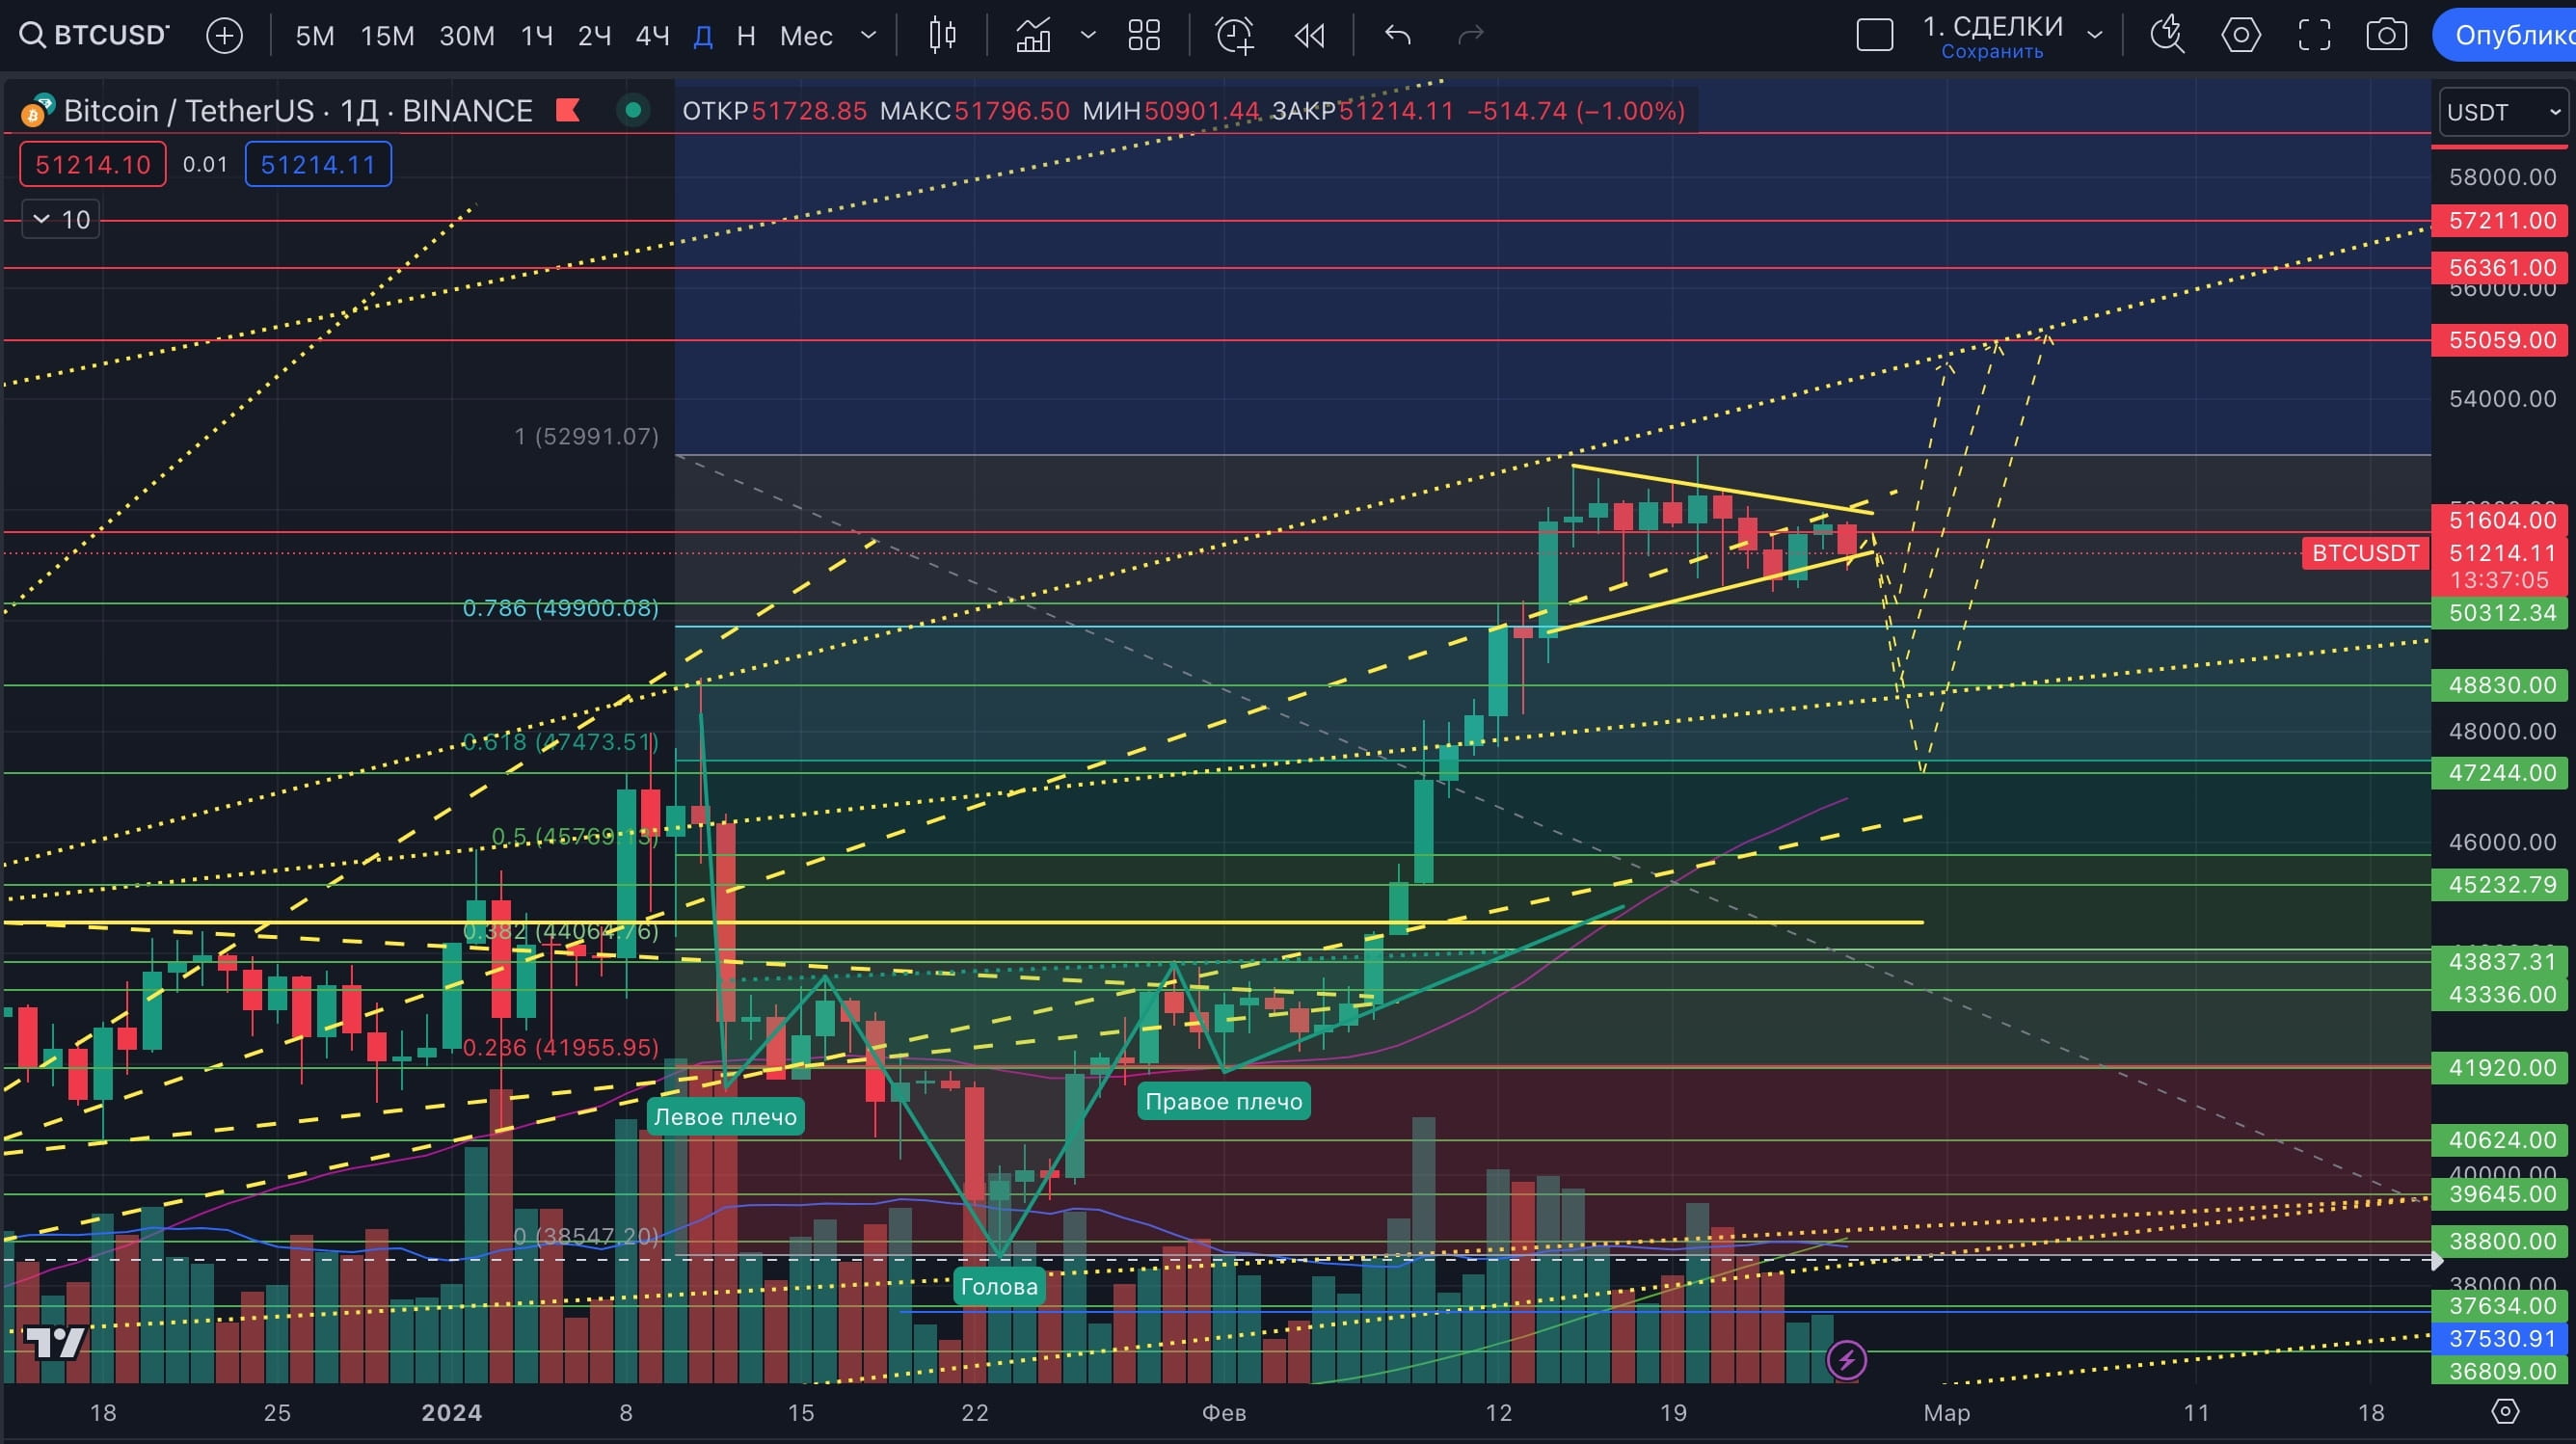
While there is no consolidation above the volume level of $51,604 with the body of the daily candle with a retest (!) - buyers are showing weakness, you need to go for liquidity below. The weekly candle closed above $51,604, but this is a red doji on the highs, clearly not bullish.
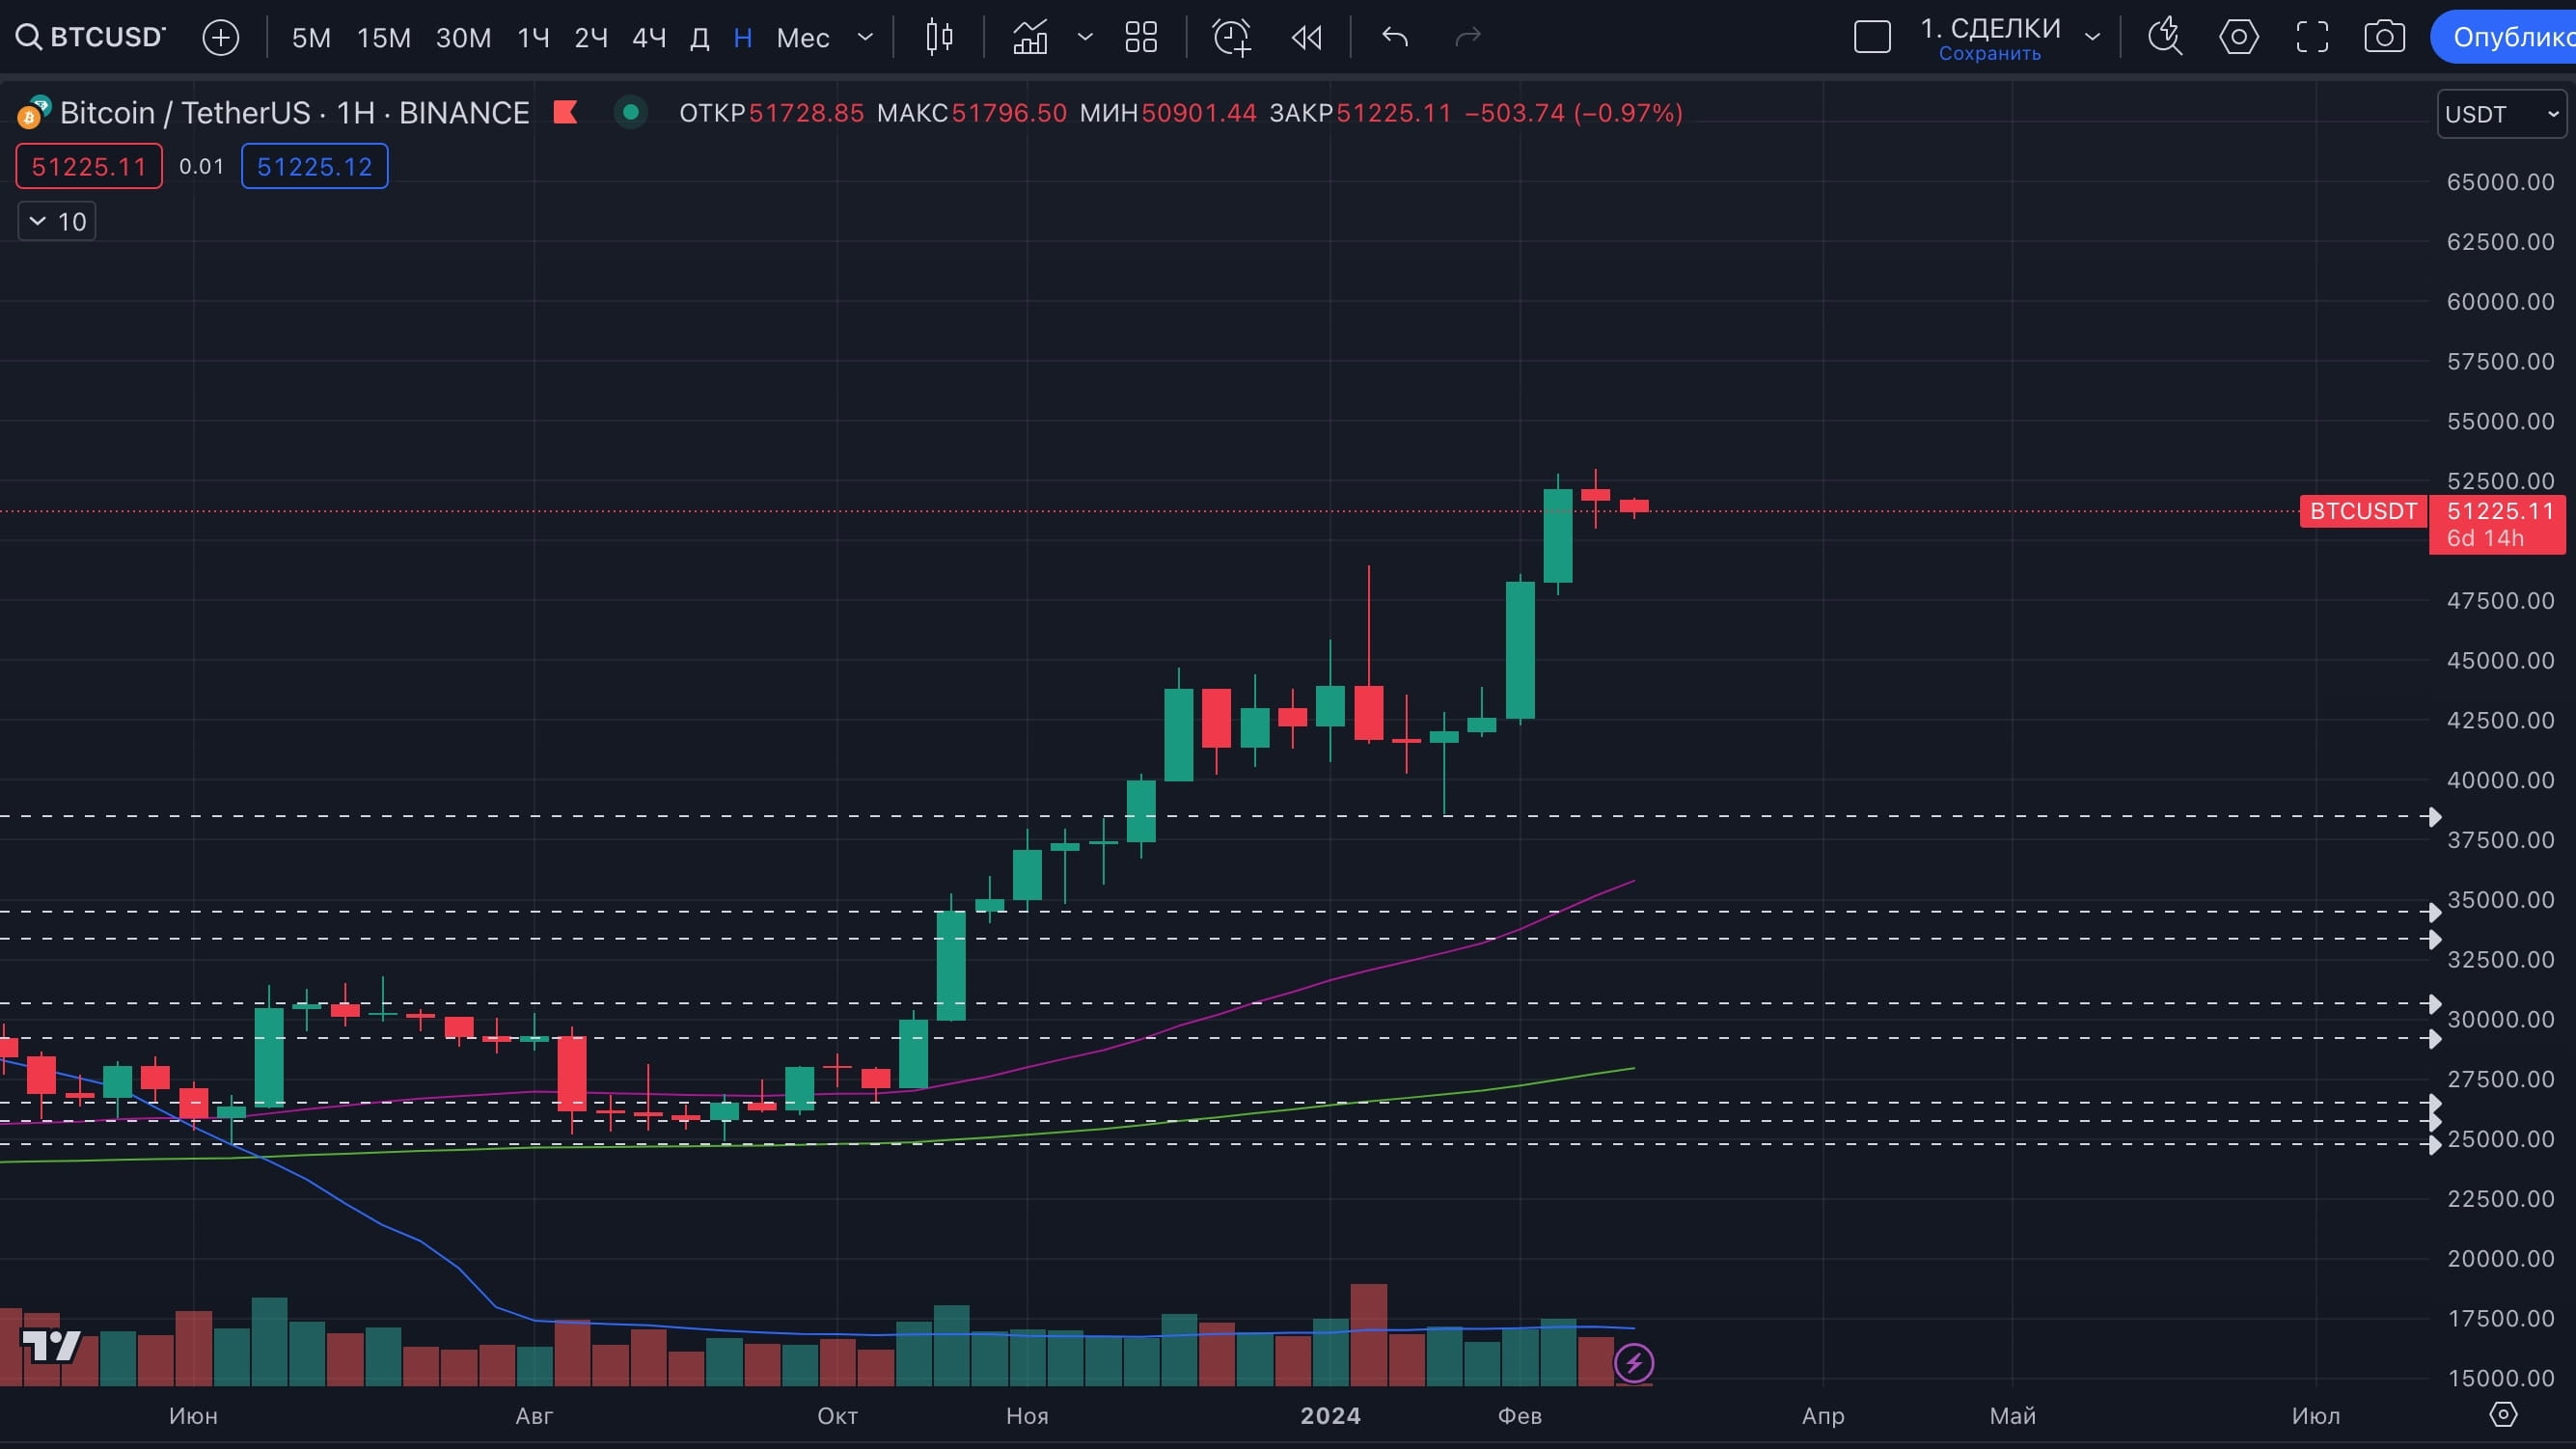
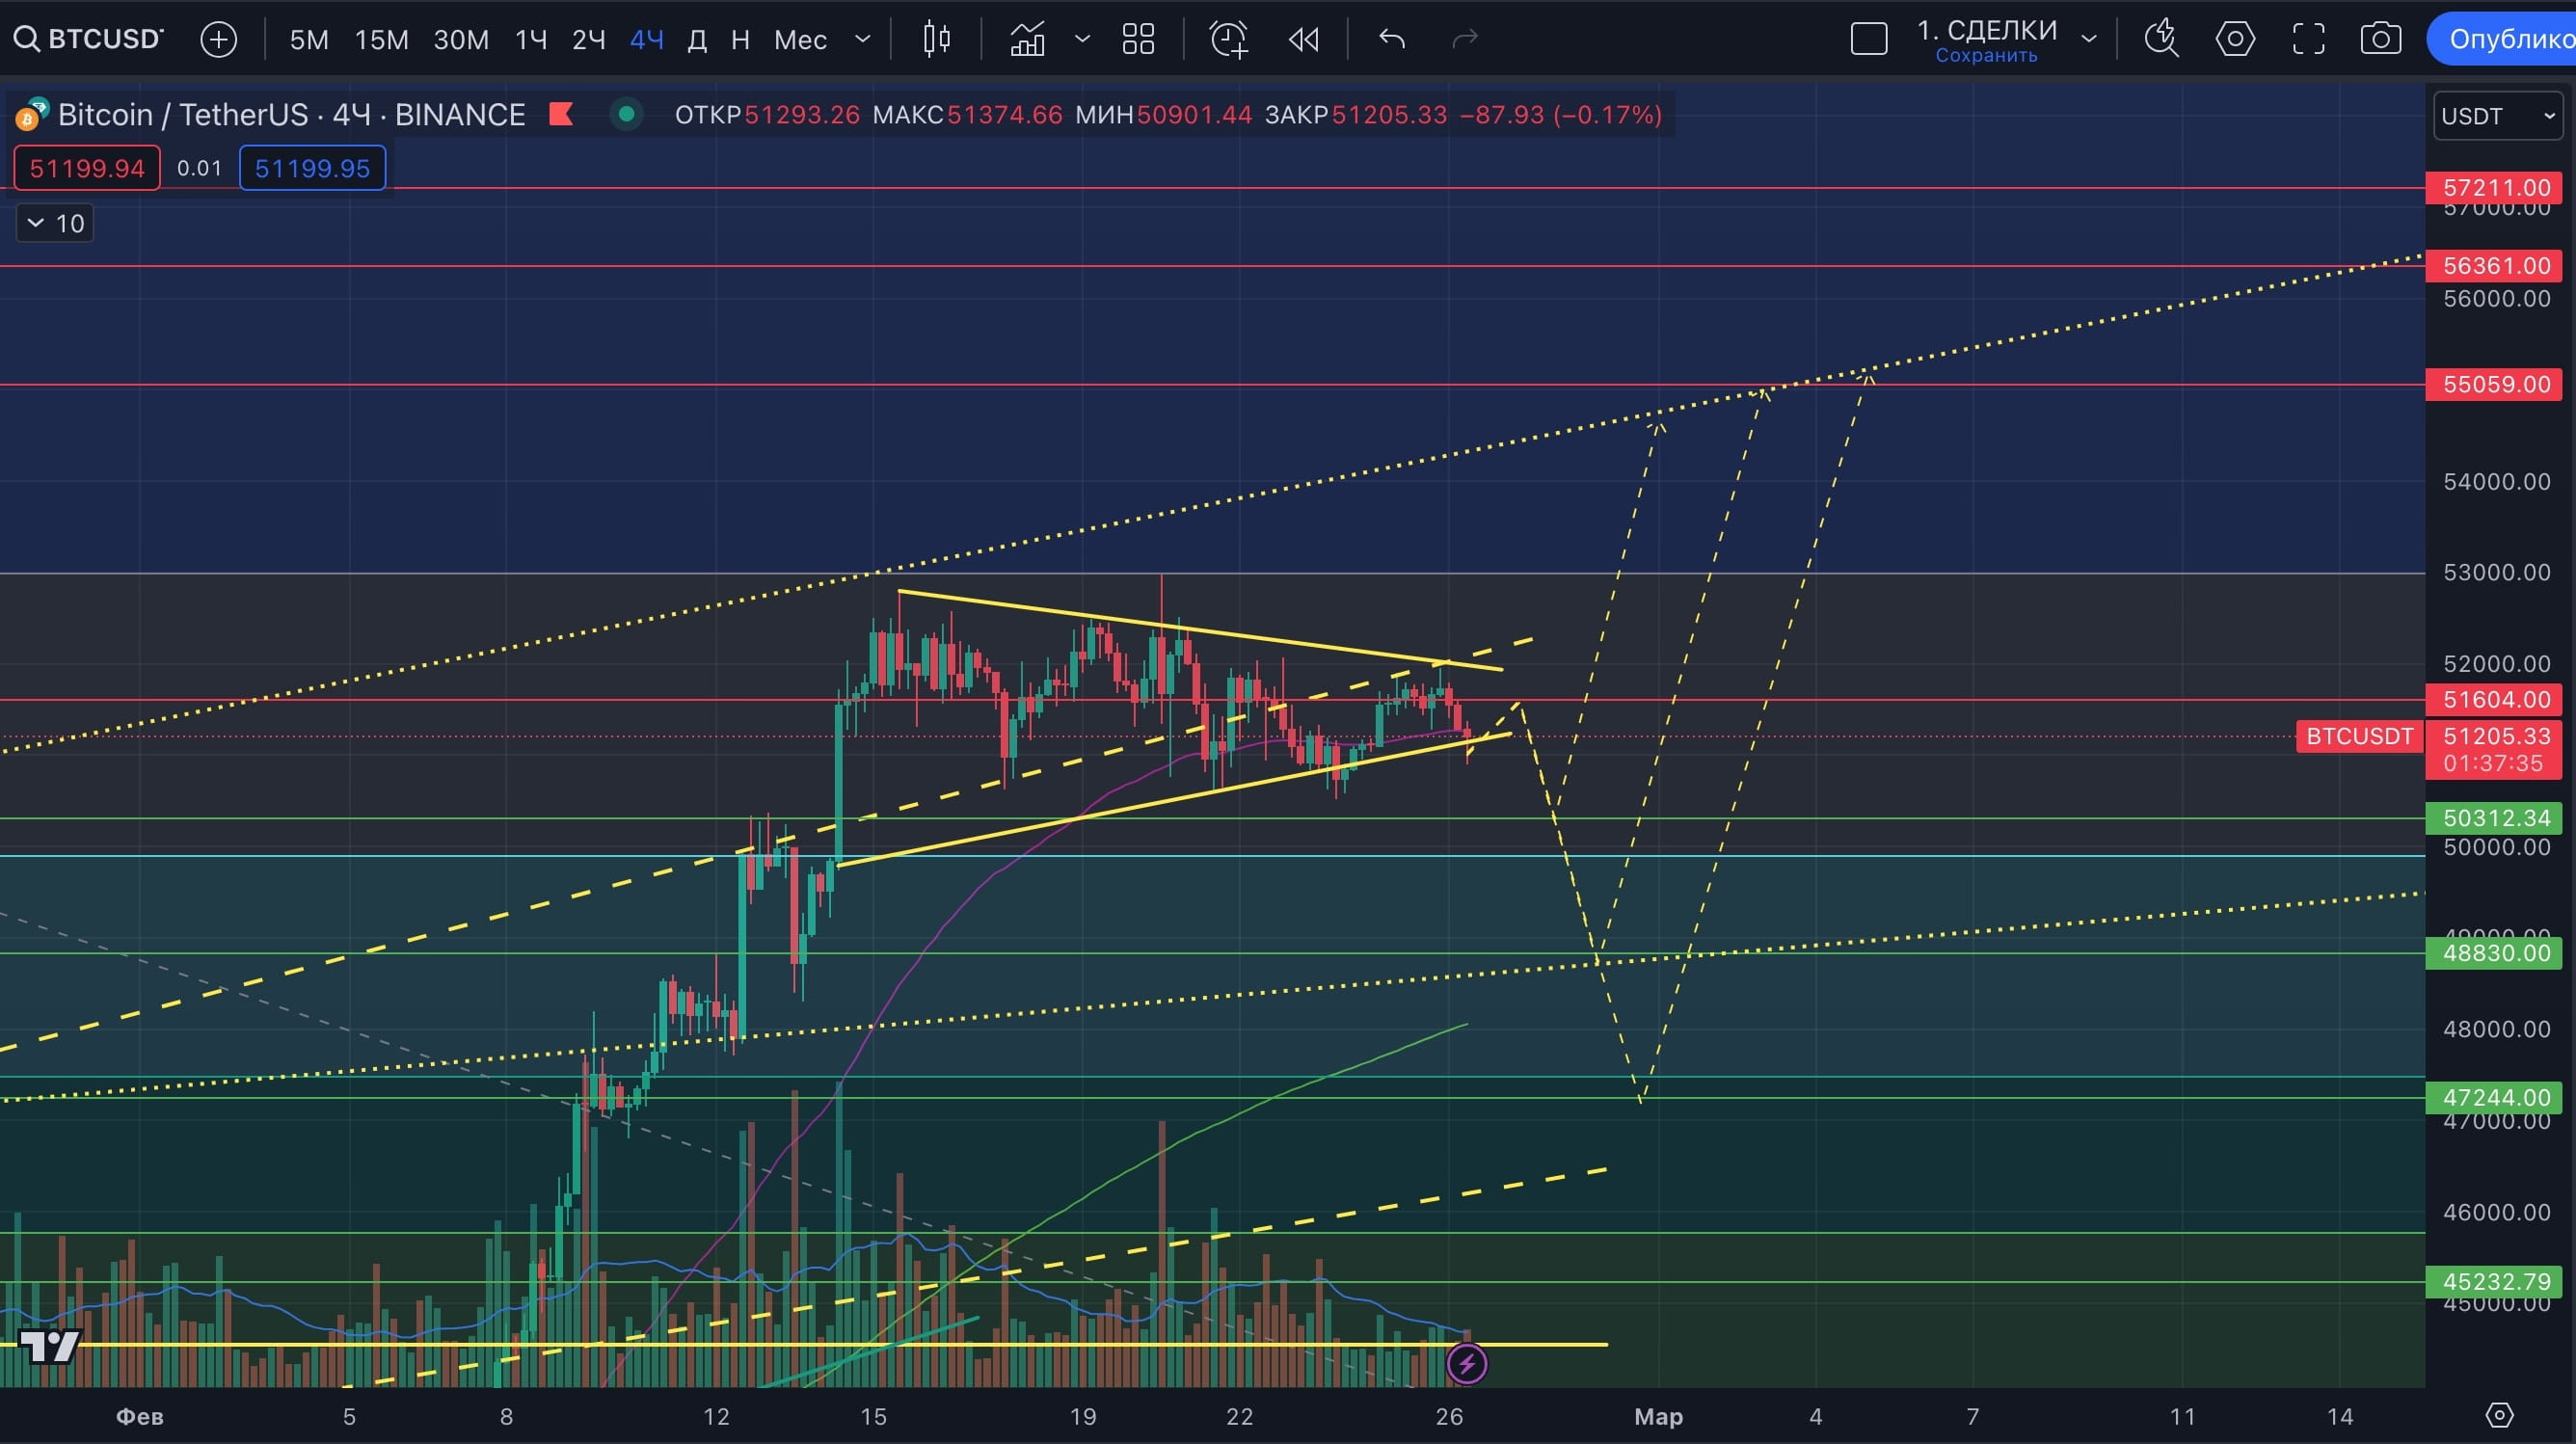
First, conclusions - our expectations now - a scenario of range expansion to one of three supports ($50,312, $48,830, $47,244) or EMA 200 of the four-hour timeframe (currently $48,051), then a rebound from the lower support of this range and more cross one. Or to an upward trend from December 5, 2023 (indicated by a dotted line, currently $54,340). Or to the volume level of $55,059. They showed the options on the graph with a dotted trajectory.
Fixing the daily candle with the body below the volume level of $47,244 can force one to abandon such an expectation.
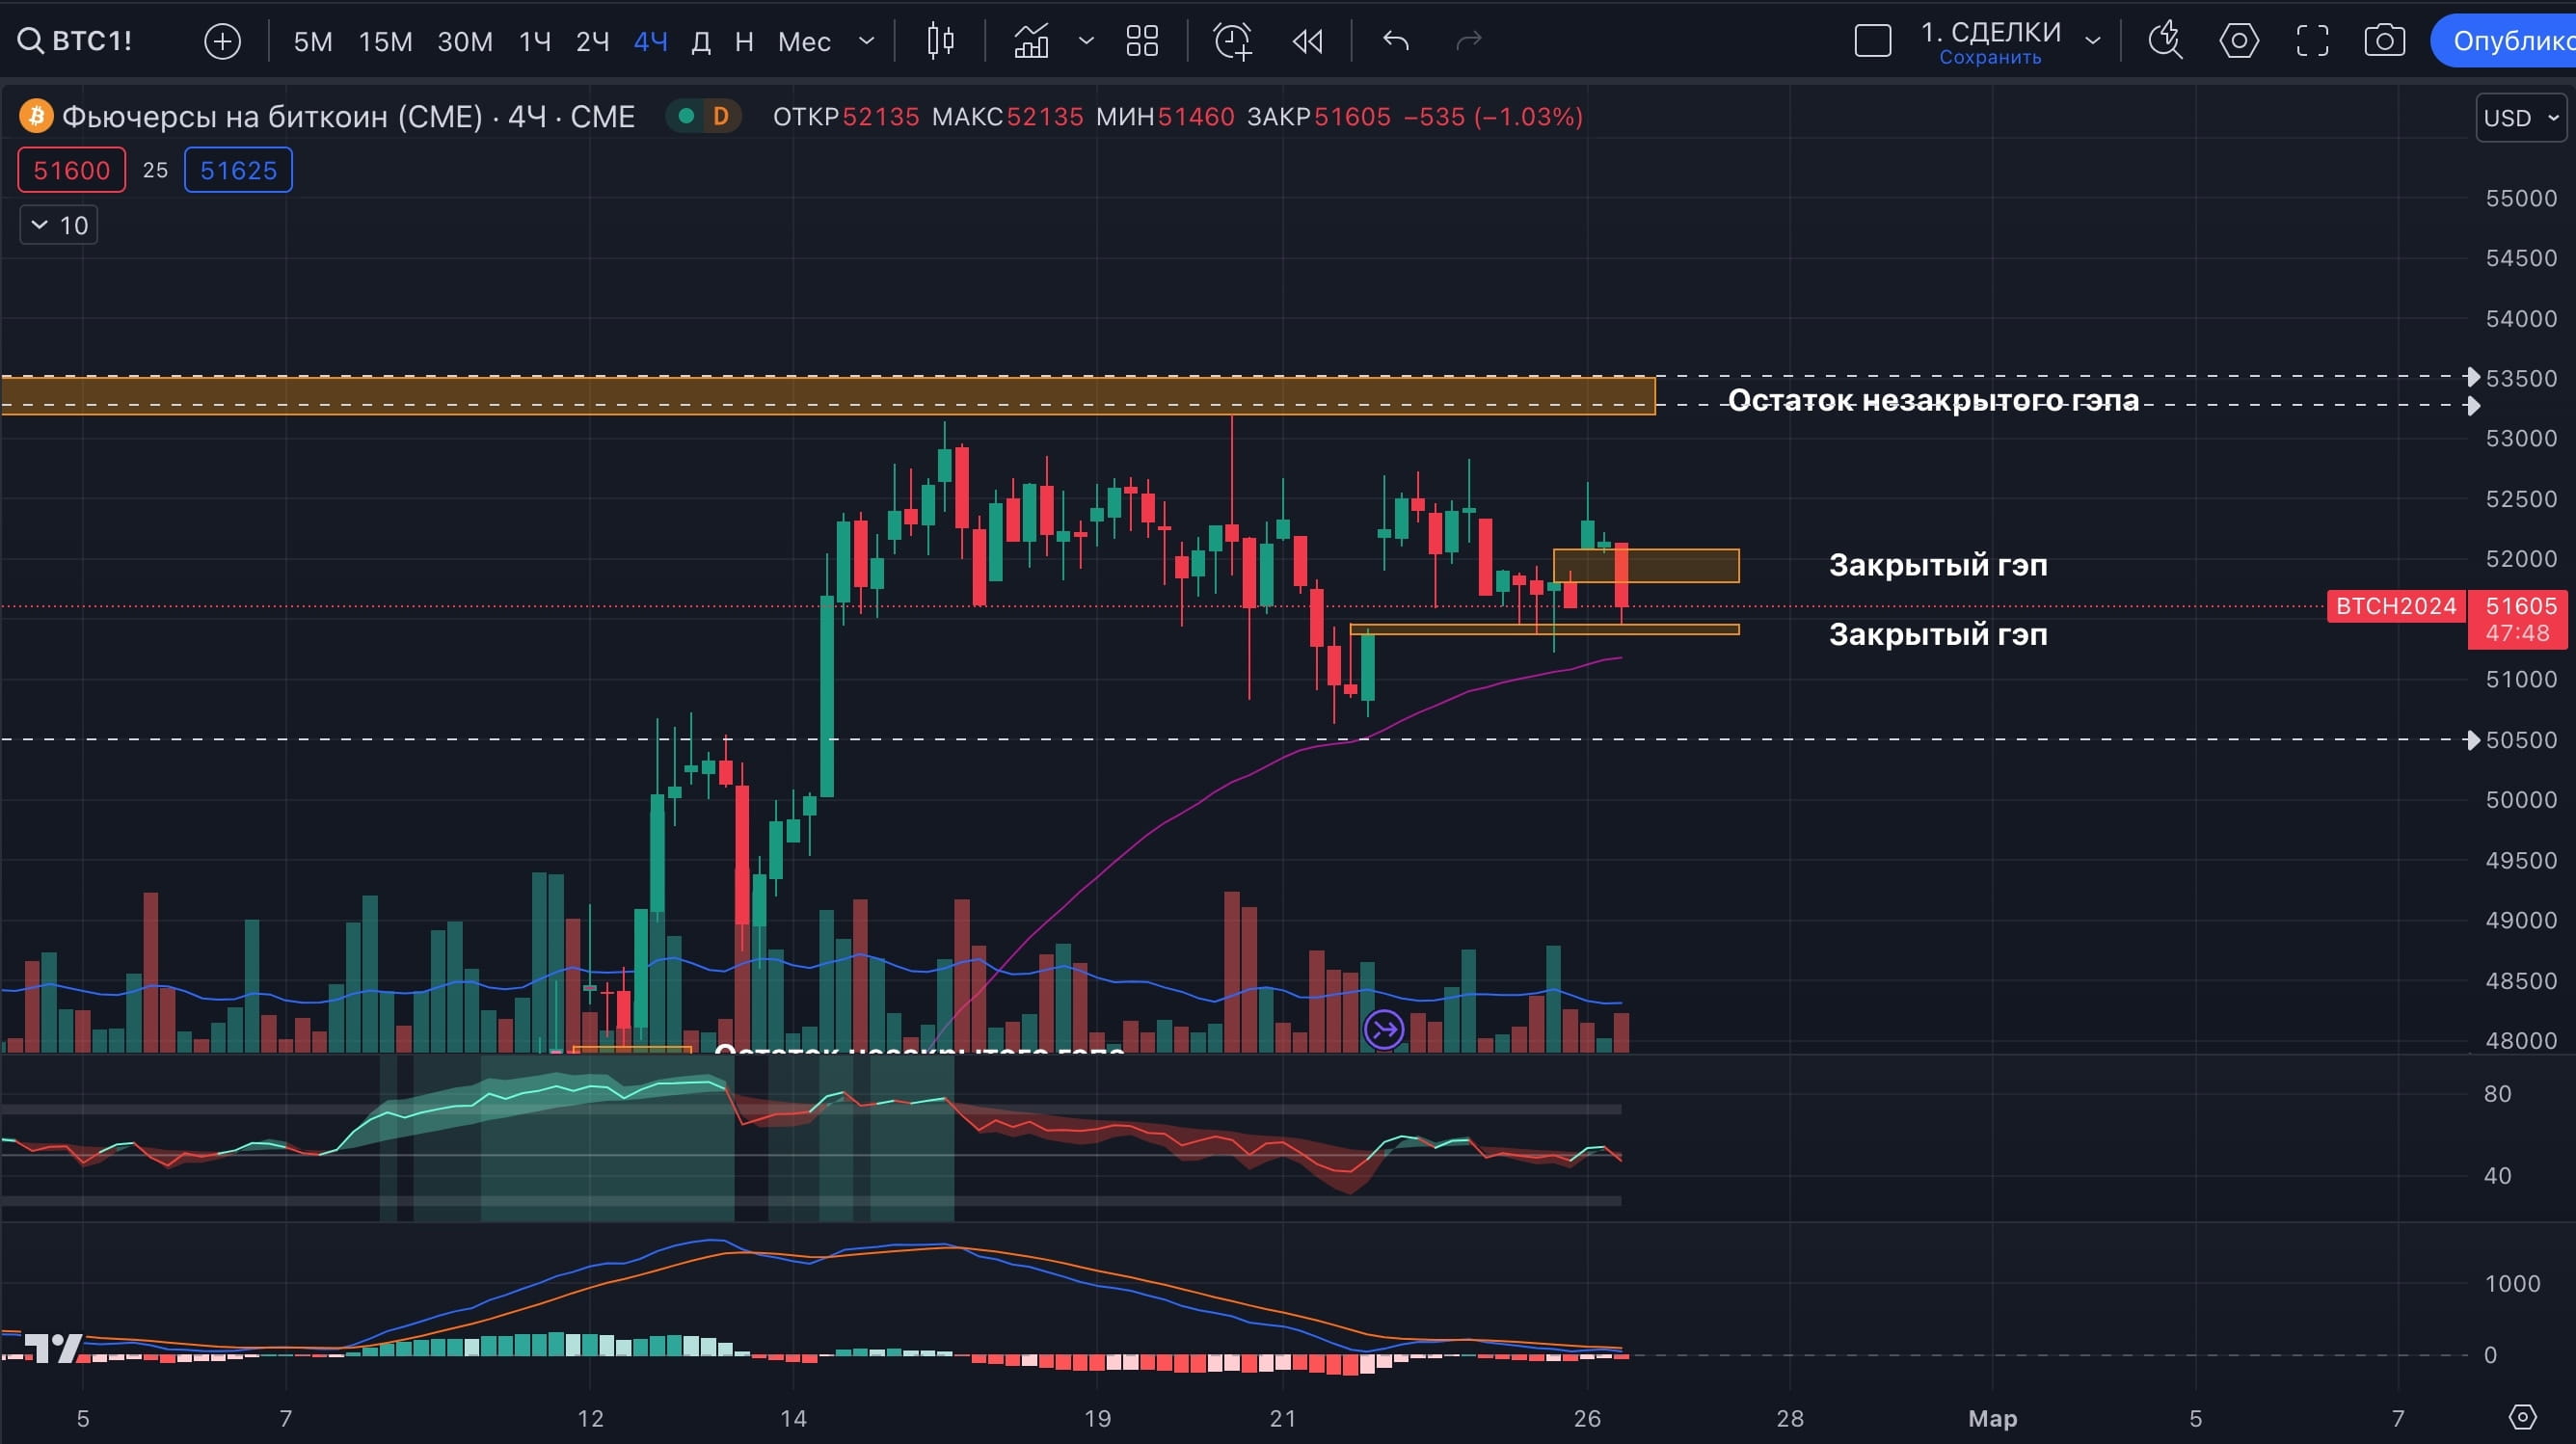
The BTC futures chart on the Chicago Mercantile Exchange still forces you to bet on the transition option:
- The unclosed gap is at the top, currently it is $53,200-53,500.
- Maintaining EMA 50 four-hour TF.
- Closed nearest gaps below. As part of today's correction, the gap of $51,805-$52,080 that formed over the weekend was closed.
- Greater activity of buyers there (price is traded above spot).
Now according to our vision of the local picture.
Since last Friday's review, the bulls have tried to restore the price above the volume level of $51,604, but have encountered two trend resistances - the upward trend since October 2023 (indicated by the dashed line) and the downward trend since February 15.
As was written on February 23 and earlier - while the price is below the volume level of $51,604, one of two scenarios is a priority:
RANGE: everything above the volumetric and specular level of $47,244 is the range and is not the beginning of a correction. From the volume levels of $50,312, $48,830, $47,244, a vigorous reversal and continuation of the uptrend may occur.
CORRECTION: we will talk about the beginning of a correction only when the body is fixed under $47,244, no younger than a four-hour candle, with a retest.
An additional signal for the development of one of the decline scenarios is now EMA 50 of the four-hour time frame. The price is below it. This is an important support/resistance for the coming days, which can help determine the further movement of the#BTCprice. While the price is lower, we go to EMA 200 of the four-hour TF, currently it is $48,051. This EMA is now the nearest key support. The next one is the EMA of the 50 day TF, currently $46,784. But it is growing quickly and by the time of the test it may be above $48,000.
Also for the correction/range with a wider range - RSI and MACD indicators on the daily, four-hour, two-hour TF. On the hourly and below - we are already talking about oversold, so we expect a local range/growth for some time. But rather as part of an unsuccessful test of the volume level of $51,604, rather than a breakout of this resistance.
