


Key Highlights
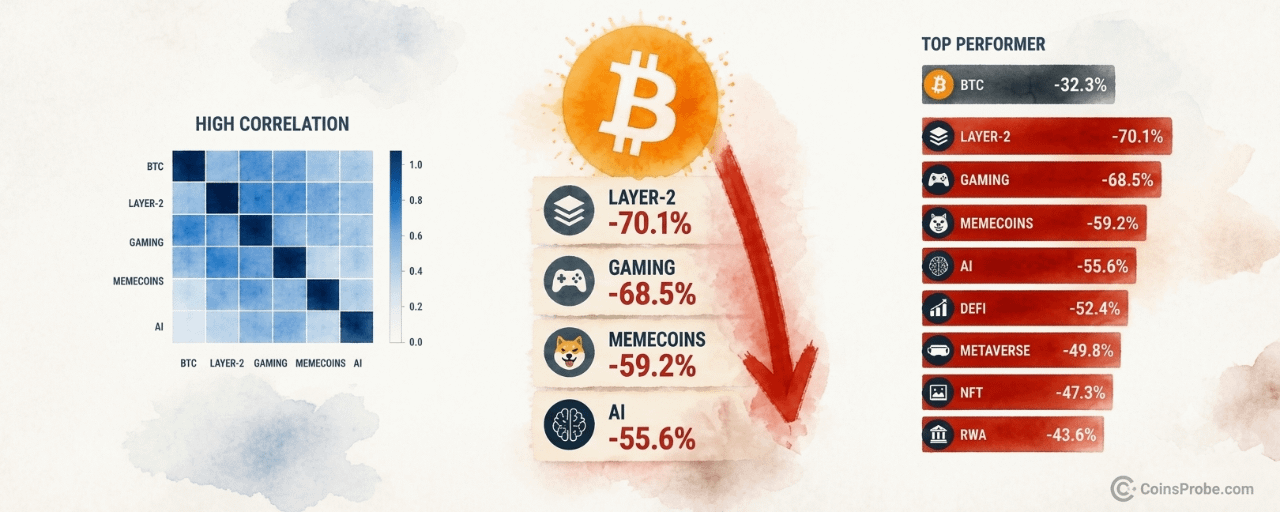
Bitcoin is down 32.3% over the past year — but every other tracked sector has lost more, with Layer-2 at −70.1% and Gaming at −68.5%
Alphractal's Correlation Heatmap shows altcoins have maintained high positive correlation to BTC throughout the 12-month period, amplifying losses
All 10 tracked crypto sectors posted negative 1-year returns as of November 19, 2026, per Alphractal sector indices
Bitcoin at $61,765 (−2.39% 24h) — the least-bad performer in a market where speculative narrative sectors suffered the deepest drawdowns
Bitcoin is trading at $61,765 — down 2.39% in the past 24 hours — and the broader altcoin market is not just following it lower. It is amplifying the losses. Over the past year, every tracked crypto sector has posted negative returns, with the most speculative corners of the market suffering drawdowns that dwarf Bitcoin’s own decline.
An analyst at Alphractal published a sector performance breakdown revealing the scale of that underperformance. The data, drawn from Alphractal’s proprietary sector indices, covers the 12-month window ending November 19, 2026, and shows a market in which Bitcoin is the least-bad asset — not a safe haven, but a relative floor beneath a collapsing altcoin structure.
Every Sector Is Negative — The 1-Year Scoreboard
The numbers are unambiguous. Across ten tracked sectors, not one has outperformed Bitcoin over the past year. The full 1-year breakdown, per Alphractal’s indices:
Sector 1-Year Return Layer-2 −70.1% Gaming −68.5% Memecoins −59.2% AI −55.6% RWA −58.5% Infrastructure −37.8% Layer-1 −43.9% DeFi −33.1% Privacy −30.5% Bitcoin −32.3%
Source: Alphractal Sector Indices, 1-year window ending Nov 19, 2026
The pattern is structurally significant. Layer-2 networks — once marketed as Ethereum’s scalability future and among the most heavily venture-backed categories of the 2021–2024 cycle — have shed 70.1% of their value relative to their position one year ago. Gaming tokens, which attracted billions in speculative capital during the NFT and play-to-earn boom, are down 68.5%. Even memecoins, structurally driven by retail speculation rather than fundamentals, are off 59.2% — a category that many assumed would outperform in a risk-on environment.
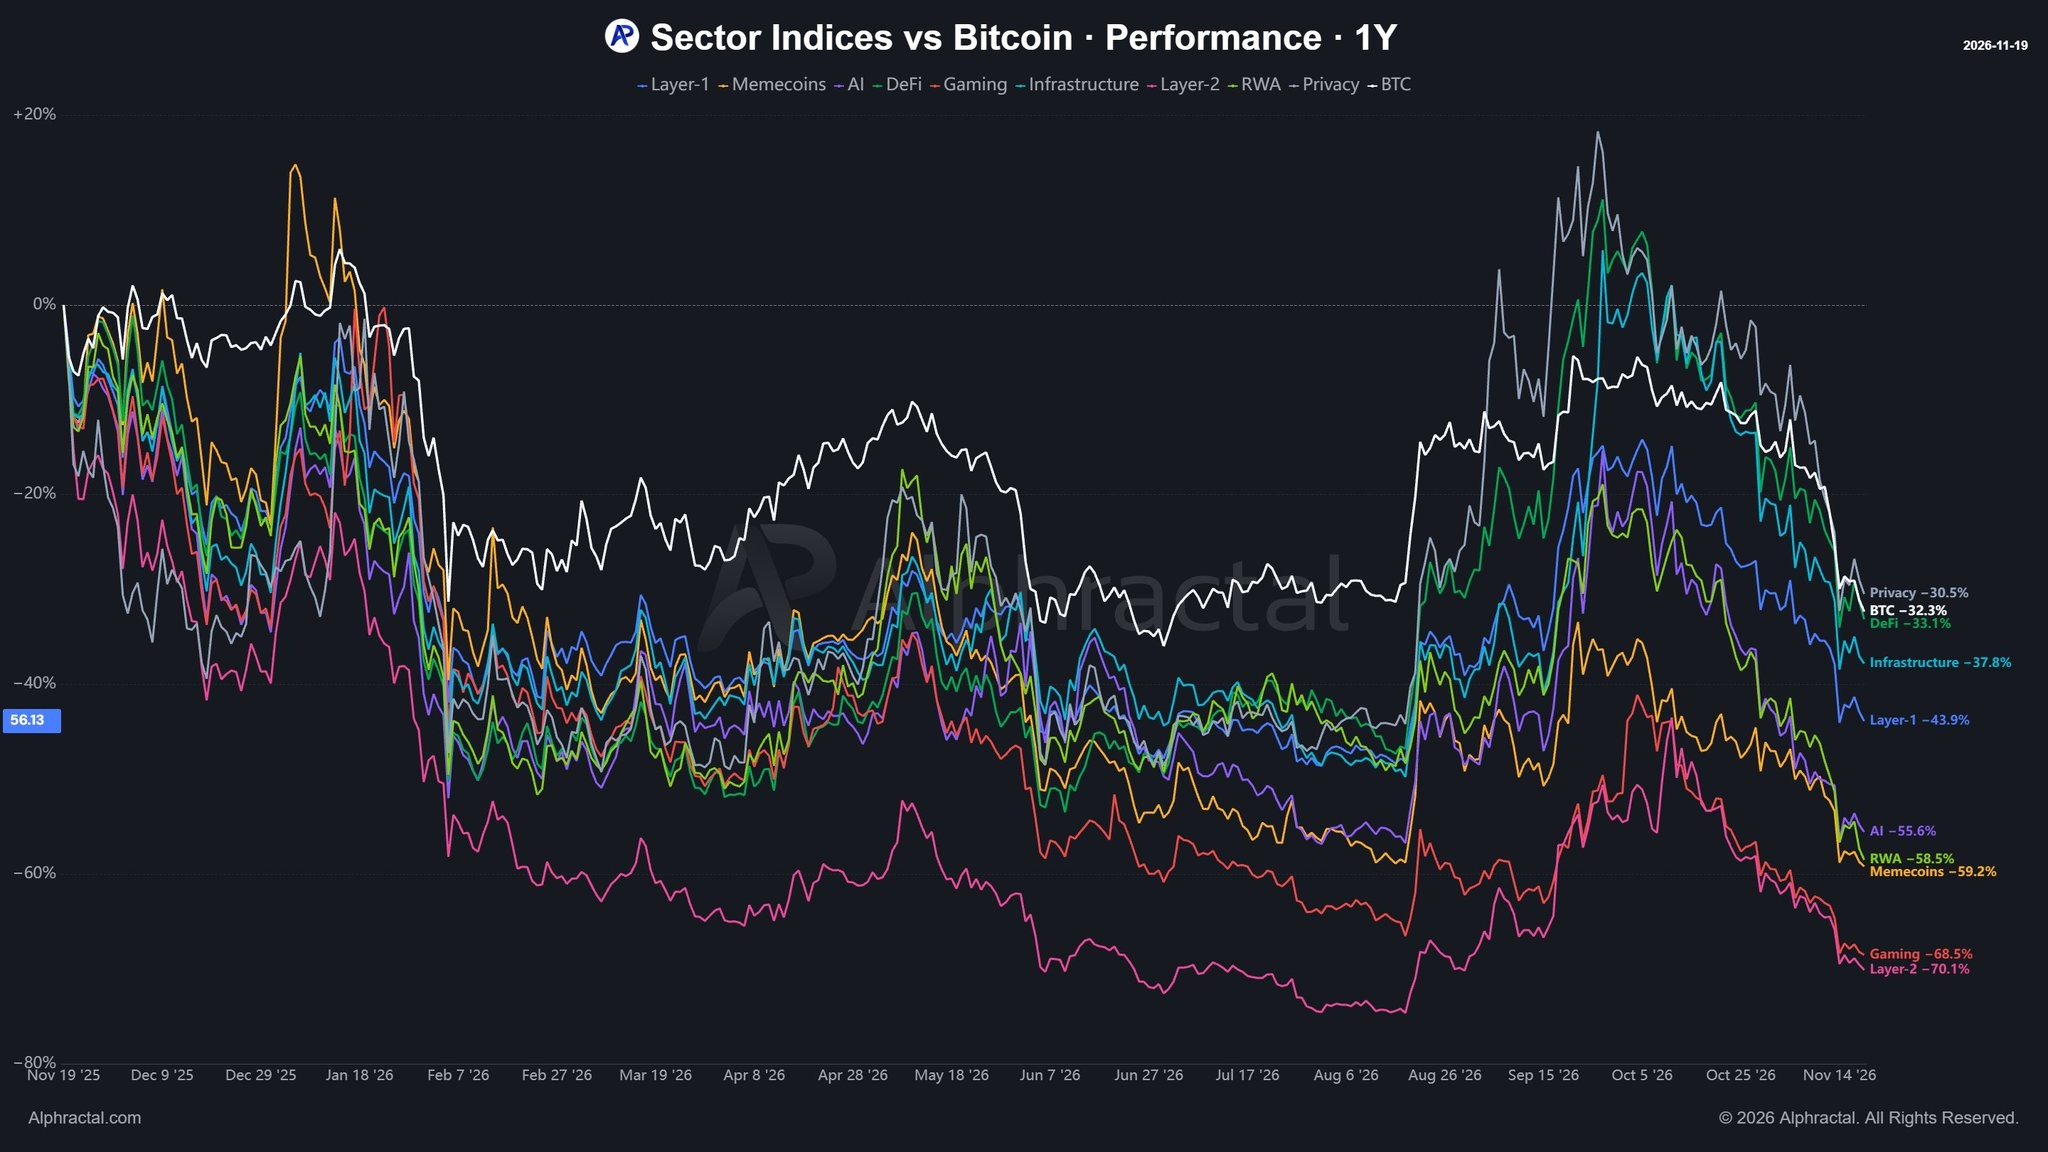
Sector Indices vs BTC Performance 1 Year | Source: @Alphractal (X)
The chart from Alphractal’s sector indices makes the picture visceral. All sector lines trend sharply downward from a mid-period spike (approximately August–September 2026), then resume their decline. Most sectors show a double-dip structure — a brief recovery in mid-year followed by renewed selling pressure that has pushed all indices to negative annual territory at the current endpoint. BTC, printed at −32.3%, sits at the top of this negative stack.
Altcoin Correlation — High When It Hurts
Alphractal’s Correlation Heatmap, displayed alongside the sector data, provides the structural explanation for why the losses are so synchronized. The heatmap — covering the top 50 cryptocurrencies against Bitcoin on a 12-hour, 14-period rolling basis from approximately April 2025 through October 2026 — shows predominantly blue coloring, indicating persistently high positive correlation between altcoins and BTC throughout the period.
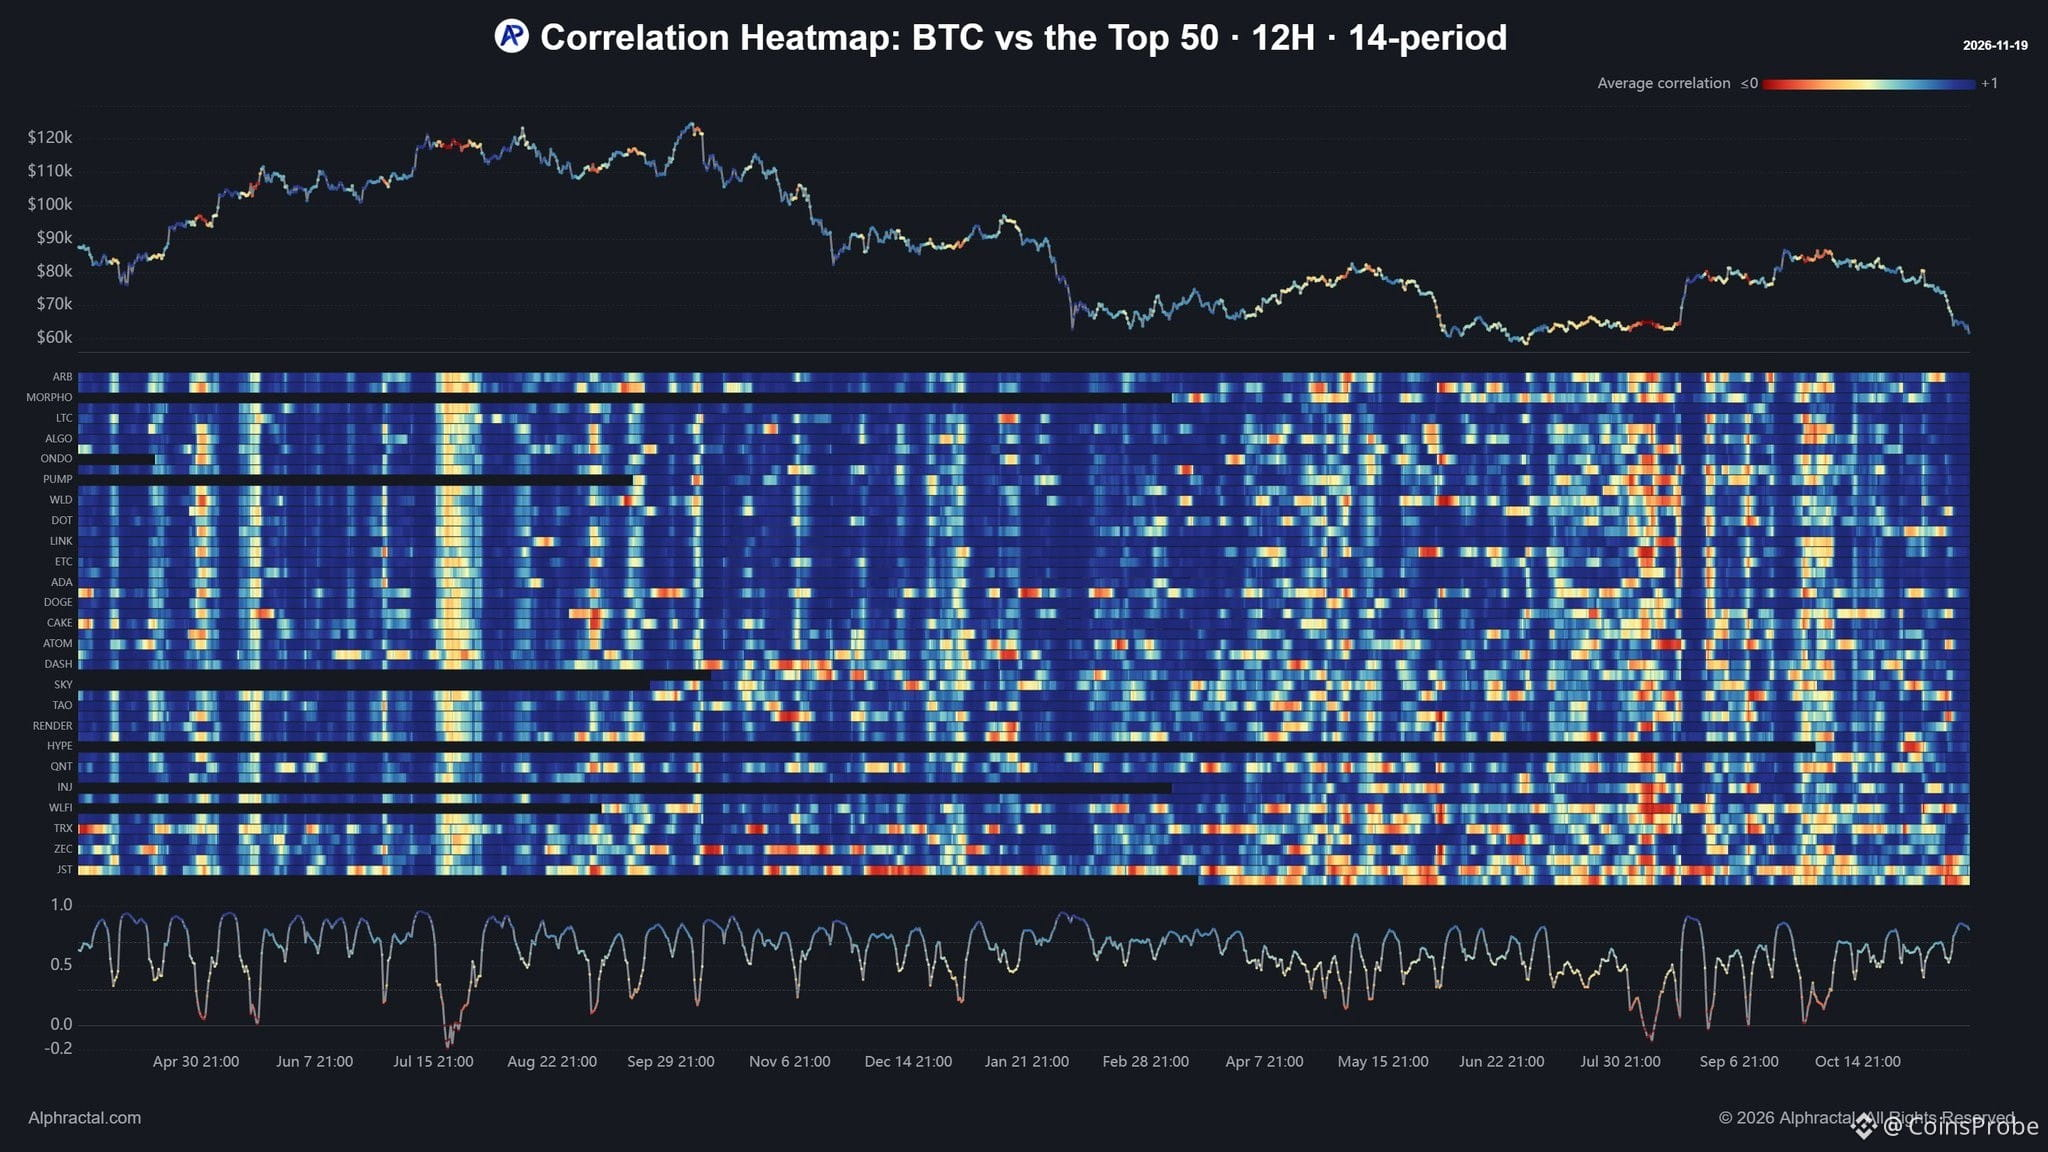
Corelation Heatmap | Source: @Alphractal (X)
Periodic clusters of red and orange appear, representing moments when correlation briefly decoupled — typically during localized altcoin rallies or sector-specific news events. But the dominant regime is clear: altcoins move with Bitcoin. When Bitcoin falls, they fall harder. The bottom panel of the heatmap oscillates between −0.2 and 1.0 with recurring dips, but the average reading trends firmly toward the high end of that range.
This is the correlation trap. High correlation during drawdowns means altcoin portfolios cannot hedge Bitcoin exposure through diversification — they simply take on magnified versions of the same directional move. The Layer-2 sector’s −70.1% versus Bitcoin’s −32.3% is not randomness. It is leverage without protection.
This dynamic connects directly to what TOTAL2’s breakdown of the same pattern that preceded Coinbase’s sell-off flagged earlier — altcoin aggregate capitalization breaking structure before equities reflected the stress.
What the Data Says — and What It Doesn’t
Alphractal’s data confirms sector underperformance as a documented, measurable fact across a full 12-month window. It does not project forward returns, identify reversal levels, or prescribe a rotation strategy. What it does establish is a baseline: entering this period with equal-weighted altcoin exposure versus a Bitcoin-only position produced losses between 1.4x and 2.2x worse depending on sector.
The correlation heatmap further confirms that this underperformance was not offset by uncorrelated upside. It was simply amplified downside. Periods of red and orange on the heatmap — where correlation dropped — did not rescue sector performance on a 12-month basis. The brief August–September 2026 spike visible in the sector chart was not a sustained decoupling. It was a temporary compression before the next leg lower.
For anyone tracking Bitcoin’s buy/sell pressure delta, the sector data provides the altcoin dimension of that same pressure imbalance — sellers have remained structurally dominant across every category for twelve consecutive months.
The Hierarchy of Losses — What It Implies About Risk Appetite
Reading the sector table from bottom to top reveals something important about where speculative capital flows during drawdowns. Privacy (−30.5%) and DeFi (−33.1%) sit closest to Bitcoin’s own loss. These are older, more established categories with real use cases and persistent user bases. Infrastructure (−37.8%) follows.
The deepest losses cluster at the narrative end of the spectrum — AI (−55.6%), RWA (−58.5%), Memecoins (−59.2%), Gaming (−68.5%), and Layer-2 (−70.1%). These are categories that attracted capital primarily on forward-looking narratives rather than current revenue or utility. As liquidity contracted over the past year, these narratives were repriced most aggressively.
This ordering is not coincidental. It reflects a market in which speculative premium is the first cost to be eliminated during a sustained downturn. The further a sector sat from current cash flow or demonstrable utility, the larger its drawdown relative to Bitcoin.
The same rotation logic applies to AI-adjacent assets across categories — where the gap between narrative and realized value is widest, the compression is most severe.
Where This Leaves the Market
Twelve months of continuous sector underperformance, documented across ten categories, with high altcoin-to-Bitcoin correlation throughout, produces a structurally clear picture. Bitcoin is not the solution to altcoin weakness — it is the floor beneath it. When the floor is itself down 32.3%, the sectors built on top of that floor are down between 30% and 70% more.
The Alphractal Correlation Heatmap shows that this relationship has been stable. It has not broken down in altcoins’ favor in any sustained way across the measurement period. Until that changes — until the heatmap shows a durable shift away from high correlation during Bitcoin’s own recoveries — the mathematical structure of altcoin returns relative to BTC remains unfavorable.
At $61,765, Bitcoin is itself in negative annual territory at −32.3%. Any sustained altcoin recovery requires, at minimum, Bitcoin stabilization. The data from Alphractal does not suggest that stabilization has arrived. The sector lines remain below their mid-period highs with no recovery visible at the chart’s current endpoint. Watch Bitcoin’s ability to hold the $61,765 level — a sustained breakdown from here would apply the same amplification factor that produced Layer-2’s −70.1% to whatever downside follows.
Disclaimer: The views and analysis presented in this article are for informational purposes only and reflect the author’s perspective, not financial advice. Technical patterns and indicators discussed are subject to market volatility and may or may not yield the anticipated results. Investors are advised to exercise caution, conduct independent research, and make decisions aligned with their individual risk tolerance.