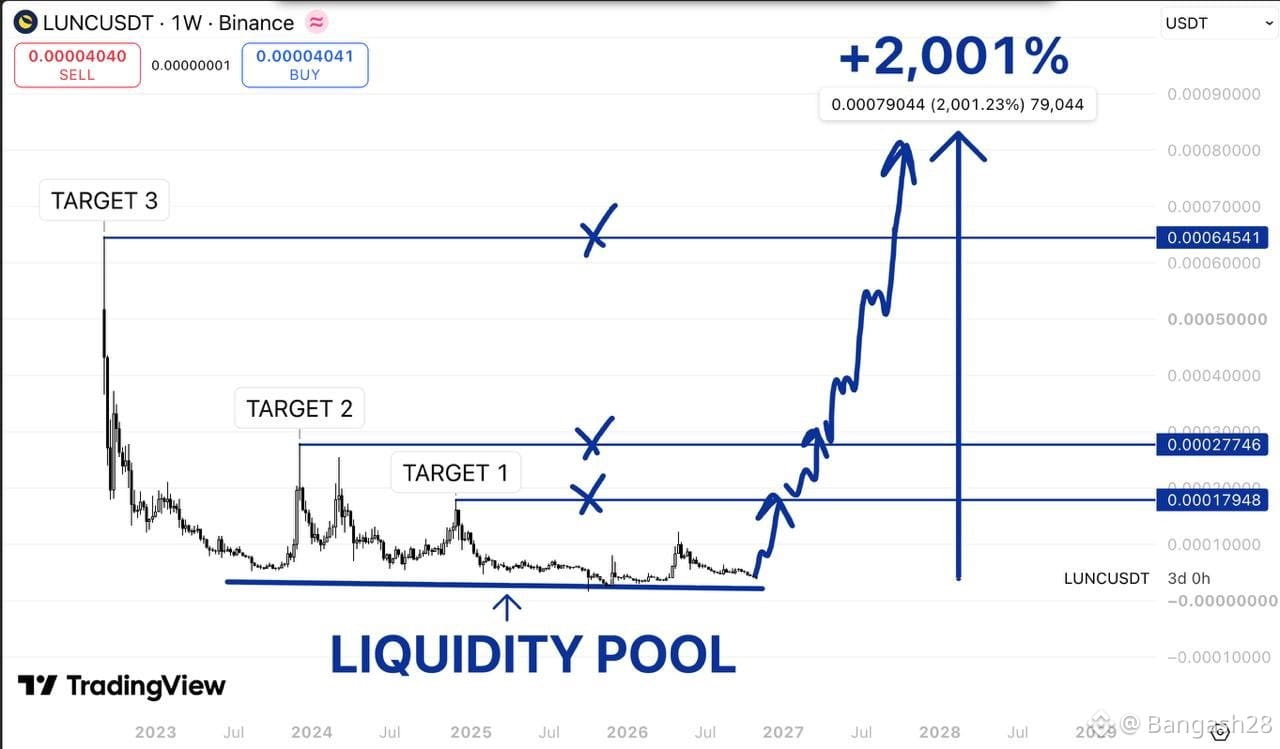
$LUNC is the kind of chart that makes people laugh before they even look at it.
And to be fair, I understand why.
Years of selling, failed rallies, and a price sitting around $0.00004.
But here's what caught my attention.
The weekly chart is testing the same support region
that's held through multiple cycles.
If buyers finally take control
I'm watching $0.00018 first
followed by $0.00028 and $0.00065.
The $0.00083 scenario would mean roughly 2,000% upside.
Sounds ridiculous. And it's definitely speculative.
But the real question isn't whether $LUNC can do a 20x.
It's whether this base is actually accumulation
or just another stop on the way down.
#LUNC✅ #LUNCDream #LUNCUSD #LUNCDream #Lunc2TheMoonSoon
$LUNC
And to be fair, I understand why.
Years of selling, failed rallies, and a price sitting around $0.00004.
But here's what caught my attention.
The weekly chart is testing the same support region
that's held through multiple cycles.
If buyers finally take control
I'm watching $0.00018 first
followed by $0.00028 and $0.00065.
The $0.00083 scenario would mean roughly 2,000% upside.
Sounds ridiculous. And it's definitely speculative.
But the real question isn't whether $LUNC can do a 20x.
It's whether this base is actually accumulation
or just another stop on the way down.
#LUNC✅ #LUNCDream #LUNCUSD #LUNCDream #Lunc2TheMoonSoon
$LUNC