One Web3 mini-comic every day. Follow me so you don’t get lost 👇
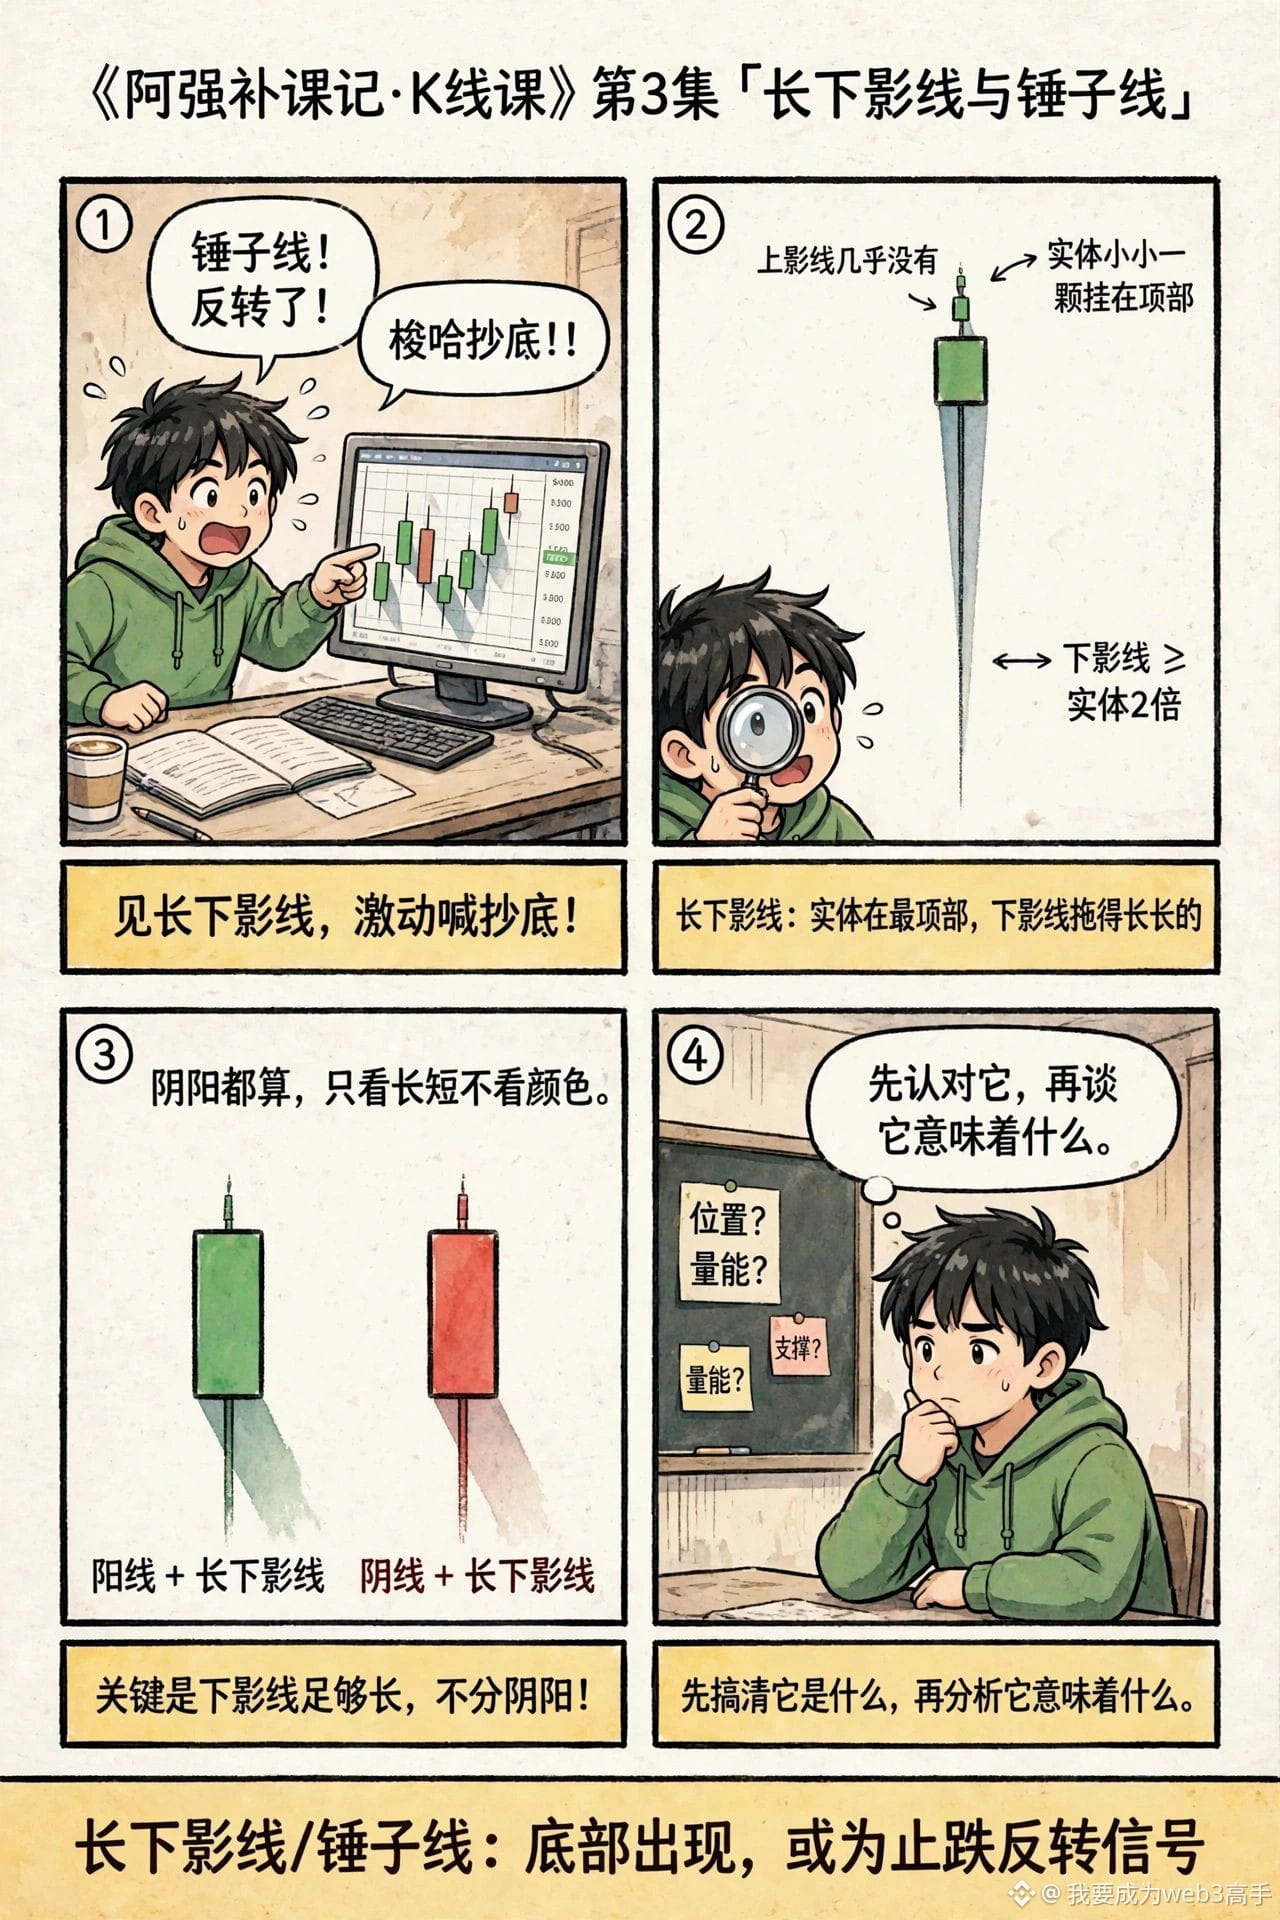
“Qiang’s Tutoring Diary · Candlestick Lesson,” Episode 3: Long Lower Shadows and Hammer Candles
How to spot them: A candlestick with a long “tail” hanging down from its body. The lower shadow is generally at least twice the length of the body. The tiny body sits near the top, with almost no upper shadow. Look at the shadow’s length, not its color—bullish and bearish candles both count.
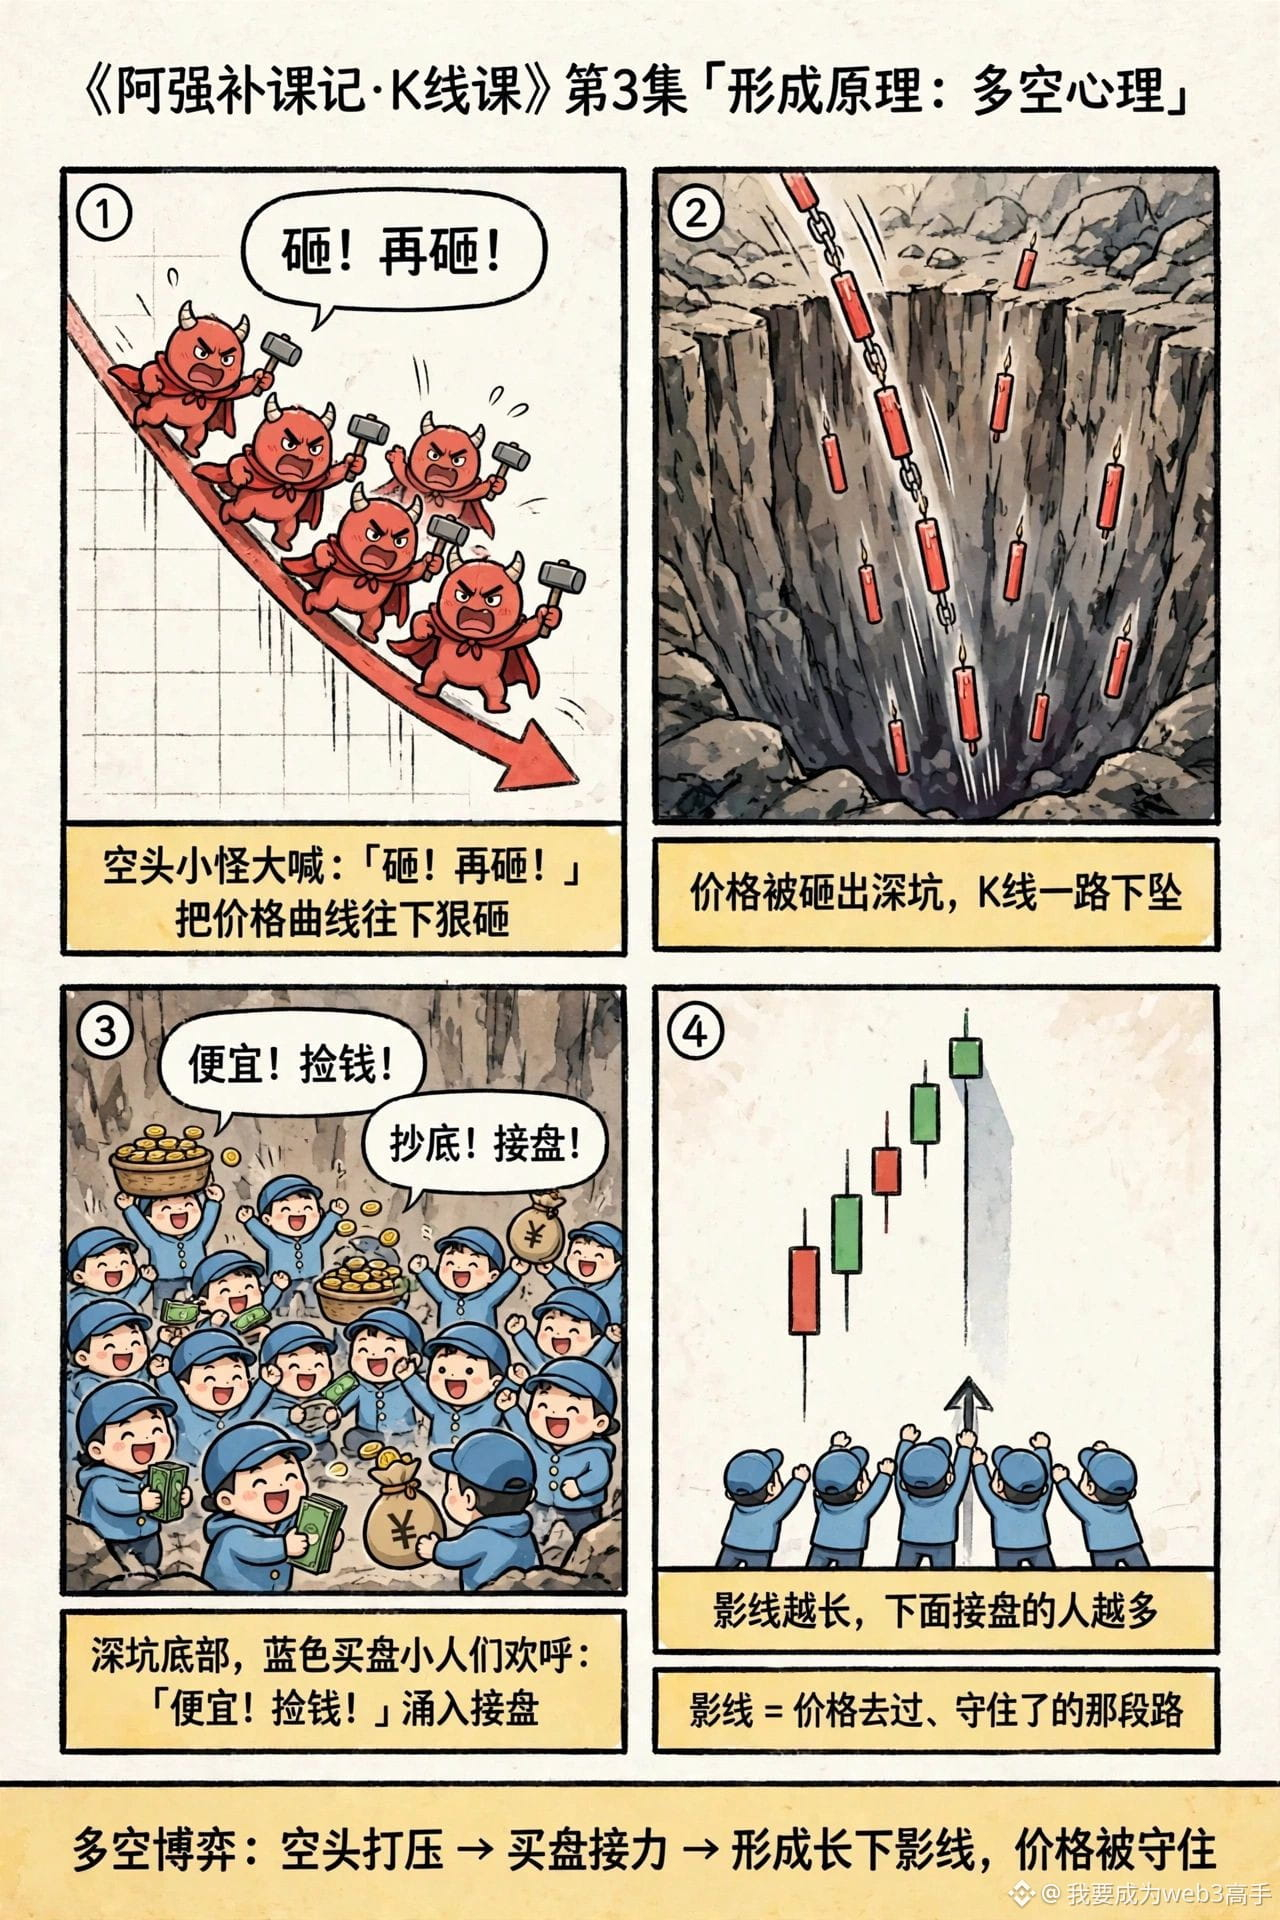
How they form: During the session, sellers slam the price down, driving it into a deep trough. At the bottom, a bunch of buyers are waiting to scoop up a bargain, and they push the price back up. The shadow marks the stretch where “the price went down, but held”—the more buyers waiting below, the longer the shadow.
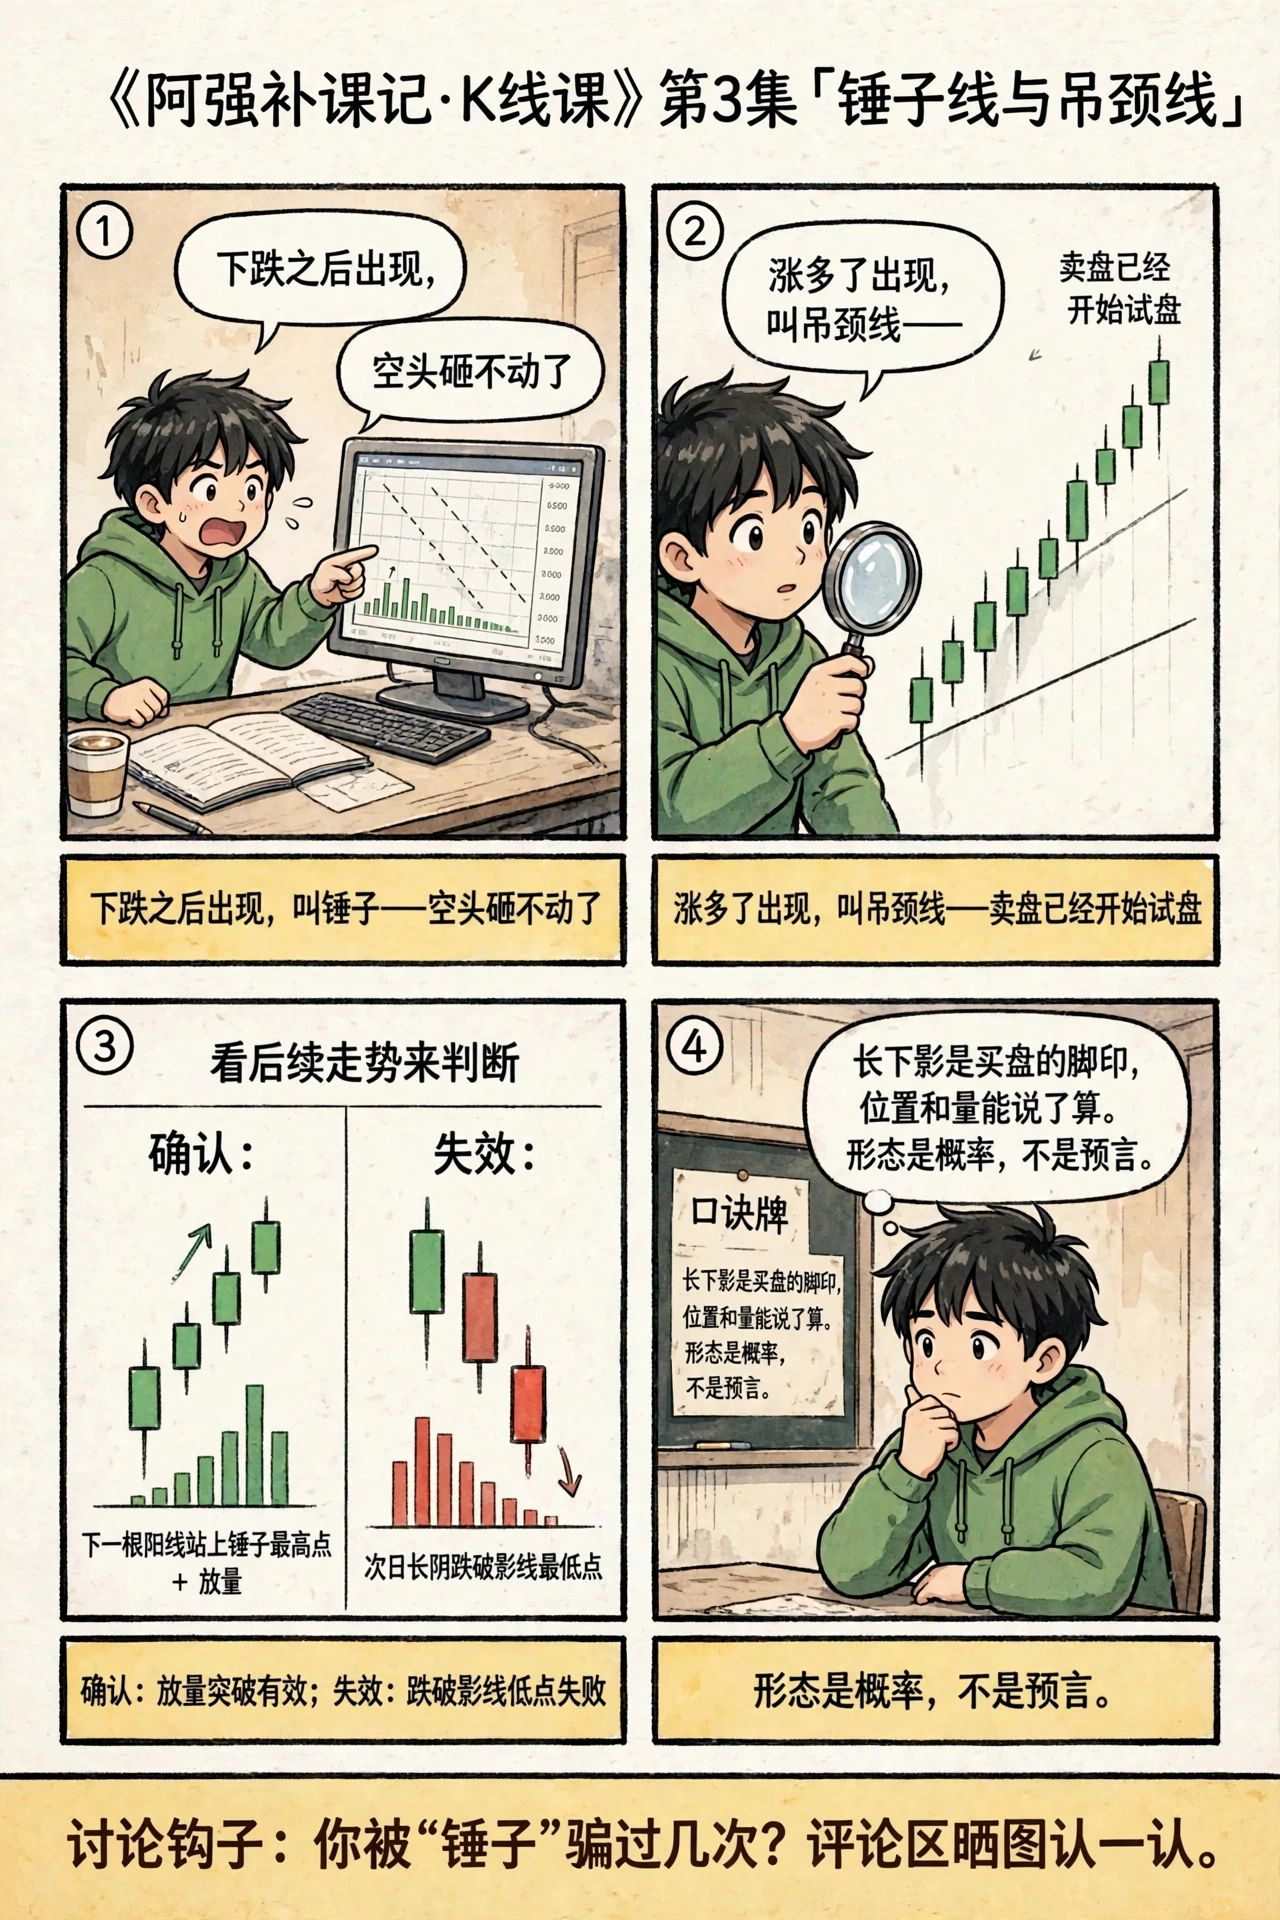
Meaning depends on where it appears: After a prolonged decline, it’s called a hammer—a sign that sellers are running out of steam and the price may stop falling. After a big rally, it’s called a hanging man. Selling pressure is starting to test the waters, so be careful.
Confirmation: One candle alone doesn’t count. A reversal is confirmed only if the next bullish candle rises above the hammer’s high, ideally accompanied by increased volume.
What invalidates it: The next day, a long bearish candle breaks straight below the shadow’s low—the buying support gets swallowed up, leaving all the bargain hunters trapped.
Remember: A long lower shadow is a footprint left by buyers. Its position and volume tell the story. Patterns are probabilities, not predictions.
How many times have you been fooled by a “hammer”? Share a chart in the comments and let’s take a look.
$BTC $ETH $BNB