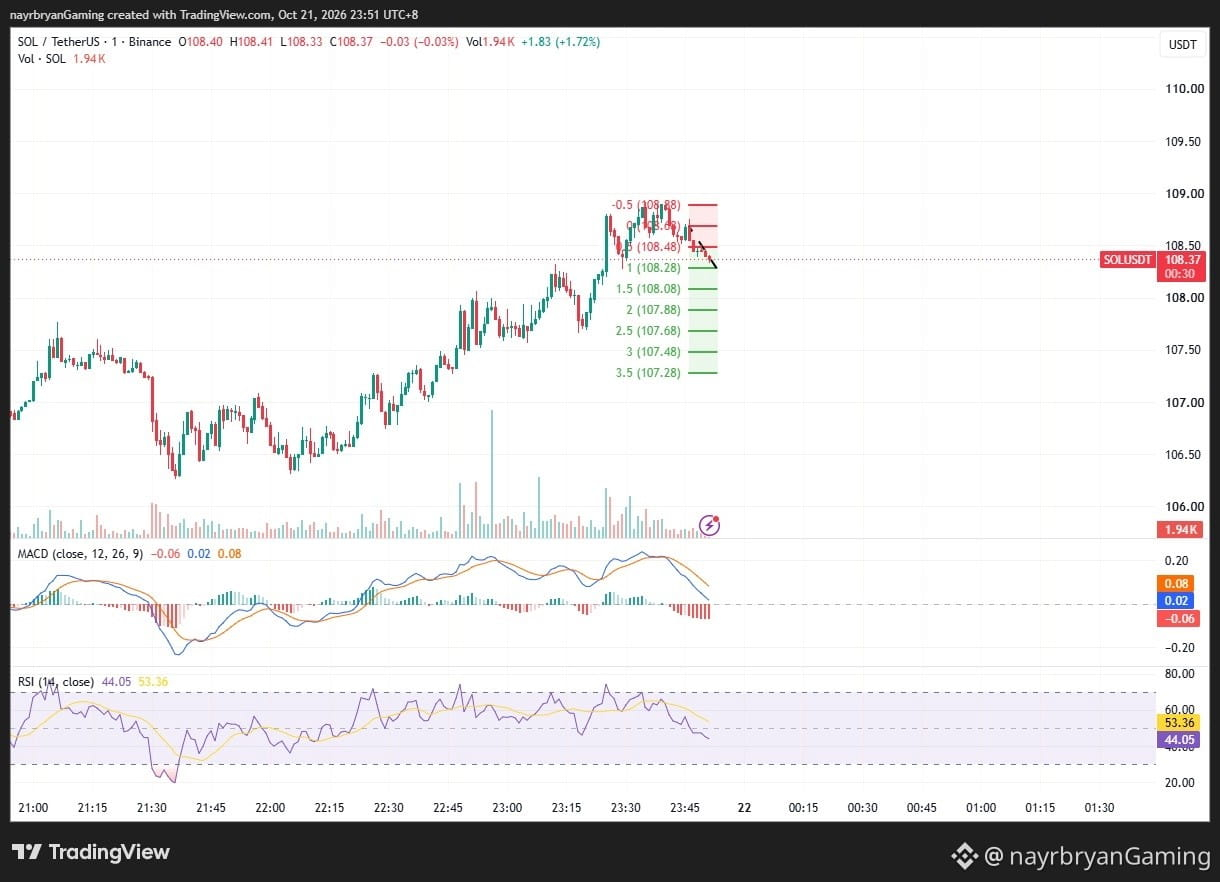
DAILY SIGNAL — SOL/USDT
Date: 21 Oct 2026
Chart Time: 23:51 UTC+8
Timeframe: 1m
Intraday Bias: Bullish channel → short-term pullback
---
📊 Market Bias
SOL is trading around 108.42 after a strong recovery inside an ascending channel.
Price recently rejected the 108.80–108.88 resistance area and pulled back toward the lower portion of the short-term structure.
The latest candles show weakening upside momentum. MACD has turned bearish, while RSI is around 46.26, below its moving average near 53.52.
The immediate focus is whether SOL can stabilize above 108.28 or whether the pullback extends toward the lower Fibonacci extensions.
---
🔹 Key Levels From Chart
Current Price: 108.42
Immediate Resistance: 108.48–108.68
Major Resistance: 108.80–108.88
Key Support: 108.28
Next Support: 108.08
Major Structure Zone: 107.68–107.88
---
🎯 Fibonacci Levels
Upside Recovery Levels:
TP1 → 108.48 (0.5 Fib)
TP2 → 108.68 (0 Fib)
TP3 → 108.88 (-0.5 Fib / resistance area)
Downside Extensions:
TP1 → 108.28 (1.0 Fib)
TP2 → 108.08 (1.5 Fib)
TP3 → 107.88 (2.0 Fib)
TP4 → 107.68 (2.5 Fib)
TP5 → 107.48 (3.0 Fib)
TP6 → 107.28 (3.5 Fib)
These are chart reference levels, not guaranteed price targets.
---
📈 Technical Breakdown
SOL advanced through a series of higher highs and higher lows inside the ascending channel.
However, the rejection near 108.80–108.88 has weakened the immediate bullish momentum.
MACD is rolling over, with the MACD line below the signal line and a negative histogram. RSI has fallen to approximately 46.26, indicating that short-term momentum has shifted toward sellers.
A sustained breakdown of the lower channel would weaken the broader short-term bullish structure.
---
🧠 Quick Insight
“A strong trend can survive a pullback, but every recovery must prove itself at resistance.”
---
⚠️ Disclaimer
This is personal chart analysis for educational purposes only, not financial advice.
Always DYOR / DYODD, define your invalidation before entering, and manage risk responsibly.
— @nayrbryanGaming
#SOL #SOLUSDT #Binance