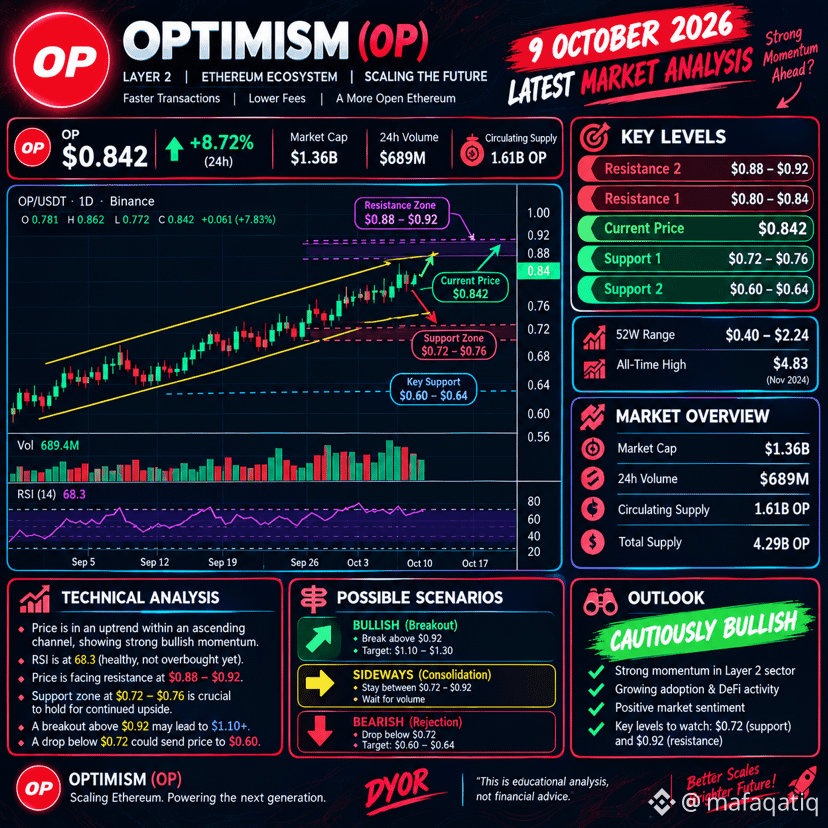
$OP — Latest Market Analysis
9 October 2026 · Market data and technical levels
Current price: ~$0.123
24-hour change: approximately +3.3%
Market trend: Short-term recovery, but longer-term weakness remains. 
Key levels
Support 1: $0.115
Support 2: $0.110
Resistance 1: $0.125
Resistance 2: $0.133
Higher resistance: $0.142 
Possible scenarios
📈 Bullish: A sustained move above $0.125 could strengthen the recovery.
➡️ Sideways: Price may consolidate if it stays between support and resistance.
📉 Bearish: A daily close below $0.115 would weaken the short-term outlook, with $0.110 as the next level to watch. 
Technical outlook
Daily indicators showed a bullish short-term bias, while weekly signals remained bearish. This mixed picture means the recovery is not yet confirmation of a longer-term trend reversal. 
Note: The earlier graphic showed a price of $0.842 and levels such as $0.72–$0.92. Those figures do not match the latest market data and should not be used. The current price is around $0.123, so the levels above are the more relevant reference.
#FedMinutesFocusOnOctoberPause #IMFSaysTokenizedMarketsSmall #VitalikWarnsAICouldWeakenCryptographySecurity #BitcoinDipsBelow$81K
9 October 2026 · Market data and technical levels
Current price: ~$0.123
24-hour change: approximately +3.3%
Market trend: Short-term recovery, but longer-term weakness remains. 
Key levels
Support 1: $0.115
Support 2: $0.110
Resistance 1: $0.125
Resistance 2: $0.133
Higher resistance: $0.142 
Possible scenarios
📈 Bullish: A sustained move above $0.125 could strengthen the recovery.
➡️ Sideways: Price may consolidate if it stays between support and resistance.
📉 Bearish: A daily close below $0.115 would weaken the short-term outlook, with $0.110 as the next level to watch. 
Technical outlook
Daily indicators showed a bullish short-term bias, while weekly signals remained bearish. This mixed picture means the recovery is not yet confirmation of a longer-term trend reversal. 
Note: The earlier graphic showed a price of $0.842 and levels such as $0.72–$0.92. Those figures do not match the latest market data and should not be used. The current price is around $0.123, so the levels above are the more relevant reference.
#FedMinutesFocusOnOctoberPause #IMFSaysTokenizedMarketsSmall #VitalikWarnsAICouldWeakenCryptographySecurity #BitcoinDipsBelow$81K