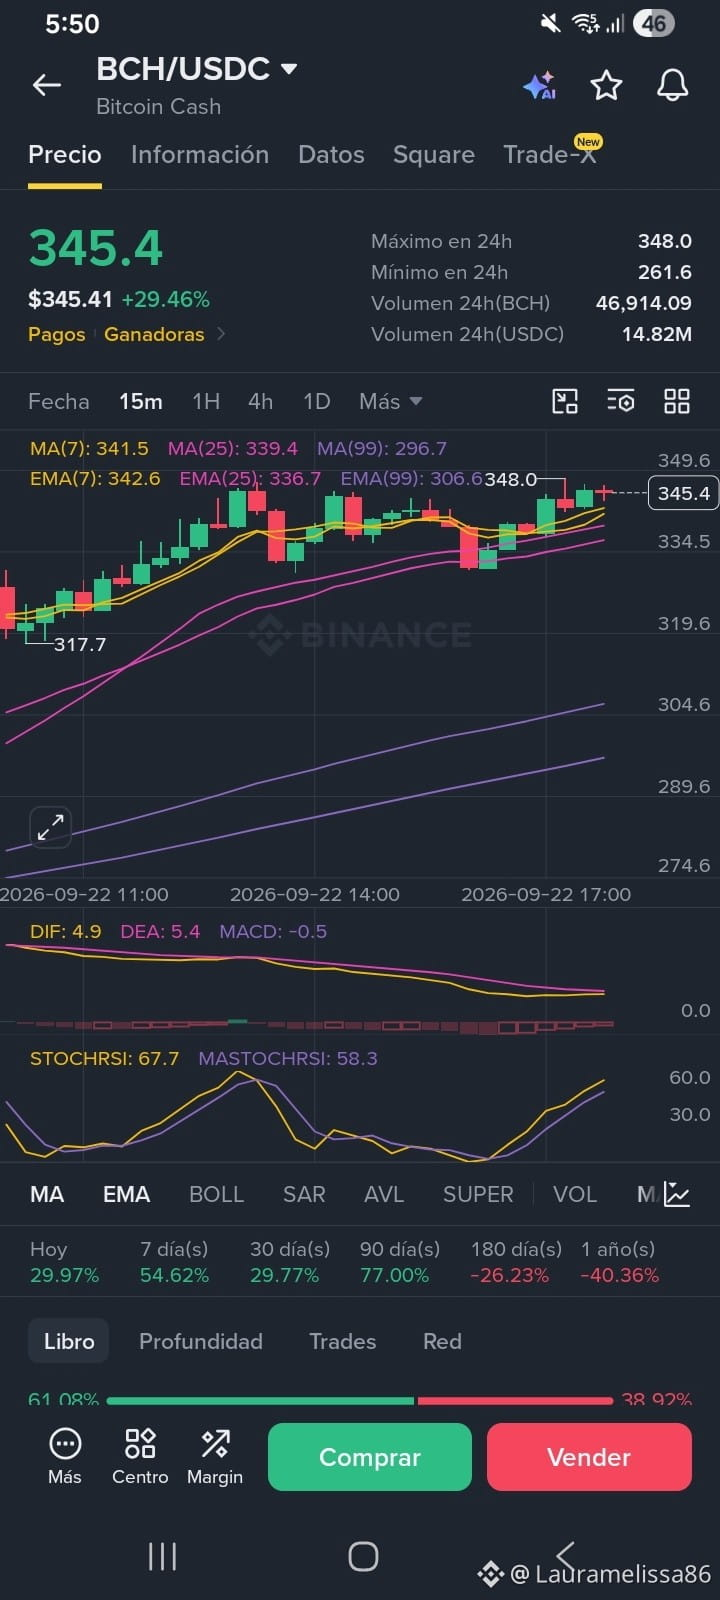
Why is it so important to read charts?
Reading charts—what we technically call Technical Analysis—is essential because it lets you make decisions based on data and the market’s real behavior, reducing improvisation and emotions when trading.
When you look at a chart, you’re not just seeing lines or candles going up and down; you’re seeing the collective psychology of all market participants projected over time.
1. Discover who has control (Trend)
The most basic principle of the market is to trade in the direction of the current.
Bullish trend: You spot higher highs and higher lows.
Bearish trend: You spot lower highs and lower lows, alerting you not to enter blindly while looking for a "floor."
2. Identify key supply and demand zones (Support and Resistance)
Charts reveal levels where price has historically reacted.
Supports: "Floor" zones where buyers often step in with strength because they believe the price is cheap.
Resistances: "Ceiling" zones where supply (sellers) usually stops the price from rising.
Knowing where these levels are prevents you from making the classic mistake of buying right at a resistance or selling right at a support.
3. Manage risk in a mathematical way
A chart gives you the structure you need to define your risk management plan.
Entry point: Wait for the price to confirm a structure instead of entering on impulse.
Stop-Loss: Identify the exact technical level where your analysis hypothesis is no longer valid, so you can close the trade with a small, controlled loss.
Take-Profit target: Project how far the price can go based on the next resistance or technical extension...
$BCH #XRP
Reading charts—what we technically call Technical Analysis—is essential because it lets you make decisions based on data and the market’s real behavior, reducing improvisation and emotions when trading.
When you look at a chart, you’re not just seeing lines or candles going up and down; you’re seeing the collective psychology of all market participants projected over time.
1. Discover who has control (Trend)
The most basic principle of the market is to trade in the direction of the current.
Bullish trend: You spot higher highs and higher lows.
Bearish trend: You spot lower highs and lower lows, alerting you not to enter blindly while looking for a "floor."
2. Identify key supply and demand zones (Support and Resistance)
Charts reveal levels where price has historically reacted.
Supports: "Floor" zones where buyers often step in with strength because they believe the price is cheap.
Resistances: "Ceiling" zones where supply (sellers) usually stops the price from rising.
Knowing where these levels are prevents you from making the classic mistake of buying right at a resistance or selling right at a support.
3. Manage risk in a mathematical way
A chart gives you the structure you need to define your risk management plan.
Entry point: Wait for the price to confirm a structure instead of entering on impulse.
Stop-Loss: Identify the exact technical level where your analysis hypothesis is no longer valid, so you can close the trade with a small, controlled loss.
Take-Profit target: Project how far the price can go based on the next resistance or technical extension...
$BCH #XRP