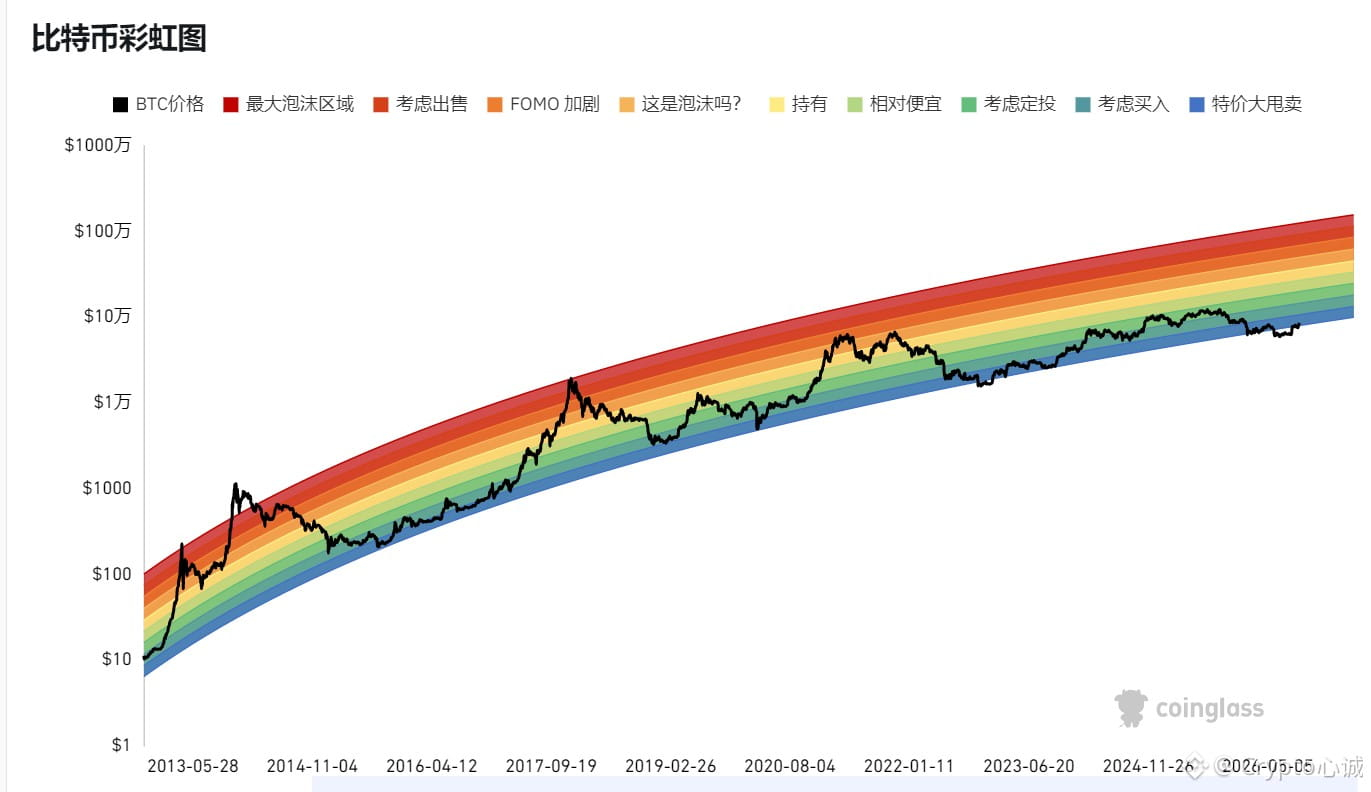
How long has it been since you last saw a rainbow chart? 😇
Although Bitcoin has risen from 57,800 to 87,300—an exact 50% increase—according to the rainbow chart, it is still in the special sale zone. Based on the cycle from 2021, this kind of position is typically when you would buy. But does the rainbow chart still apply to the current market? If you have done any research, please feel free to discuss.
$BTC
$ETH
Although Bitcoin has risen from 57,800 to 87,300—an exact 50% increase—according to the rainbow chart, it is still in the special sale zone. Based on the cycle from 2021, this kind of position is typically when you would buy. But does the rainbow chart still apply to the current market? If you have done any research, please feel free to discuss.
$BTC
$ETH