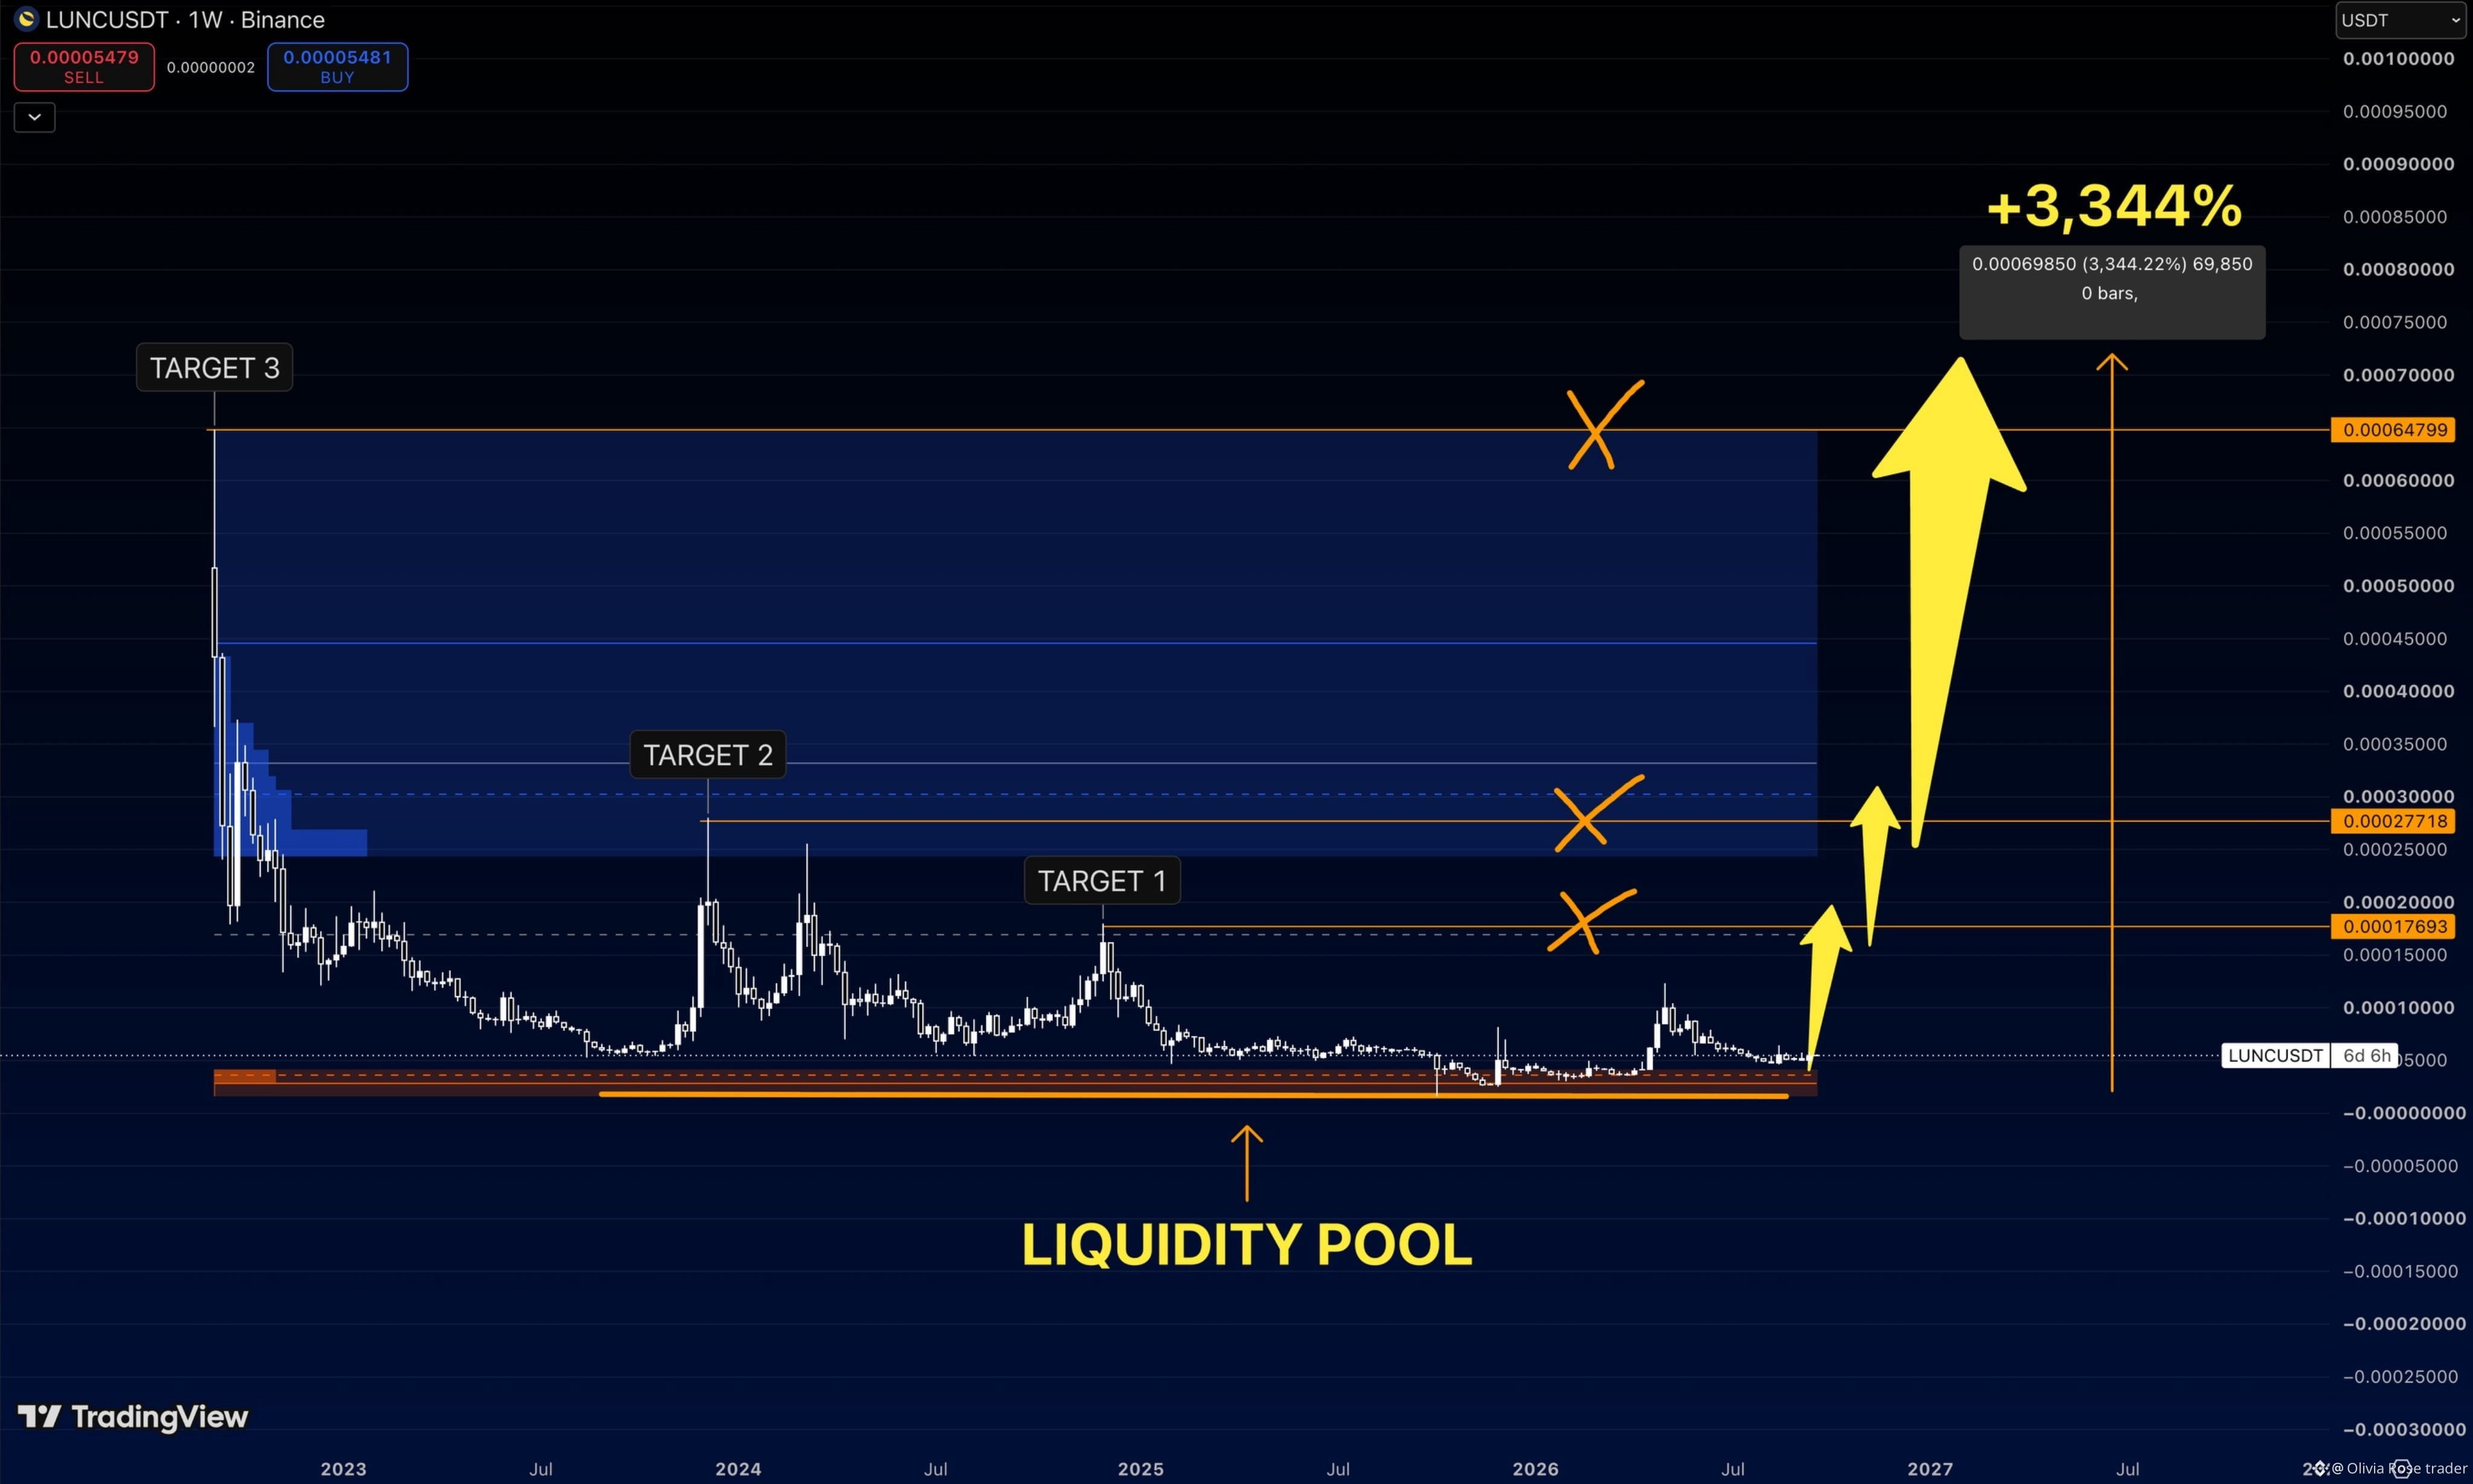
$LUNC is basically sitting where nobody wants to touch it.
And that’s exactly what makes this chart interesting.
For almost 4 years, price has kept returning to the same liquidity pool.
Now look at what’s sitting above:
$0.00017693
$0.00027718
$0.00064799
Those aren’t random targets
they’re previous areas where $LUNC already attracted serious liquidity.
From the current zone, the full move shown on my chart is around +3,344%.
Sounds ridiculous.
But crypto usually looks ridiculous before the move, not after it
And that’s exactly what makes this chart interesting.
For almost 4 years, price has kept returning to the same liquidity pool.
Now look at what’s sitting above:
$0.00017693
$0.00027718
$0.00064799
Those aren’t random targets
they’re previous areas where $LUNC already attracted serious liquidity.
From the current zone, the full move shown on my chart is around +3,344%.
Sounds ridiculous.
But crypto usually looks ridiculous before the move, not after it