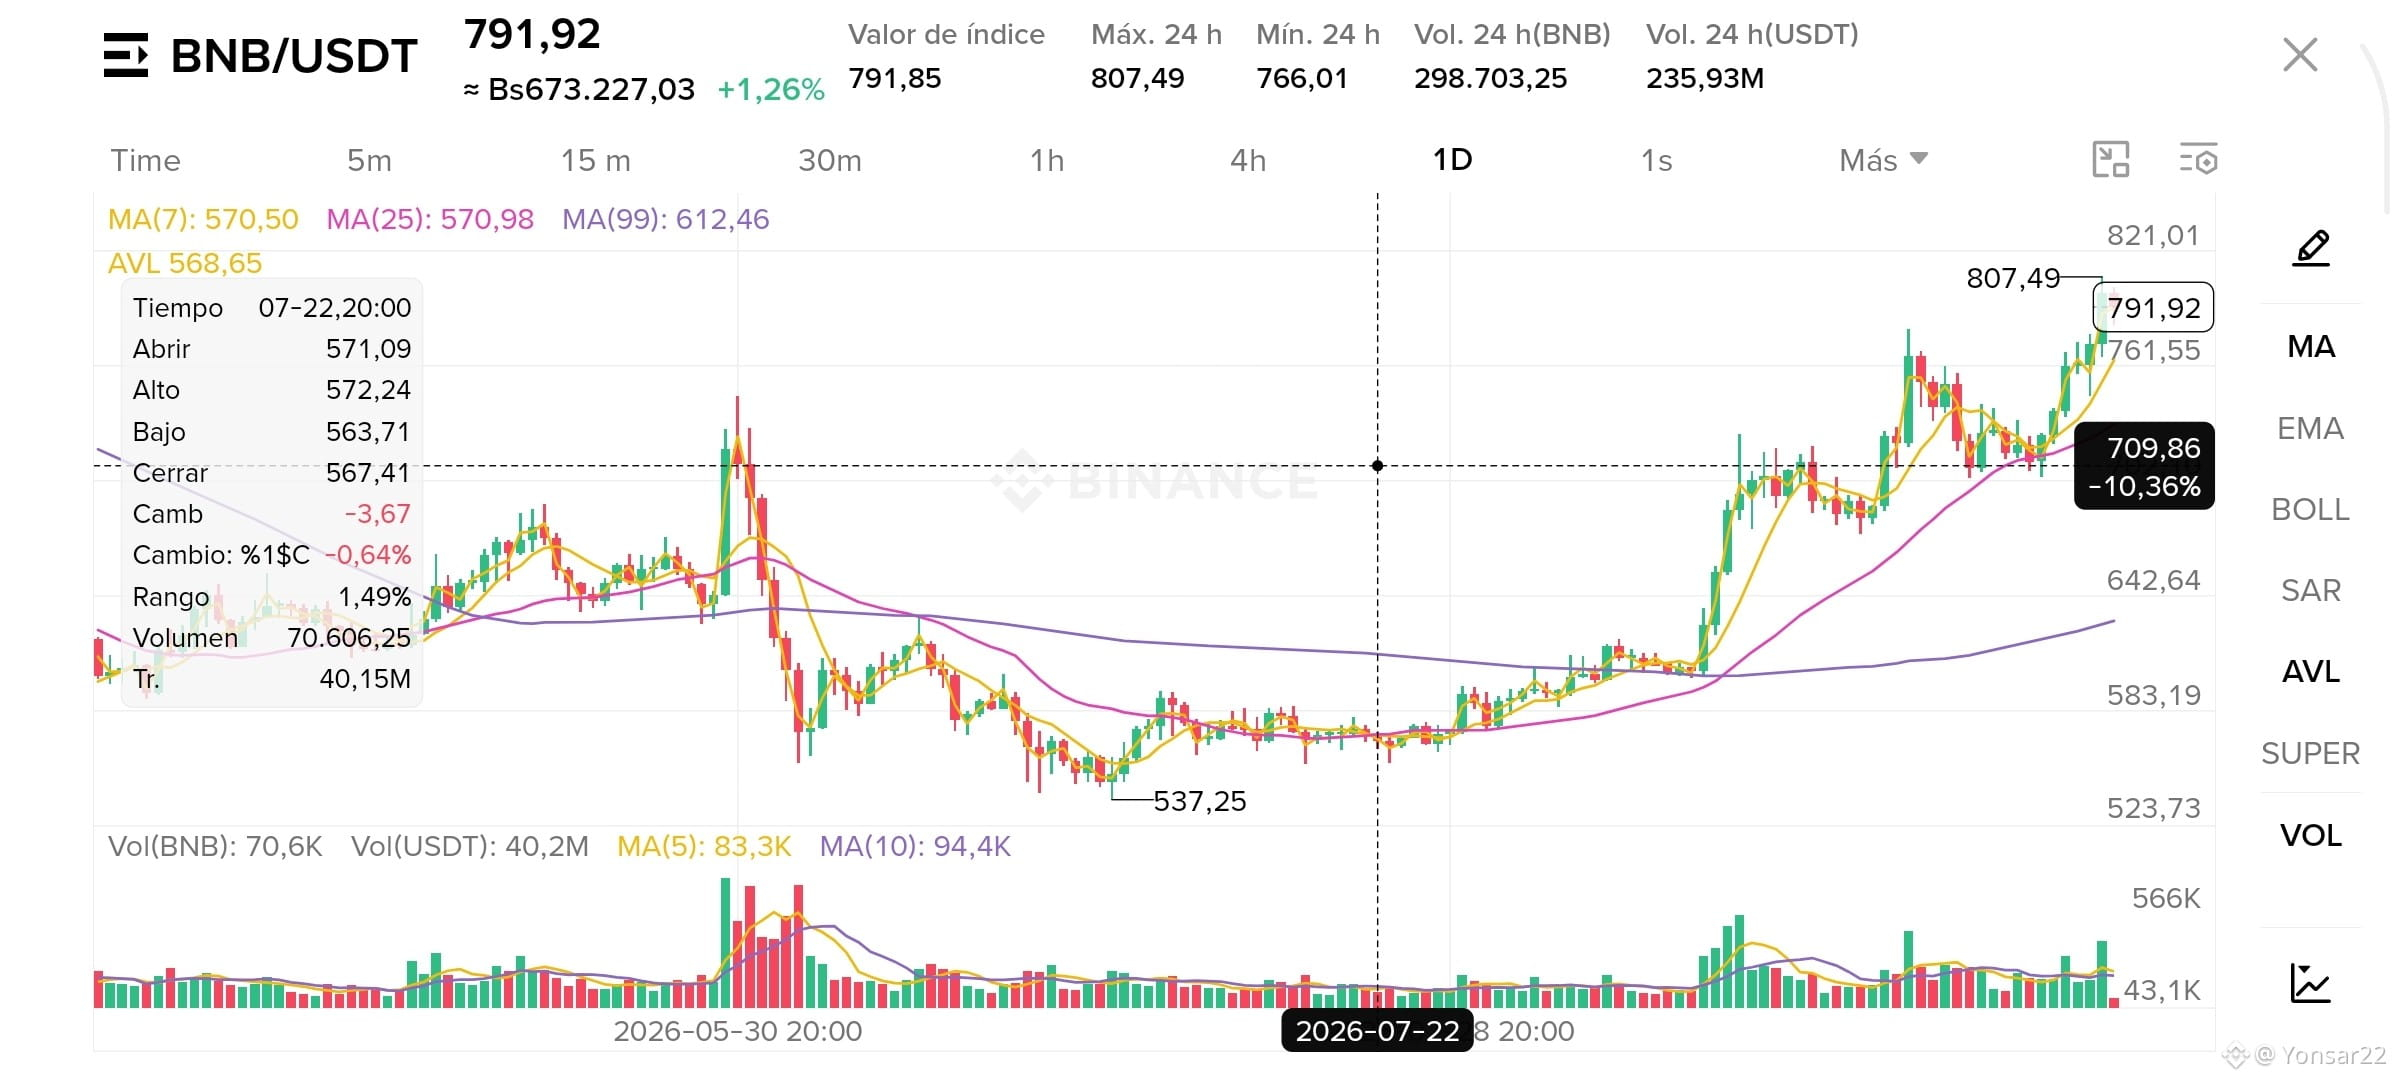
#Chapter 3: Supports and Resistances in $BNB (Basic Technical Analysis) 📈
In the previous chapters, we learned the usefulness of $BNB and how its token burn works. Today we’ll move on to charts to understand two key concepts of technical analysis: Supports and Resistances.
1. What is a Support? (The Ground 🧱)
It’s a price level where demand (buyers) is strong enough to stop a decline. In this area, the market considers the price to be "cheap" and it often bounces upward.
2. What is a #Resistance? (The Ceiling 🚪)
It’s a level where supply (sellers) exceeds demand. When the price reaches this point, many traders take profits, which makes it harder for the price to keep rising.
Why is it vital to identify these levels?
Avoid buying at ceilings: Helps you not enter during overbought moments.
Identify accumulation zones: Lets you look for entries with better risk management near supports.
In the next and final chapter, we’ll analyze Market Sentiment and how to combine it with what you learned in this series.
Do you usually draw supports and resistances before trading $BNB, or do you prefer fundamental analysis? Let me know in the comments 👇
#BNB #TechnicalAnalysis #CryptoEducation2026 #BinanceSquareFamily #Write2Earn
In the previous chapters, we learned the usefulness of $BNB and how its token burn works. Today we’ll move on to charts to understand two key concepts of technical analysis: Supports and Resistances.
1. What is a Support? (The Ground 🧱)
It’s a price level where demand (buyers) is strong enough to stop a decline. In this area, the market considers the price to be "cheap" and it often bounces upward.
2. What is a #Resistance? (The Ceiling 🚪)
It’s a level where supply (sellers) exceeds demand. When the price reaches this point, many traders take profits, which makes it harder for the price to keep rising.
Why is it vital to identify these levels?
Avoid buying at ceilings: Helps you not enter during overbought moments.
Identify accumulation zones: Lets you look for entries with better risk management near supports.
In the next and final chapter, we’ll analyze Market Sentiment and how to combine it with what you learned in this series.
Do you usually draw supports and resistances before trading $BNB, or do you prefer fundamental analysis? Let me know in the comments 👇
#BNB #TechnicalAnalysis #CryptoEducation2026 #BinanceSquareFamily #Write2Earn