


In what order should you read a BTC chart?
When you see BTC just broke above the previous high, will you first think, “It’s a breakout—go with it,” or will you first check where it finally closes?
This time, Uncle Kong will use a real trading segment from August 2026 to take you through the whole thing from start to finish. The goal is very simple: after you finish, you’ll be able to open a different chart, and ask questions in order yourself.
The order of the first chapter, first section of “Meng Hongtao (Wyckoff Trading Method)” is: background, price-volume patterns, the nature of the pattern, conclusions or forecasts—only then do you get to measures and actions. Describe first, explain second, and only then decide how to respond.
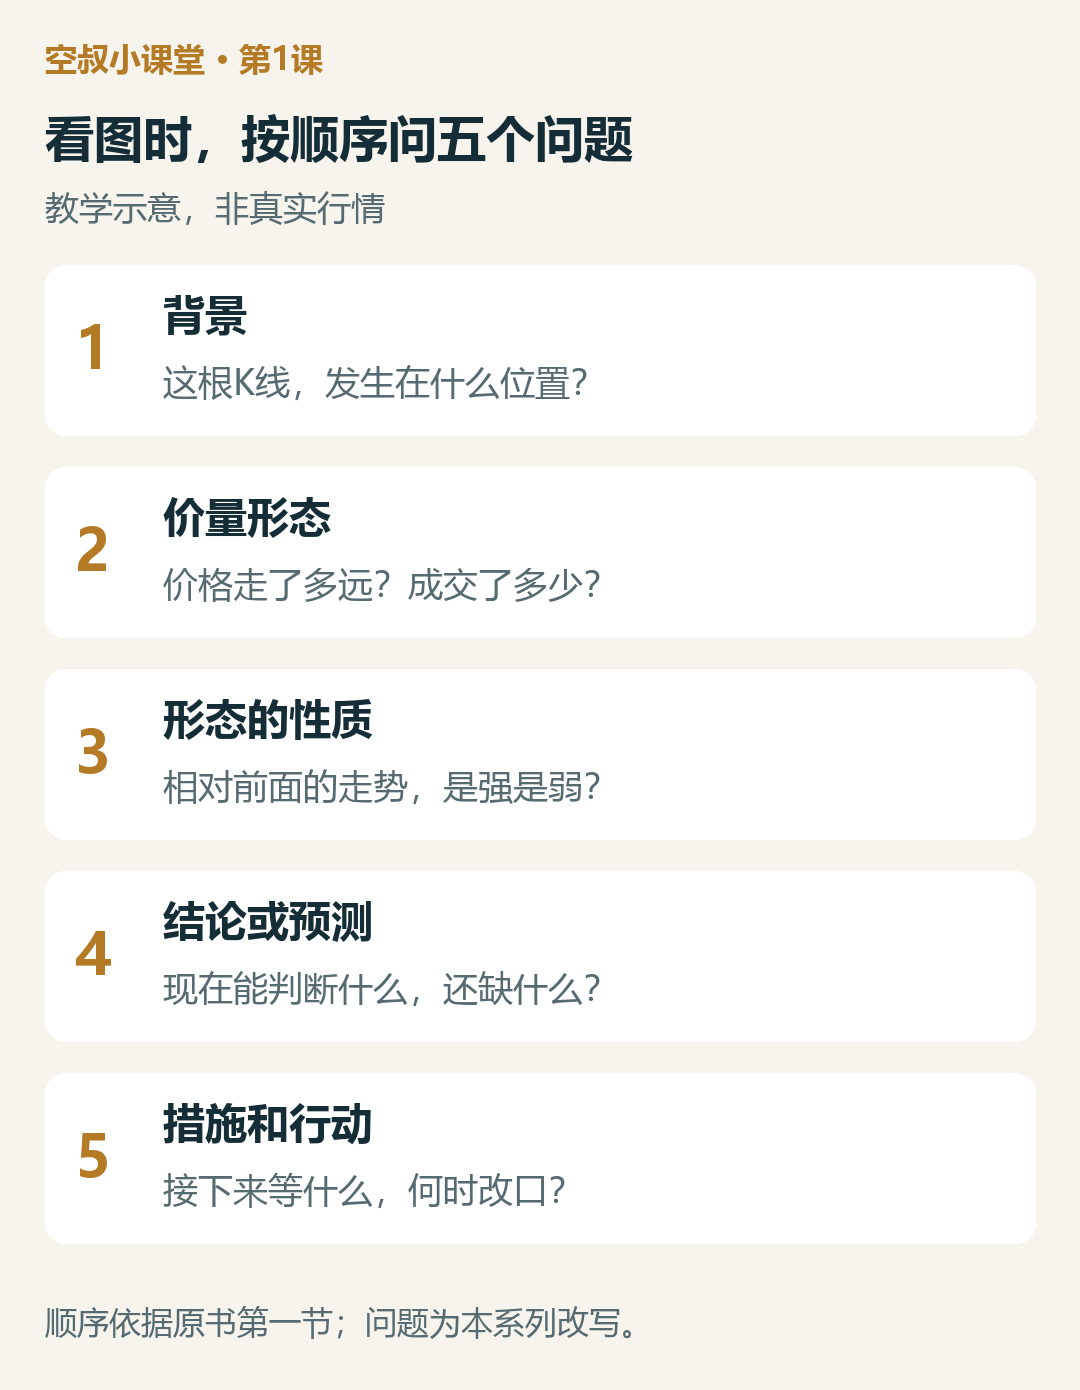
Step one: look at the background—where did it go?
First, look at the 4-hour chart, and shift your focus from the far right to the left.
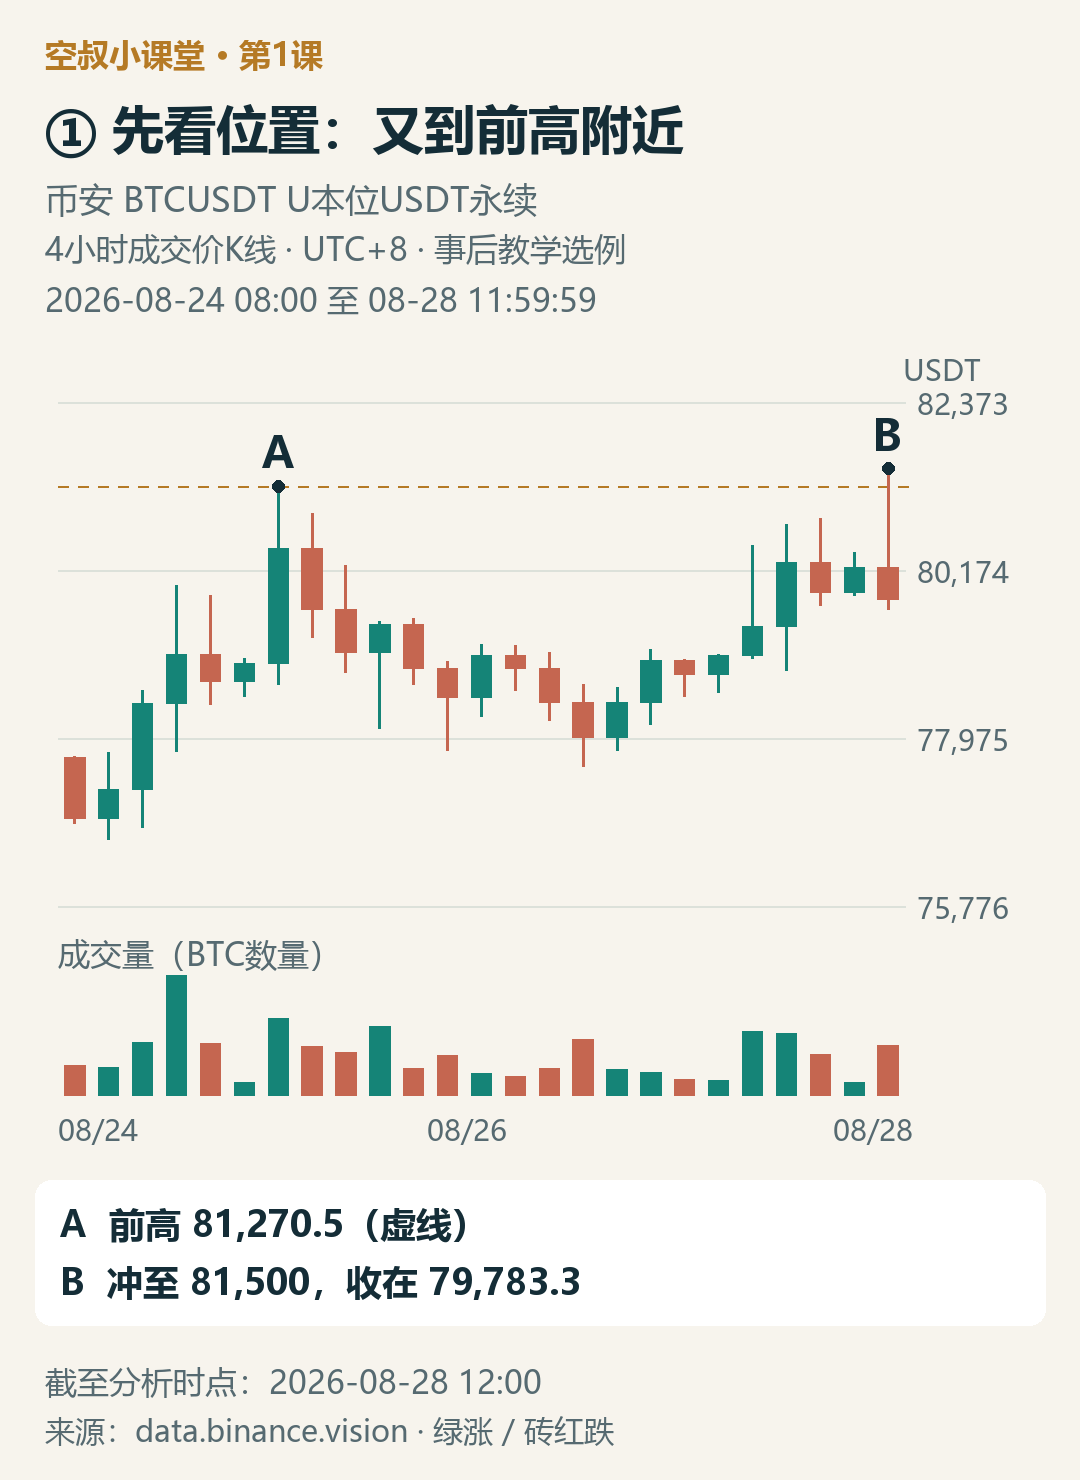
The price first rose to A at 81,270.5, then pulled back and moved upward again. At B on the far right, it came back to the vicinity of the previous high. This is the context of this observation: the price is trying to break through the earlier zone where it failed to keep rising.
Note that we are describing the structure of these days shown on the chart, and we are not declaring from this that the entire market has entered a bull market.
This is a set of after-the-fact teaching examples. The analysis stops uniformly at 12:00 on Aug 28, 2026. Only data already closed before then is used. For this series, we look at structure on the 4-hour chart and details on the 1-hour chart—this is the teaching setup.
Step two: look at price and volume—what exactly happened?
For the 4-hour candlestick at point B: it opened at 80,208.9, hit a high of 81,500, and closed at 79,783.3. It indeed went above the previous high, but the close fell back below the previous high—and it also closed below its own opening price.
This trading volume is about 39.4k BTC, roughly 3.95 times the previous one. However, in the chart there are also volume bars higher than this one, so “higher volume than the previous candle” doesn’t automatically mean “a rare massive volume.” You need to clearly state what you’re comparing against.
Then use the hourly chart to look at the process again.
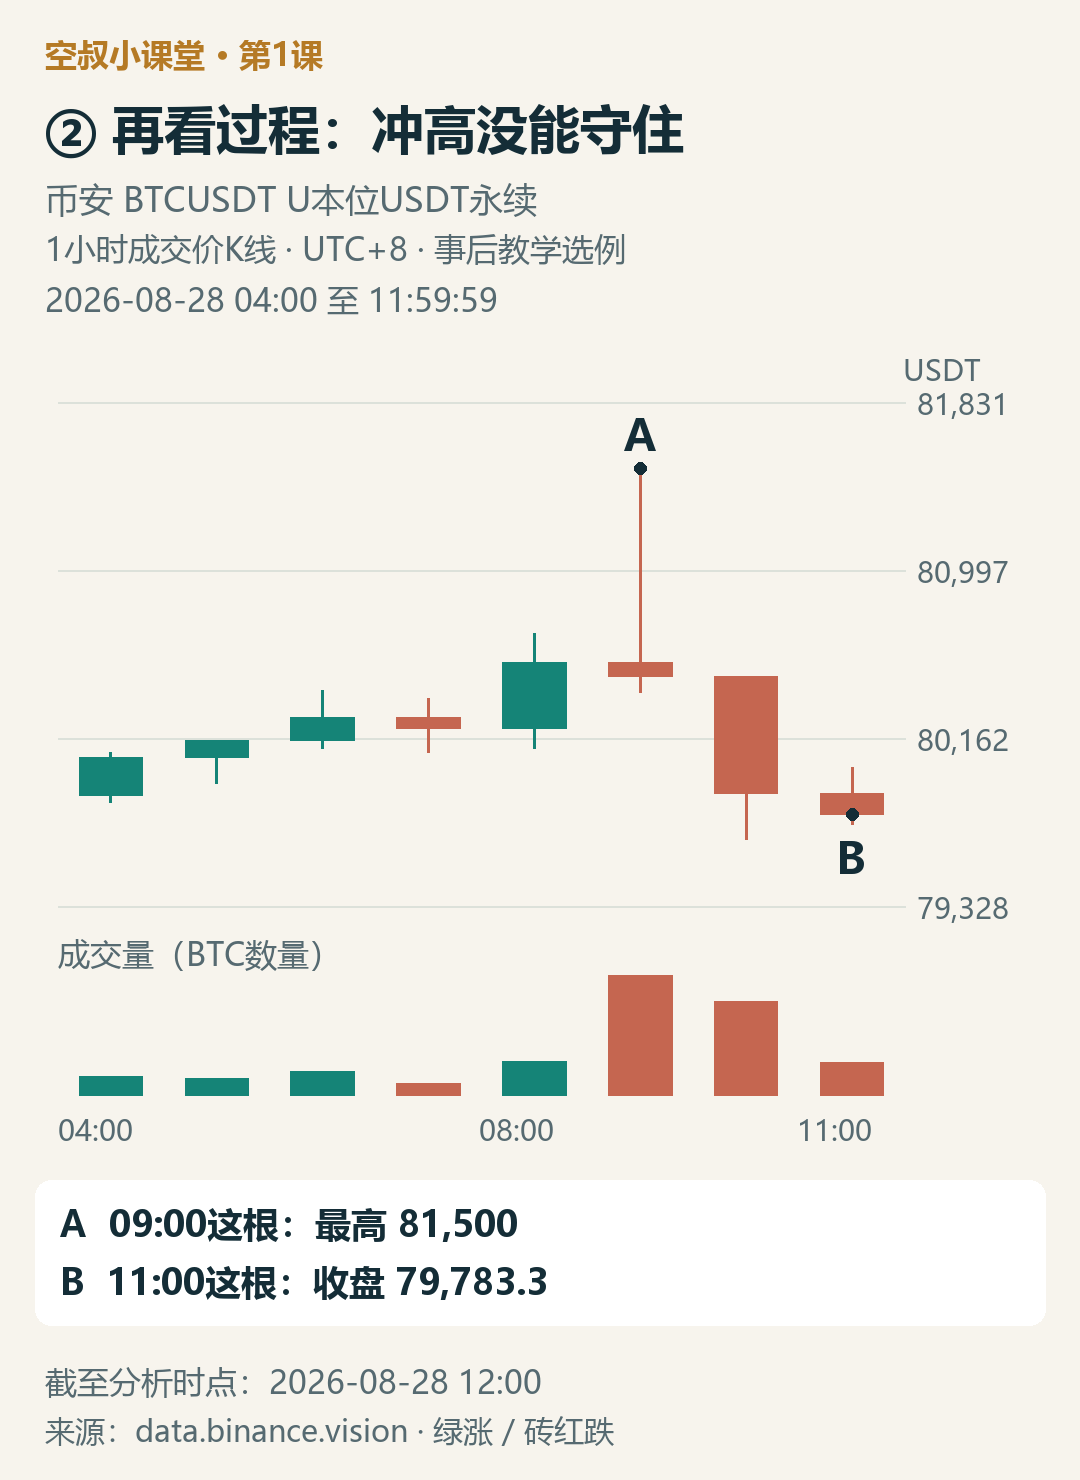
The 09:00 hourly candlestick reached 81,500; the 10:00 one closed at 79,888.1; the 11:00 one closed at 79,783.3. So, both “hitting a new high” and “failing to hold after making a new high” are clearly visible.
At this point, don’t stick labels like “bull trap” or “distribution.” Just record the price, the location, and the trading volume.
Step three: look at the nature—are these changes strong or weak?
“Nature” sounds abstract, but really it’s asking: relative to the background you just described, how did it perform this time?
Since the price is challenging the previous high, the key isn’t only where it reaches at its peak. It also depends on whether the upward move can be preserved into the close. This time, it made a new intraday high, but the close fell back below the previous high, which shows that this upswing didn’t hold onto its advantage.
This gives one extra layer of justification compared with directly saying, “Long upper wicks are a sell signal.” First we know it happened near the previous high, and then we explain that particular candlestick.
But “this time the push was relatively weak” still doesn’t mean “it will definitely drop later.” The hourly chart explains the process, and it doesn’t reveal the future for us.
Step four: make the conclusion—at the position the evidence allows
At this moment, you can write: “The price is attempting to break above the previous high, but it failed to stay above that 4-hour candle’s close, so the ongoing breakout hasn’t been confirmed yet.”
You can’t just write: “The main force finished distributing, and it will definitely drop next.” The original book discusses dominant capital using CM, but our candlestick chart has no identifiable “trader” identity. Also, 39.4k BTC is the trading volume, not the net number of BTC sold by the main force.
Step three judges the strength/weakness of this performance; only in step four do you combine the background and evidence to make a limited, bounded judgment. Don’t write both steps as “I’m bearish.”
Step five: decide what action to take—when you look at the chart next time, what should you check?
For this lesson, don’t place orders first—just write down two observation tasks is enough.
First, if later it reclaims above 81,270.5, then re-assess whether any pullback can stay above it. If these changes occur, you need to reevaluate this relatively weak performance—you cannot assume it will always be resistance.
Second, if it continues to pull back, observe whether it breaks below the low of this candle at 79,659.2, and compare the size of the drop, the range of the candlestick, and the trading volume. Breaking below means the pullback is continuing, but it does not automatically equal a short signal.
These two price levels are observation markers for this case, not trading formulas prescribed in the original book. Action can be waiting, but you must know what you are waiting for.
Next time you open the candlestick chart, try writing five sentences in order: Where is it? What happened? How is the strength/weakness shown? What can you judge now? What are you waiting for next? Write these five clearly first, and then consider trading.
Leave a small practice exercise:
Some people look only at the high price of 81,500 and say, “The breakout has already succeeded.”
From the chart, find two facts, then write one sentence with the conclusion you think can hold true at the moment.
Welcome to write your rationale in the comments—don’t just answer “up” or “down.” A reference explanation will be added to this post’s comments shortly.
On the road to trading, Uncle Kong is here with you as you grow.
Uncle Kong’s mini class · Lesson 2: Three principles that constrain your market interpretation