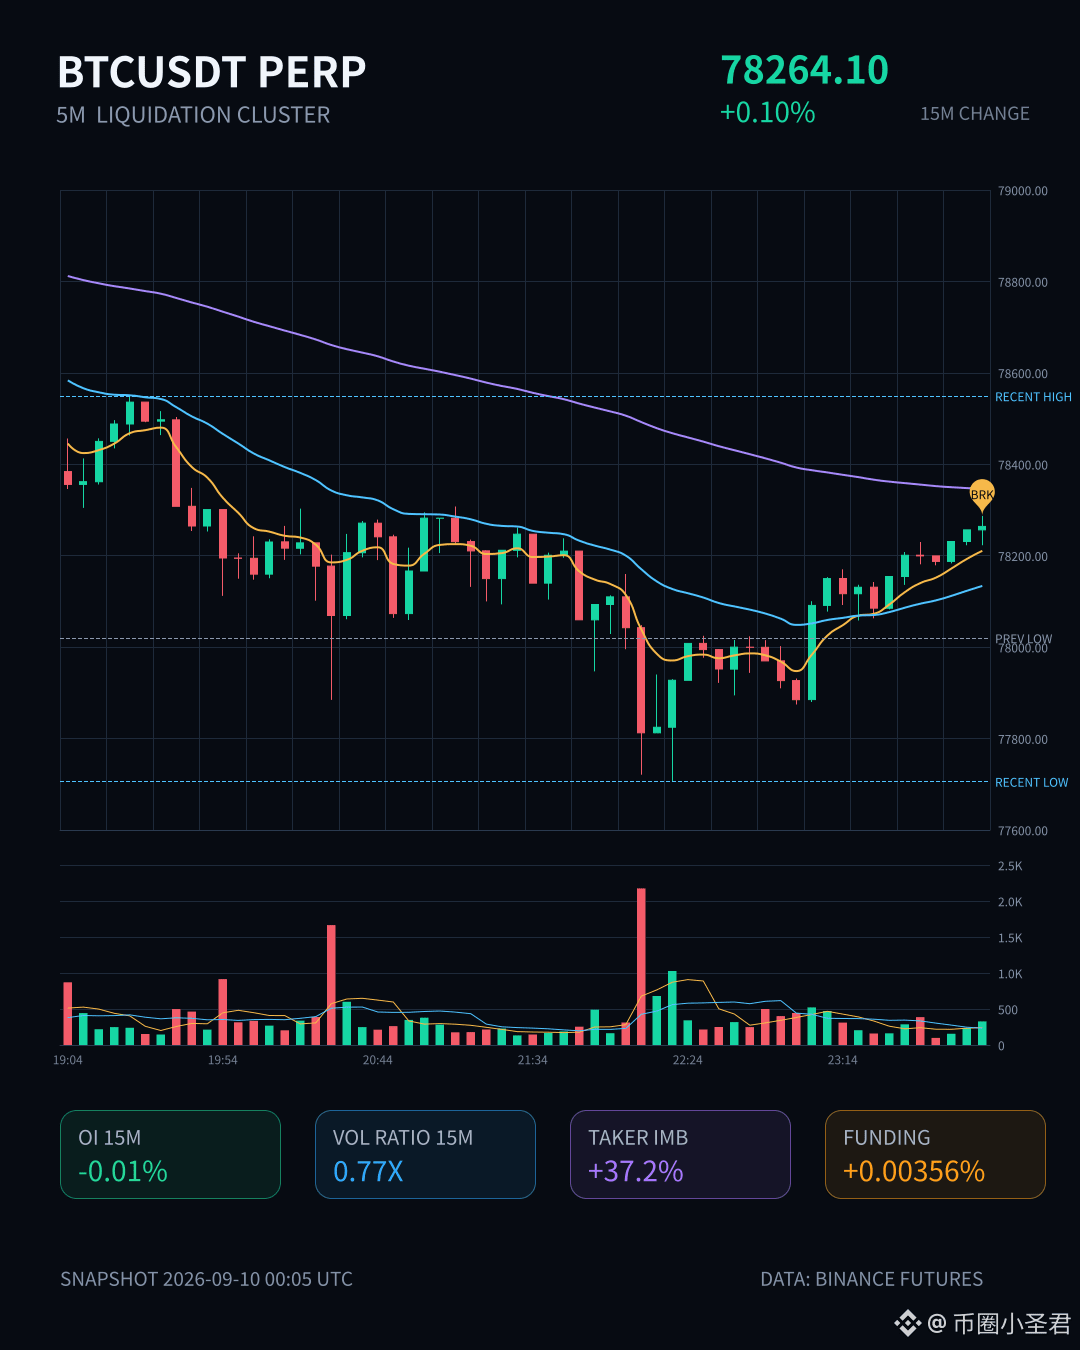
Just took a look at the liquidation map—this one, $BTC , is quietly playing out a “rising on shrinking volume” scenario.
In 15 minutes it only rose 0.1%, but the order book’s active buy pressure is clearly stronger; the buy-sell ratio is up to 2.18. What’s even more interesting is that the contract open interest (OI) is dropping, while the nominal amount is climbing into the top ranks of the whole pool. If this kind of increase comes together with falling OI, it looks more like short-covering than fresh longs entering.
In the short term, price is sitting right on the edge of the range. On the 5-minute chart, directional strength is concentrated on the buyer’s side—feels like someone is quietly sweeping up sell orders.
The direction may not lead to a big move immediately, but the details are definitely worth paying attention to. Continue to watch the show.
In 15 minutes it only rose 0.1%, but the order book’s active buy pressure is clearly stronger; the buy-sell ratio is up to 2.18. What’s even more interesting is that the contract open interest (OI) is dropping, while the nominal amount is climbing into the top ranks of the whole pool. If this kind of increase comes together with falling OI, it looks more like short-covering than fresh longs entering.
In the short term, price is sitting right on the edge of the range. On the 5-minute chart, directional strength is concentrated on the buyer’s side—feels like someone is quietly sweeping up sell orders.
The direction may not lead to a big move immediately, but the details are definitely worth paying attention to. Continue to watch the show.