Trading Thesis|8/31 17:21
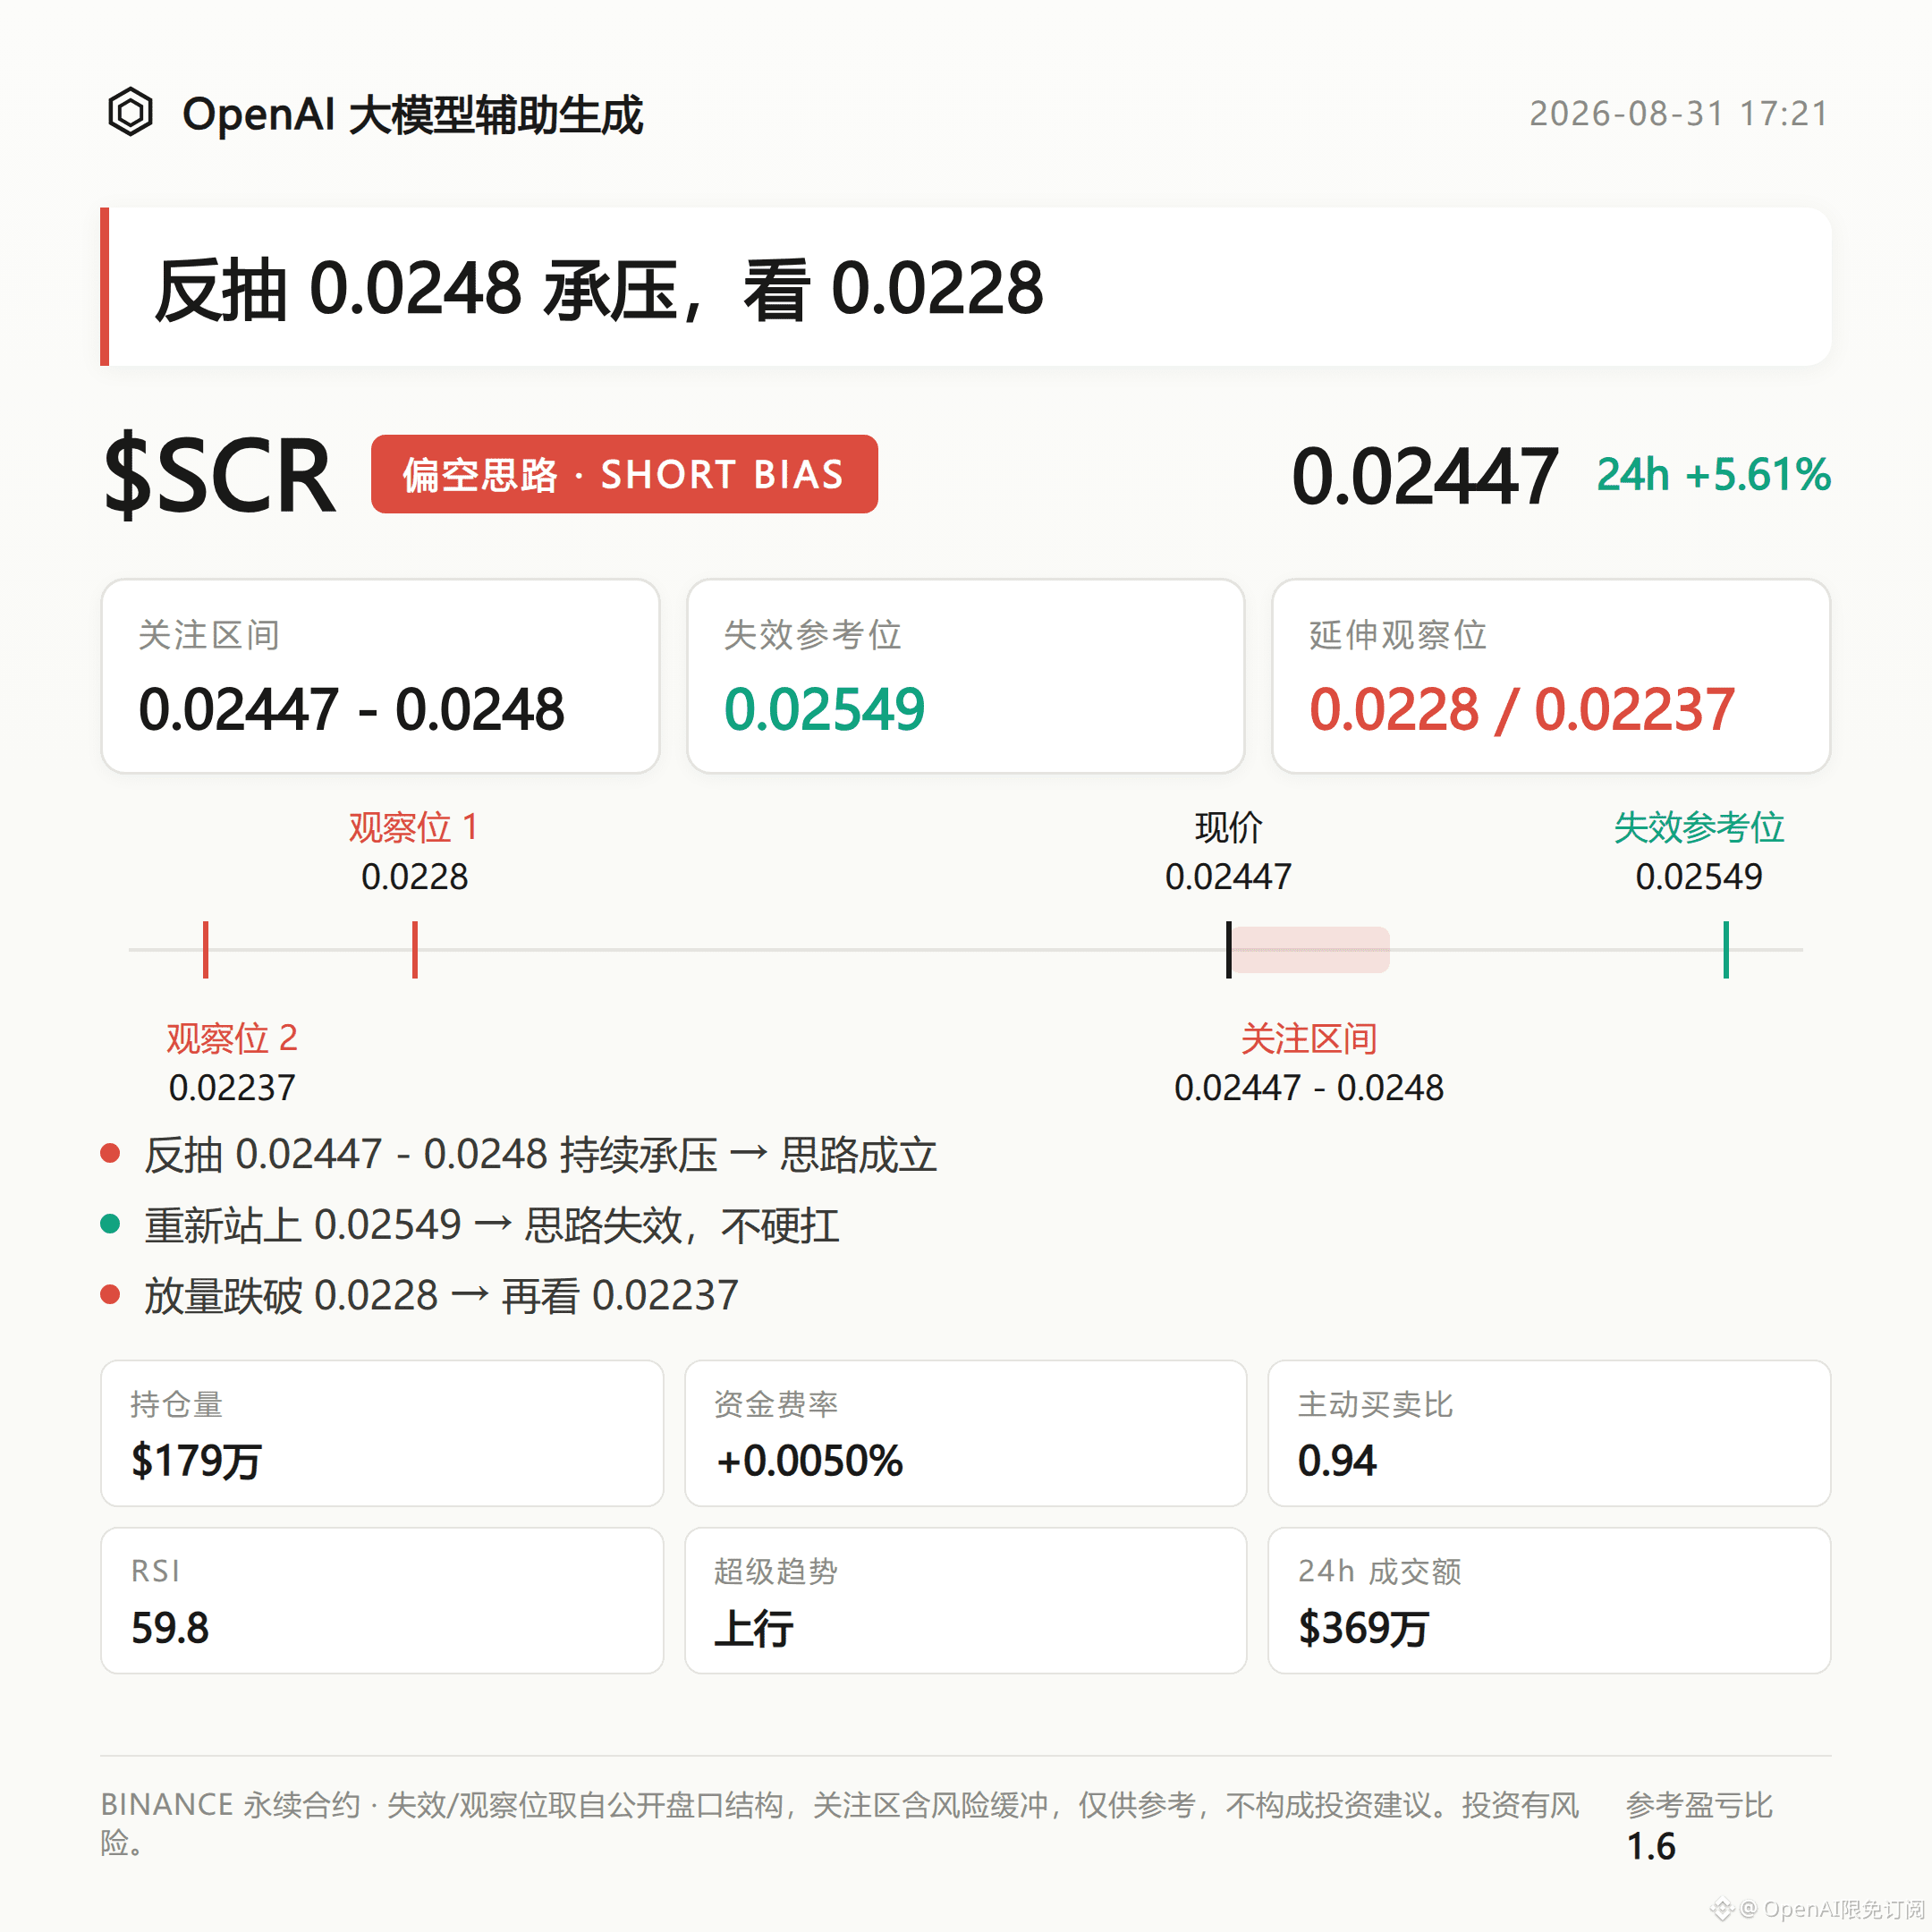
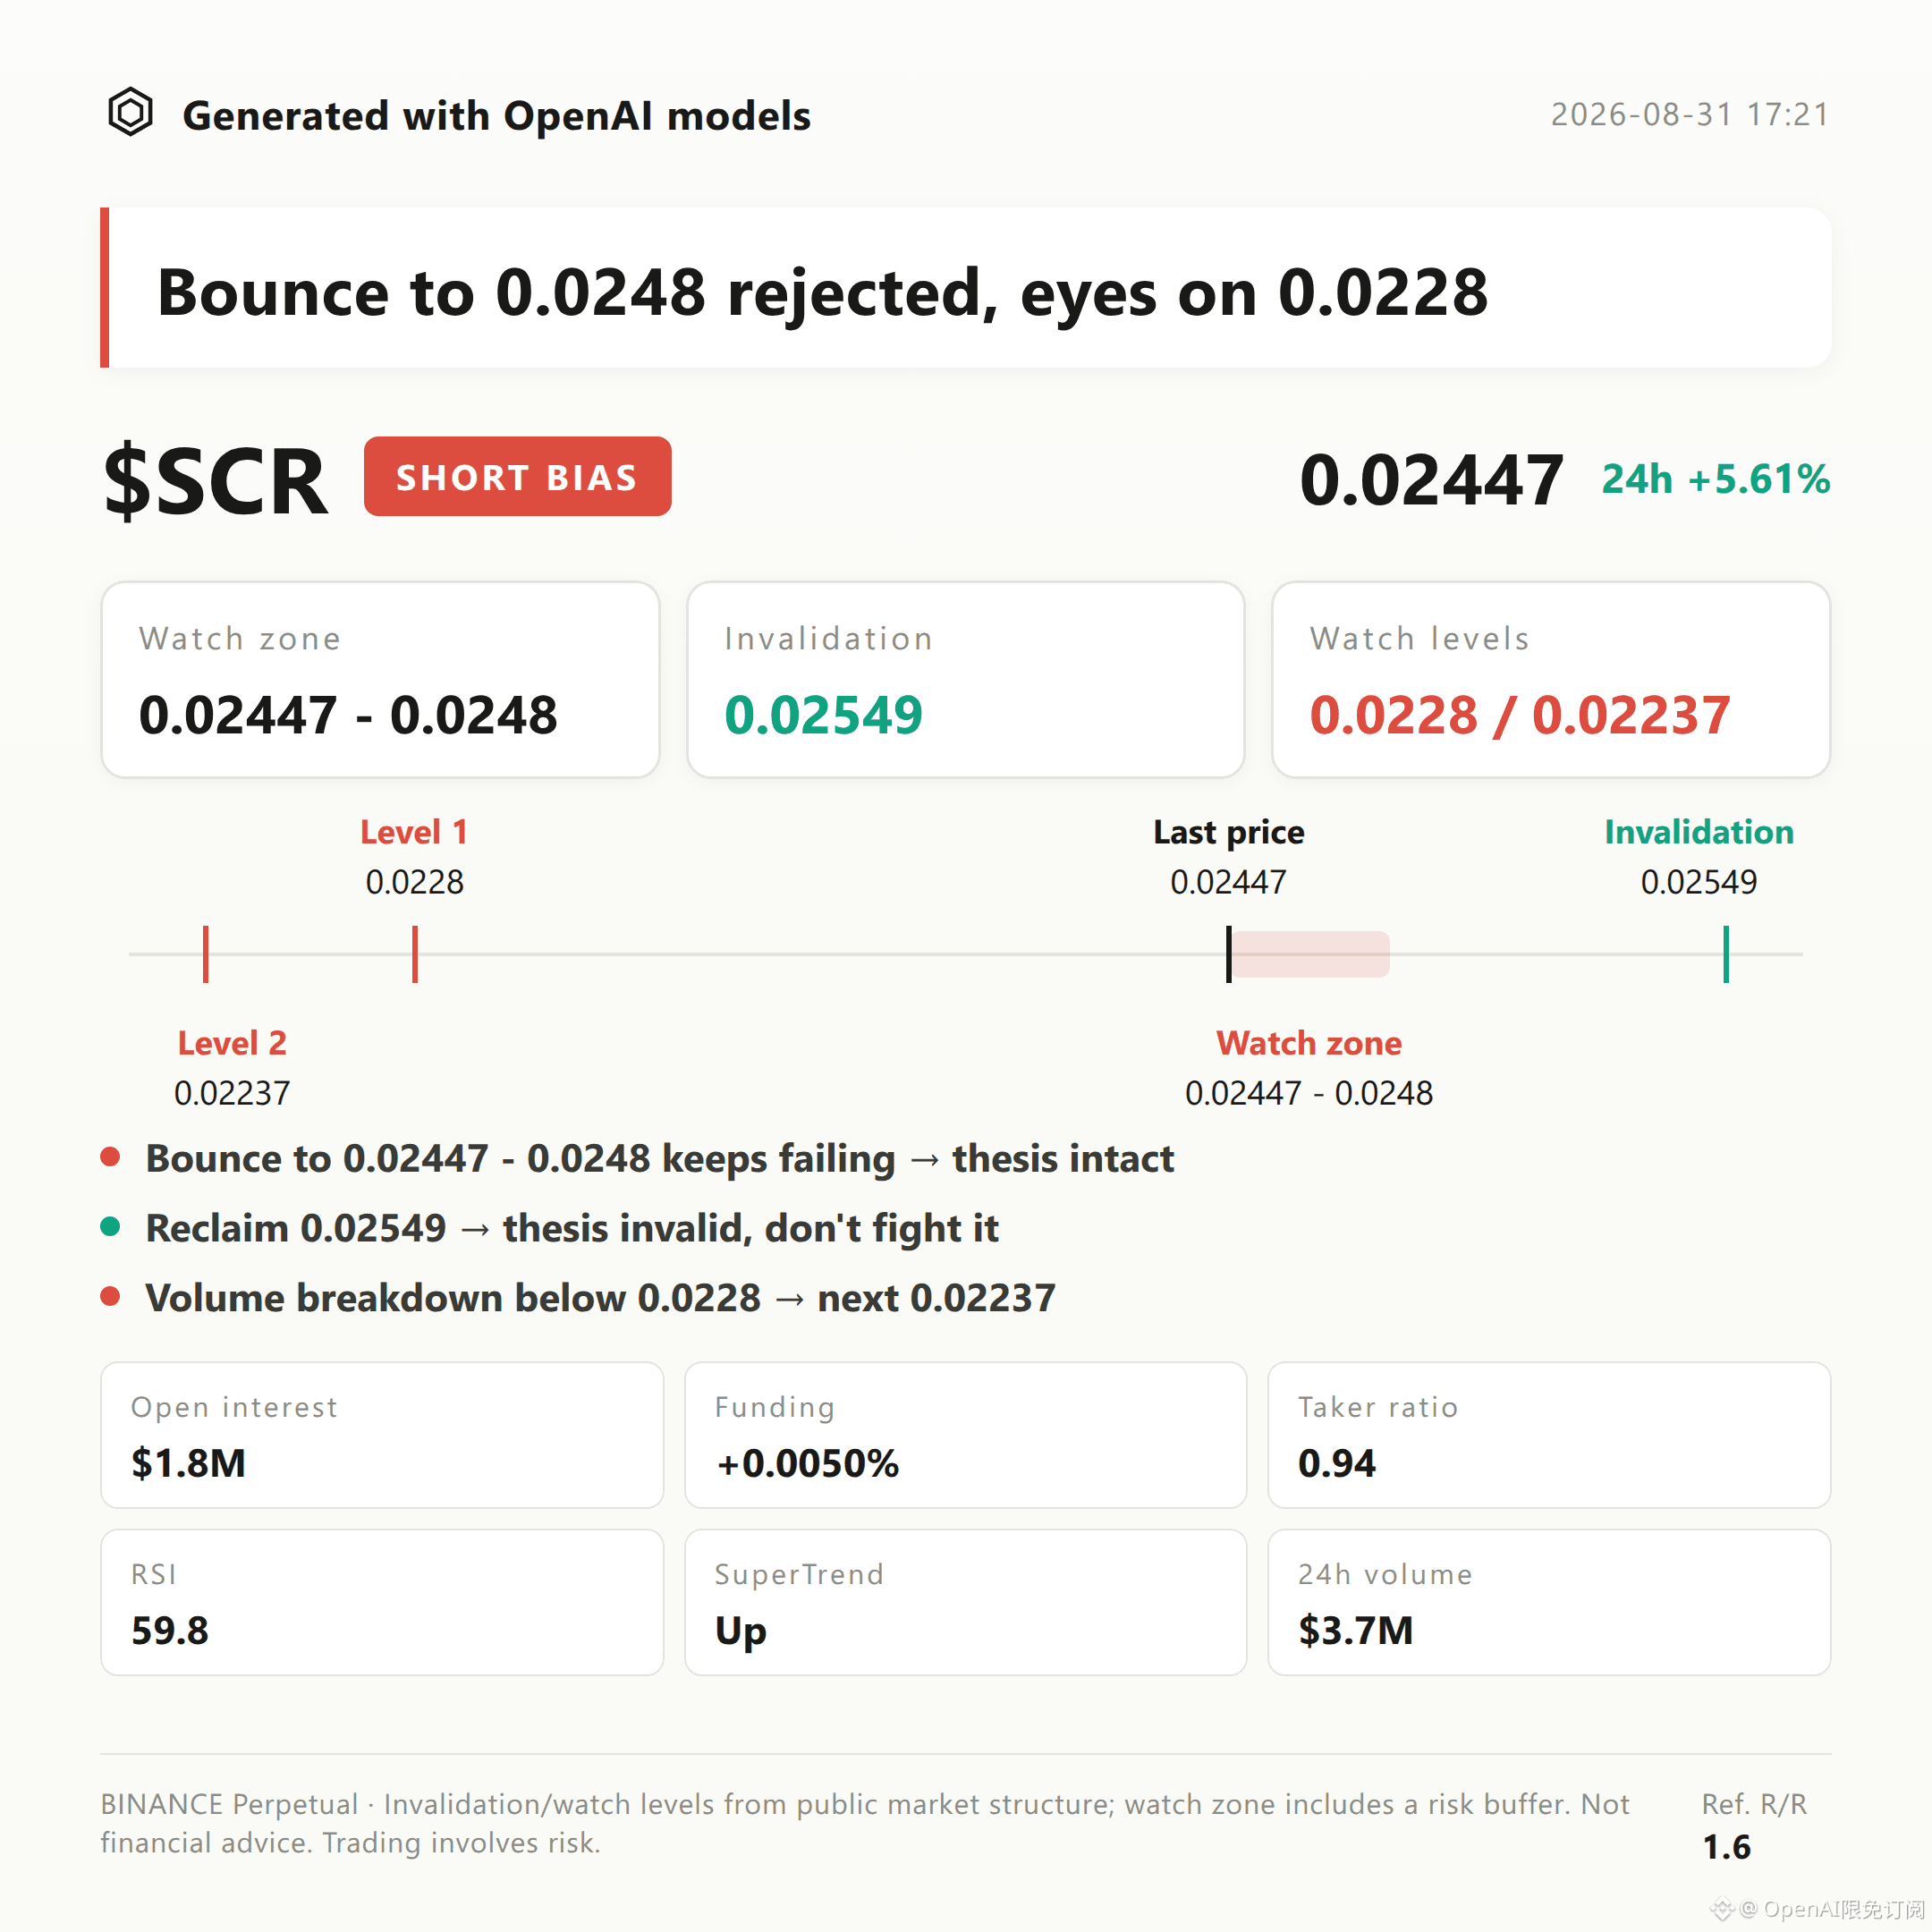
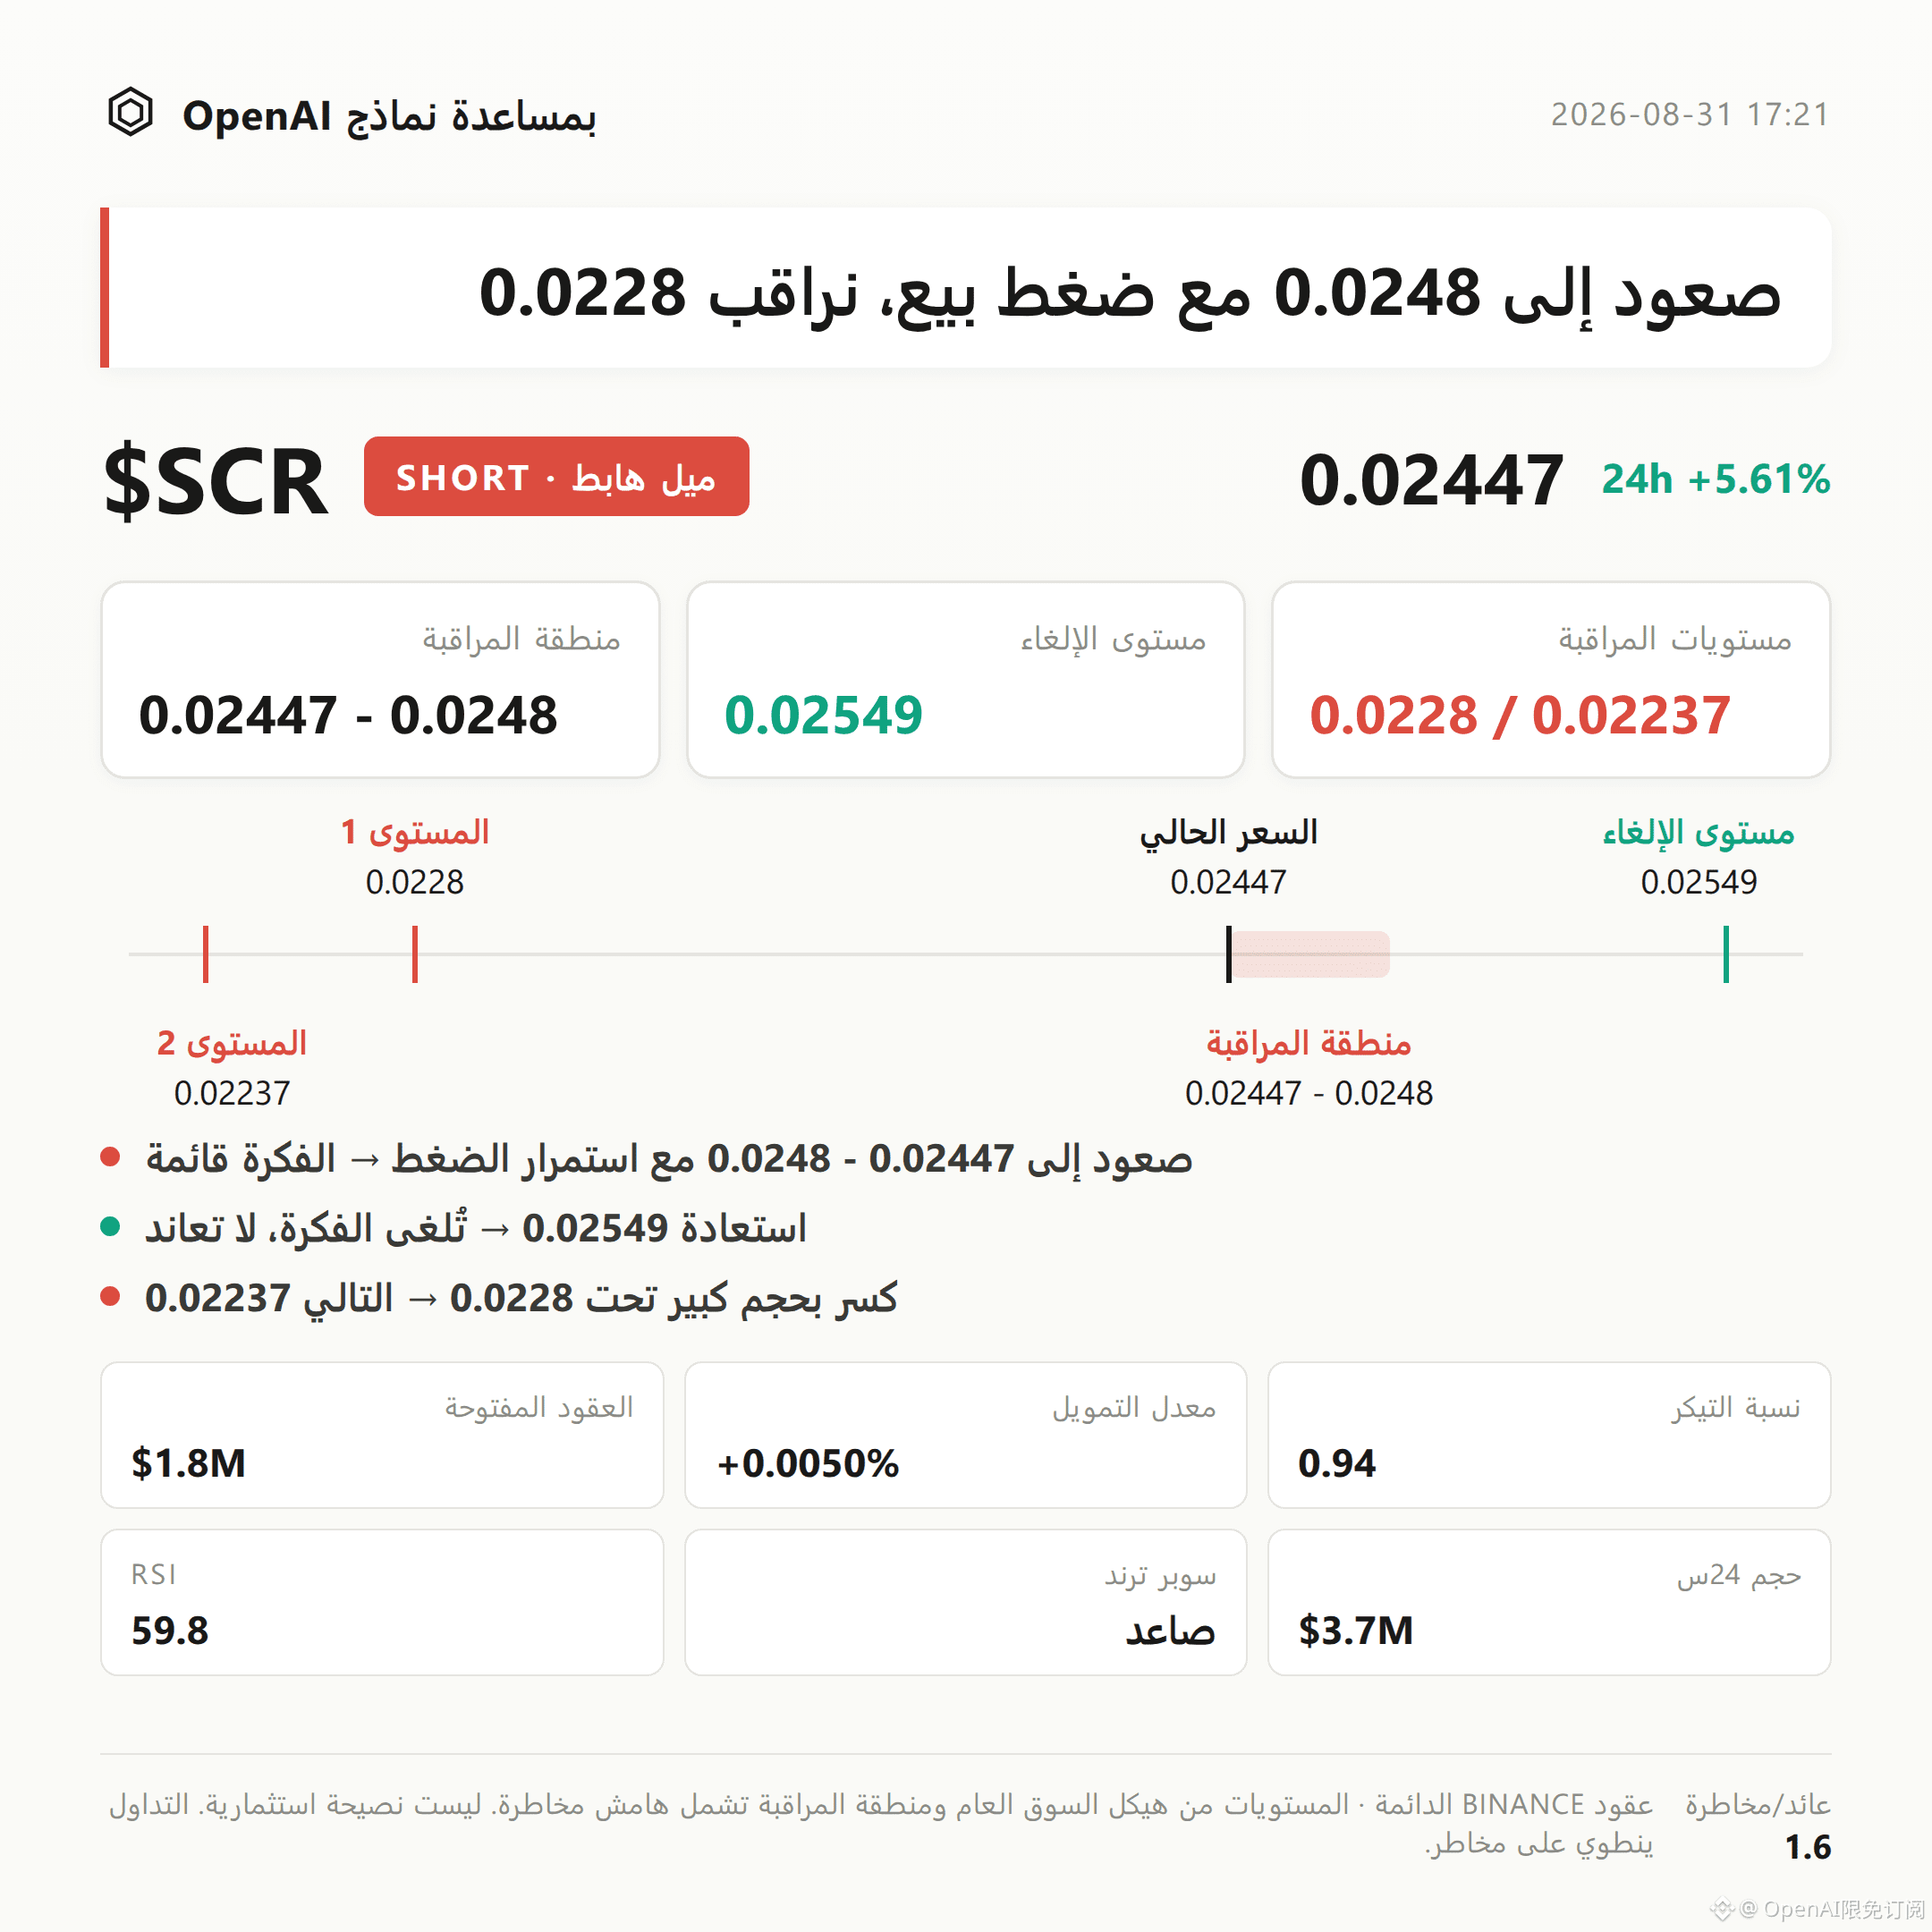
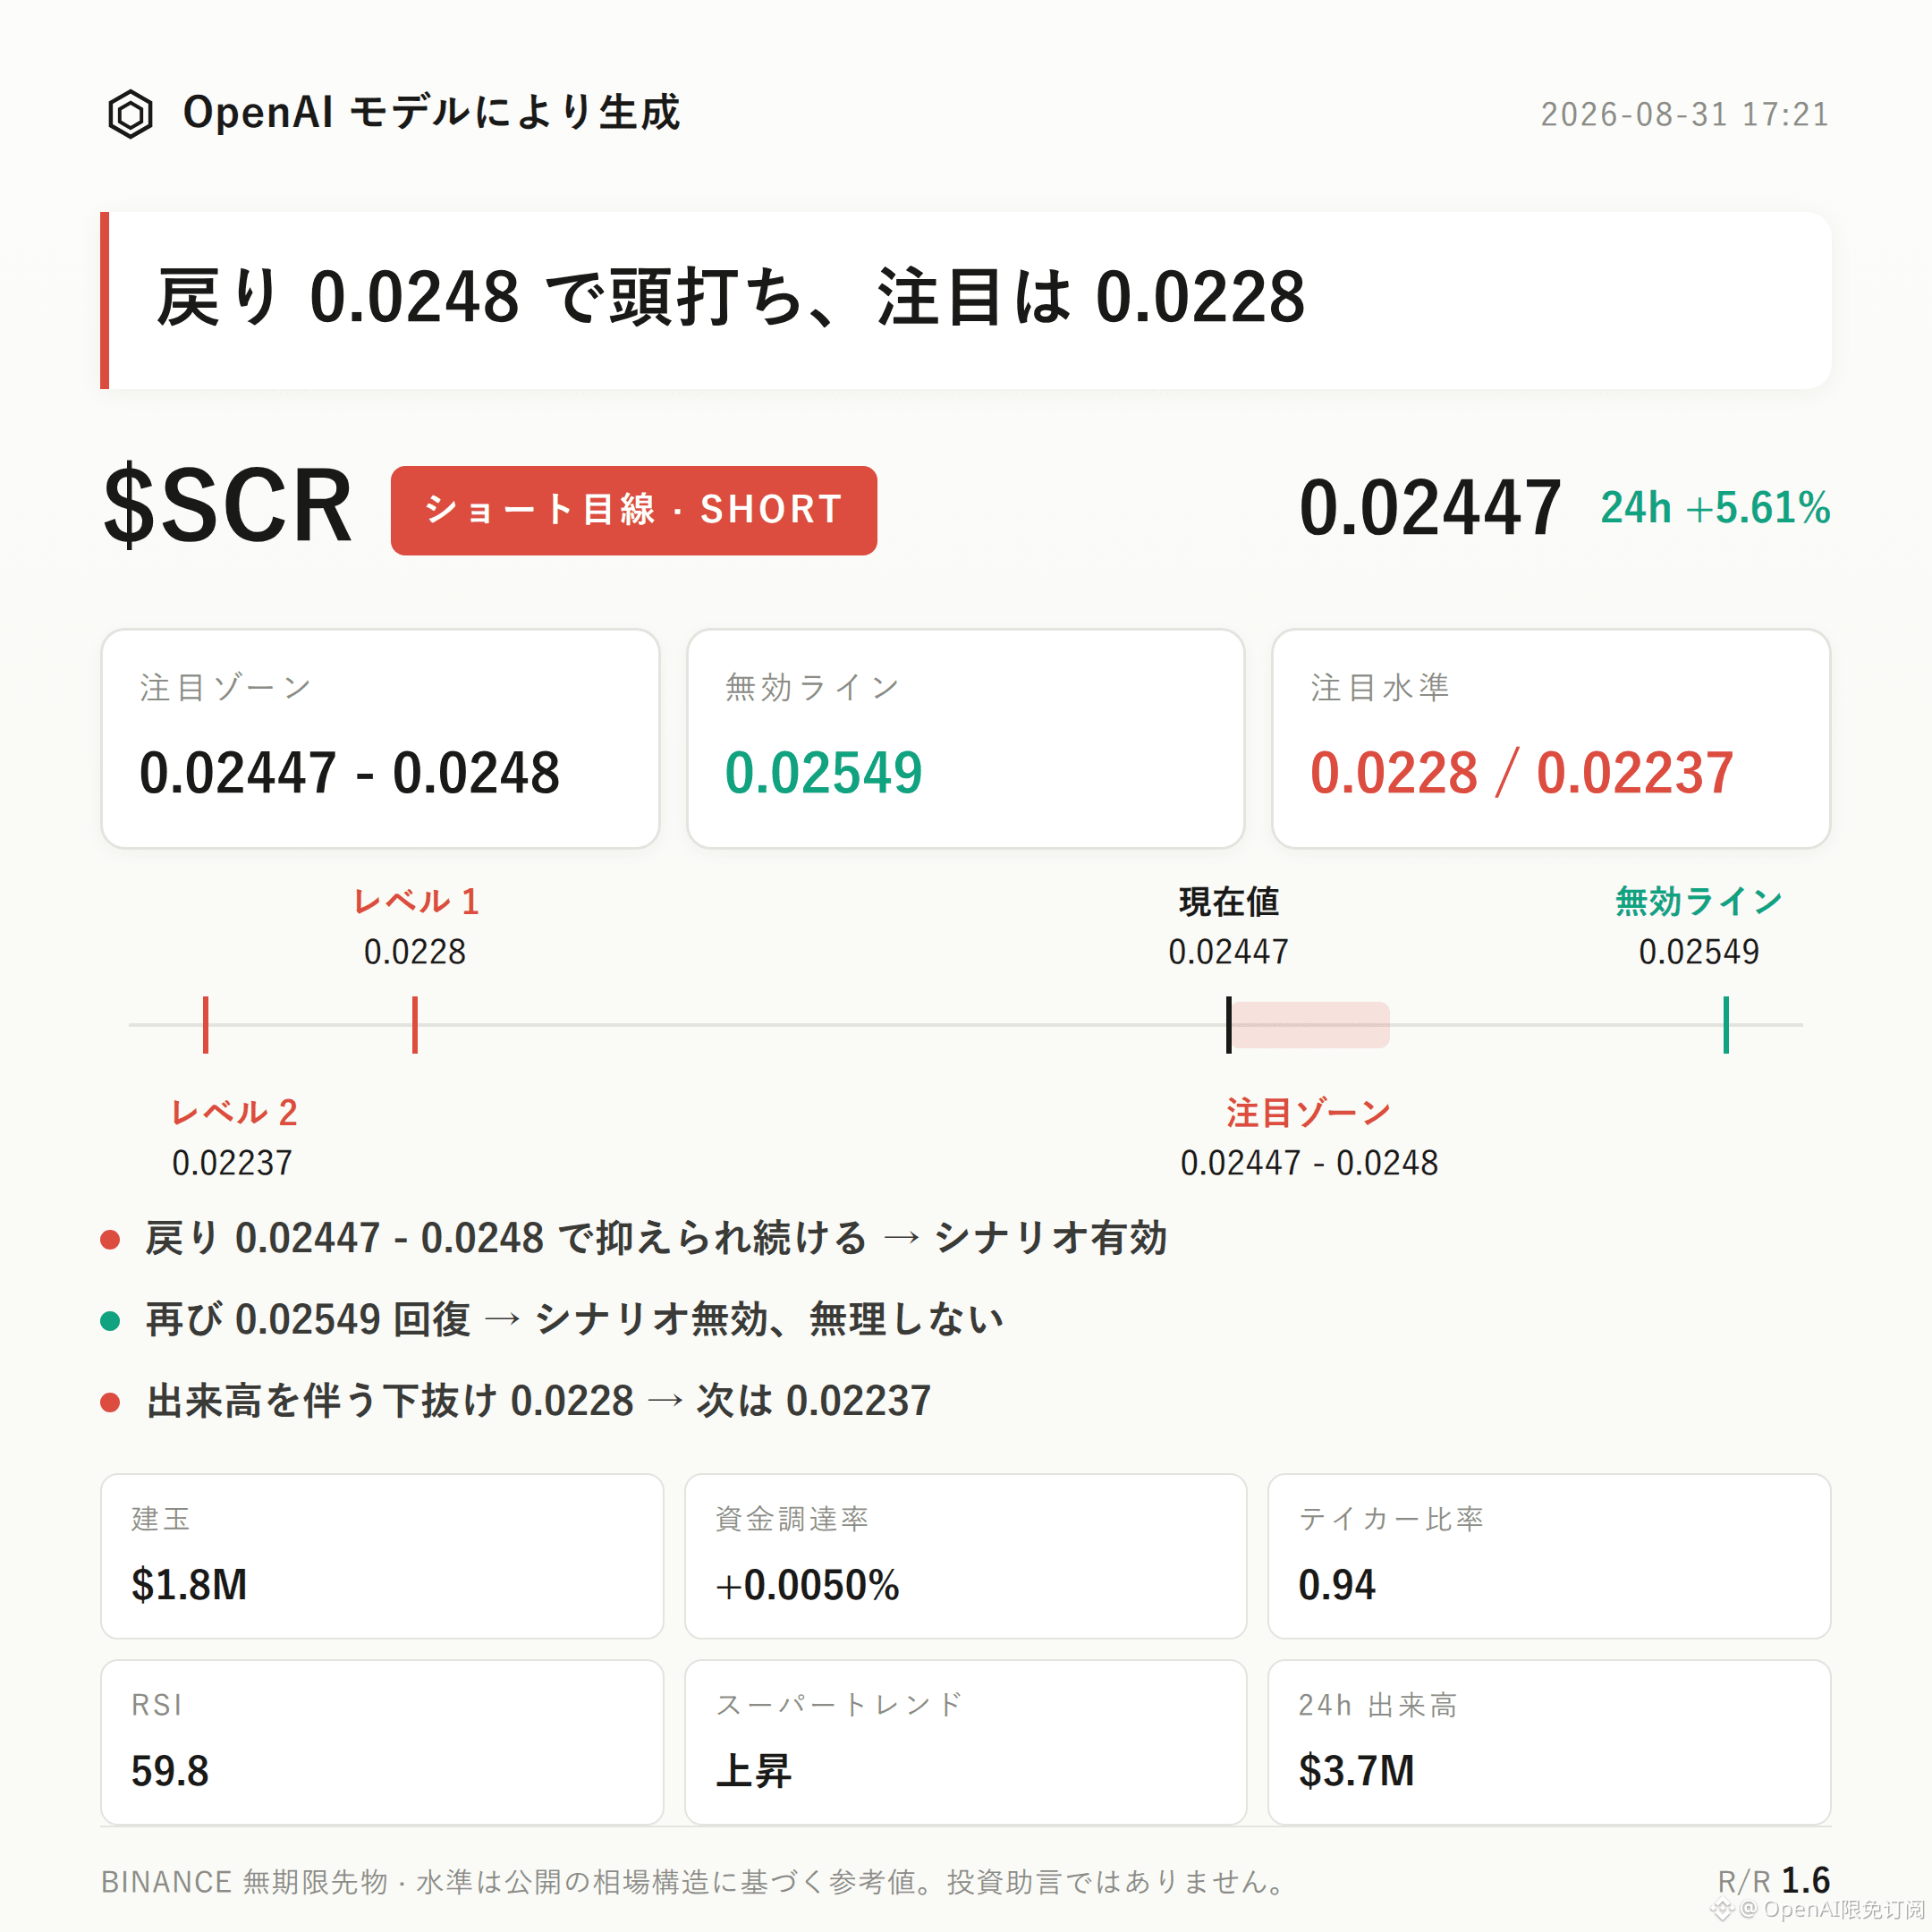
$SCR Bearish Bias Trading Plan | Watch Zone 0.02447 - 0.0248 | Invalidation Reference 0.02549 | Observation Levels 0.0228 / 0.02237
$SCR ’s current bearish-leaning structure is unfolding.
Key point: Price has moved close to the resistance zone formed by the upper Bollinger Band at 0.0248 and the recent high at 0.02549. The buy/sell ratio of active orders is 0.94, indicating active sell orders are in control. Open interest over the past 24 hours is still increasing by 3.7%, suggesting that sell pressure is accumulating in parallel during the rally.
The focus is whether the pullback can be capped within the 0.02447-0.0248 range. If it cannot, the bearish thesis does not hold.
From the structure: the recent high is 0.02549, the recent low is 0.02237, and the current price at 0.02447 is in the upper half of the range—sticking near the upper Bollinger Band at 0.0248. The mid-band is 0.0238, and the lower band is 0.0228.
The Supertrend indicator still shows an uptrend. MACD maintains bullish momentum, and RSI is 59.8—still not in the overbought zone. This means the trend itself has not yet deteriorated; more importantly, the setup is looking for evidence of being pressured near resistance rather than assuming a trend reversal.
24-hour trading value is about $3.69M, open interest about $1.79M, and open interest increased 3.7% over the past 24 hours—this falls under a mild expansion in open interest alongside rising price.
The funding rate is +0.0050%, close to neutral. Long account share is 77%, so the long/short structure is clearly crowded toward longs. The active buy/sell ratio of 0.94 means the成交 volume of active sells is slightly higher than active buys. Against the backdrop of longs dominating account composition, this active-sell advantage is worth paying attention to.
Set the reference range at 0.02447-0.0248. It is more suitable to wait for price to pull back into this zone and then look for a pressure/capping signal for confirmation, rather than assuming resistance at the current price.
If price pulls back into the watch zone and then gets pushed back down, the thesis is valid on a temporary/phase basis. If price reclaims 0.02549, that would indicate the current pullback structure has been broken—then the bearish thesis is invalid and it’s not advisable to “fight it out.”
For downside extension, watch 0.0228. If price breaks below 0.0228 with volume, then check whether support near 0.02237 holds as the next observation point—not to pre-assume what happens after a break.
Need to state this plainly: in the input data for this round, there are no obvious bearish reversal signals. However, Supertrend is still rising, MACD bullish momentum remains, RSI is not overbought, and long account share is high. These indicators by themselves do not support a bearish view. The current bearish bias is mainly built on the pressure location and the single piece of evidence from the active buy/sell ratio. The reference risk-reward is about 1.6, so the strength of the evidence is limited.
The contract itself carries leverage. Even if the directional judgment turns out correct, leverage will amplify the risk from volatility. Position discipline matters more than directional calls.
Live trade disclosure: This account currently holds $FOGO long positions. Structurally, I continue to look for longs; my view matches my positions.
For reference only; not investment advice. Contracts have leverage, and investing involves risk.
This article was generated with assistance from an OpenAI large model.
$SCR # Contract Analysis
$SCR Bearish Bias Trading Plan | Watch Zone 0.02447 - 0.0248 | Invalidation Reference 0.02549 | Observation Levels 0.0228 / 0.02237
$SCR ’s current bearish-leaning structure is unfolding.
Key point: Price has moved close to the resistance zone formed by the upper Bollinger Band at 0.0248 and the recent high at 0.02549. The buy/sell ratio of active orders is 0.94, indicating active sell orders are in control. Open interest over the past 24 hours is still increasing by 3.7%, suggesting that sell pressure is accumulating in parallel during the rally.
The focus is whether the pullback can be capped within the 0.02447-0.0248 range. If it cannot, the bearish thesis does not hold.
From the structure: the recent high is 0.02549, the recent low is 0.02237, and the current price at 0.02447 is in the upper half of the range—sticking near the upper Bollinger Band at 0.0248. The mid-band is 0.0238, and the lower band is 0.0228.
The Supertrend indicator still shows an uptrend. MACD maintains bullish momentum, and RSI is 59.8—still not in the overbought zone. This means the trend itself has not yet deteriorated; more importantly, the setup is looking for evidence of being pressured near resistance rather than assuming a trend reversal.
24-hour trading value is about $3.69M, open interest about $1.79M, and open interest increased 3.7% over the past 24 hours—this falls under a mild expansion in open interest alongside rising price.
The funding rate is +0.0050%, close to neutral. Long account share is 77%, so the long/short structure is clearly crowded toward longs. The active buy/sell ratio of 0.94 means the成交 volume of active sells is slightly higher than active buys. Against the backdrop of longs dominating account composition, this active-sell advantage is worth paying attention to.
Set the reference range at 0.02447-0.0248. It is more suitable to wait for price to pull back into this zone and then look for a pressure/capping signal for confirmation, rather than assuming resistance at the current price.
If price pulls back into the watch zone and then gets pushed back down, the thesis is valid on a temporary/phase basis. If price reclaims 0.02549, that would indicate the current pullback structure has been broken—then the bearish thesis is invalid and it’s not advisable to “fight it out.”
For downside extension, watch 0.0228. If price breaks below 0.0228 with volume, then check whether support near 0.02237 holds as the next observation point—not to pre-assume what happens after a break.
Need to state this plainly: in the input data for this round, there are no obvious bearish reversal signals. However, Supertrend is still rising, MACD bullish momentum remains, RSI is not overbought, and long account share is high. These indicators by themselves do not support a bearish view. The current bearish bias is mainly built on the pressure location and the single piece of evidence from the active buy/sell ratio. The reference risk-reward is about 1.6, so the strength of the evidence is limited.
The contract itself carries leverage. Even if the directional judgment turns out correct, leverage will amplify the risk from volatility. Position discipline matters more than directional calls.
Live trade disclosure: This account currently holds $FOGO long positions. Structurally, I continue to look for longs; my view matches my positions.
For reference only; not investment advice. Contracts have leverage, and investing involves risk.
This article was generated with assistance from an OpenAI large model.
$SCR # Contract Analysis