

Bitcoin (BTC) bulls have exerted significant pressure on Bitcoin over the past week, with the price of Bitcoin struggling between $27,000 and $28,500 as the price of Bitcoin has risen sharply over the past few days with strong price action reaching highs of $28,500 before facing a price rejection at $27,000.
The cryptocurrency market holds great potential for many traders and investors, with new sentiment and fundamentals influencing the price action of Bitcoin and Ethereum as well as the top 5 cryptocurrencies (SHIB, XRP, SOL, DOT, TOMO) on a weekly basis
The price of Bitcoin still holds great appeal for many traders and investors as the price remains in a critical area of interest for Bitcoin (BTC) bulls and bears as a strong rejection from $28,500 could give a big advantage to the bears to push the price lower and a breakout above $28,500 could mean that the bulls are in control.
Potential coins worth watching in October! Strongly bullish!
Ripple (XRP)
Until the next crypto bull run, the future of Ripple (XRP) remains bullish. No wonder this coin is among the top 5 cryptocurrencies every week as analysts, traders, and investors believe in a bright future for XRP faithfuls.
The ruling in the Ripple (XRP) case in its favor has been a huge catalyst for its growth, as activity on the XRP network continues to increase and hit new all-time highs due to speculation, offsetting the highly speculated XRP AMM function that has been a net bull run.
The news of the inclusion of XRP automated market maker (AMM) functionality was welcomed by the community as there was a lot of anticipation for its implementation. Despite the tough market conditions, Ripple continues to grow as the future looks more promising.
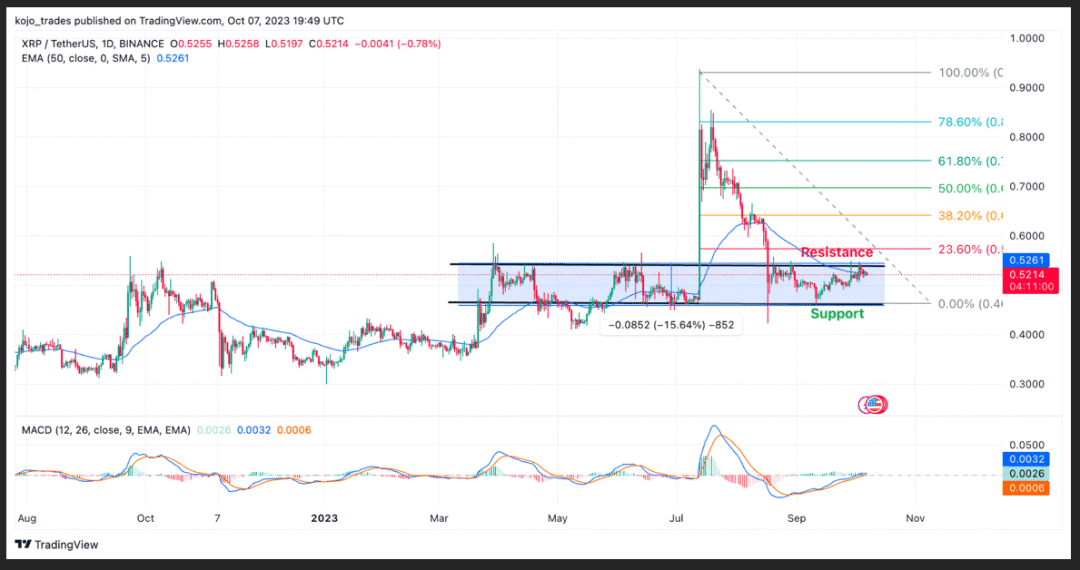
The price of XRP/USDT has remained range-bound as the price of XRP/USDT struggles to match its on-chain activity as the price faces a lot of resistance above $0.55.
The XRP/USDT price continues to move bullishly with its daily MACD and RSI indicating buy orders as the price was rejected twice above the $0.5 to $0.55 range.
XRP/USDT is trading just above the 50-day moving average, which acts as support at $0.5, while the price faces resistance at $0.55, which is equivalent to the 23.6% FIB value. A breakout and close above 23.6% could signal a rise in the price of XRP.
Major XRP/USDT Support Zone – $0.5
XRP/USDT Major Resistance Zone – $0.55
MACD Trend – Bullish
Solana (SUN)
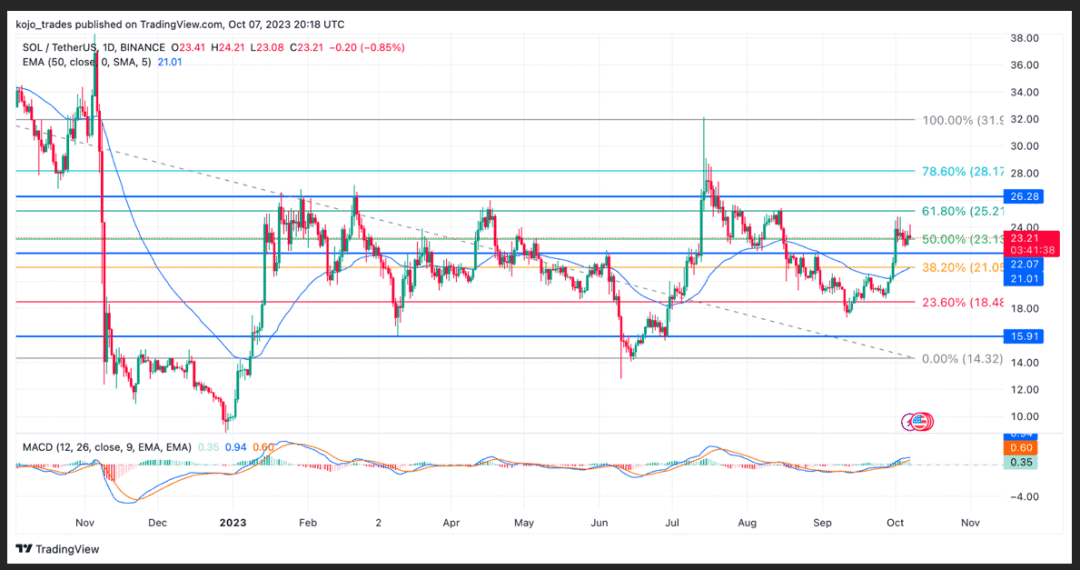
The bankruptcy court’s announcement of liquidation of FTX assets had a negative impact on Solana’s price as the price dropped significantly from highs of $22 to the $17.5 region, which has proven to be an area of interest for bulls in the past.
Following the initial drop in price to the $17.5 region, the SOL/USDT price has shown strong momentum with bulls bouncing from this area to as high as $24.4 due to increased on-chain activity on the Solana network and news coverage of its network upgrade which has been a good price catalyst.
With the massive increase in decentralized application (dApp) usage and increased trading volumes due to non-fungible tokens (NFTs), the SOL/USDT price is likely to form strong support above $23, allowing bulls to push the price higher.
After falling to a low of $17.5, the SOL/USDT pair rebounded to a high of $24.4 and the price dropped to $23, trading above the daily 50-day MA as the price could rally to $32.
The price of $23 corresponds to its 50% FIB value as the daily MACD and RSI for SOL/USDT suggest a bullish price action for SOL/USDT in the coming weeks.
Main SOL/USDT Support Zone – $22.5
Major SOL/USDT Resistance Zone – $25
MACD Trend – Bullish
Polkadot (DOT)
Polkadot (DOT), known for its unique multi-chain interaction method and groundbreaking technology, hopes to revolutionize the blockchain industry, but it has recently been in trouble and has difficulty taking advantage of its price.
Polkadot’s technology of bridging various blockchains into a cohesive ecosystem has enabled it to gain widespread influence in the cryptocurrency community. Nevertheless, its price has experienced multiple turbulences in the cryptocurrency market as bears continue to dominate the price.
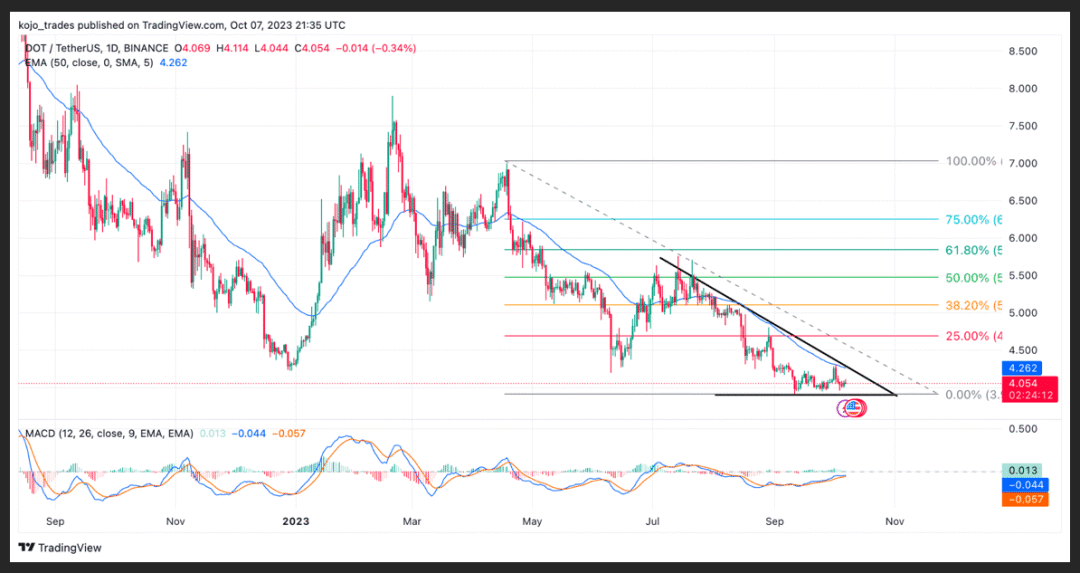
The price of DOT/USDT continues to trade below the daily 50-day moving average at $4.2. After falling from a high of $7.9 and hitting a yearly high, it looks like it may have bottomed out, but its price has struggled to replicate such a trend rally.
If the price of DOT/USDT is above $4.4, we may see the price attempt to retest the high of $5, which corresponds to the 25% FIB value; a breakout and close above $5 could mean a more bullish price action for DOT/USDT.
The DOT/USDT price has formed a bullish descending triangle, and the cost is expected to break out after a bearish downtrend. The MACD and RSI of DOT/USDT indicate a bullish bottom.
Main DOT/USDT Support Zone – $3.9
Major DOT/USDT Resistance Zone – $5
MACD Trend – Bullish
TomoChain (TOMO)
Tomochain (TOMO) has become a regular name in the cryptocurrency space. Considering its huge potential, as a top 5 cryptocurrency altcoin, it’s no wonder it’s a gem to watch out for.
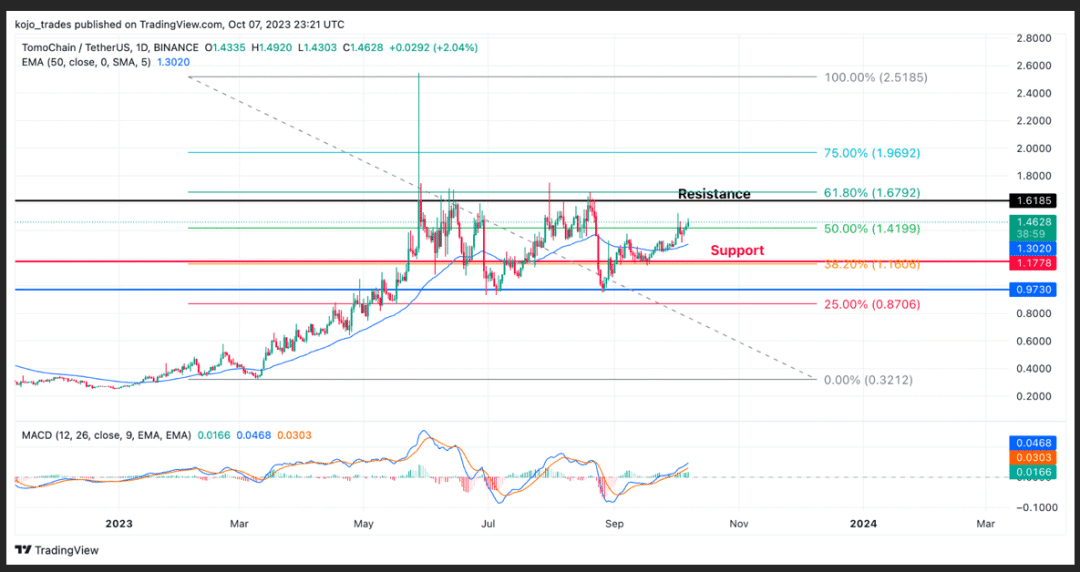
TOMO/USDT remained strong in 2023 after rebounding from a low of $0.2 to a high of $2.7, but as the price rebounded from this area, forming a double bottom, the price was rejected and fell to a low of $0.9.
TOMO/USDT regained $1.2, corresponding to a FIB value of 38.2%, forming a strong price support. TOMO/USDT is currently trading above the 50-day moving average as the price trend is more bullish.
A breakout and close of TOMO/USDT above $1.6 could result in a rally above $2 as the bulls will be largely in control of the price considering that the MACD and RSI are looking bullish.
TOMO/USDT Main Support Zone – $3.9
TOMO/USDT Major Resistance Zone – $5
MACD Trend – Bullish
If you like it, please follow and like it~ Come to the homepage to ambush and layout together!