Binance Square
#sol

sol

117M views
247,029 Discussing
Crypto Master 786
·
--
Bearish
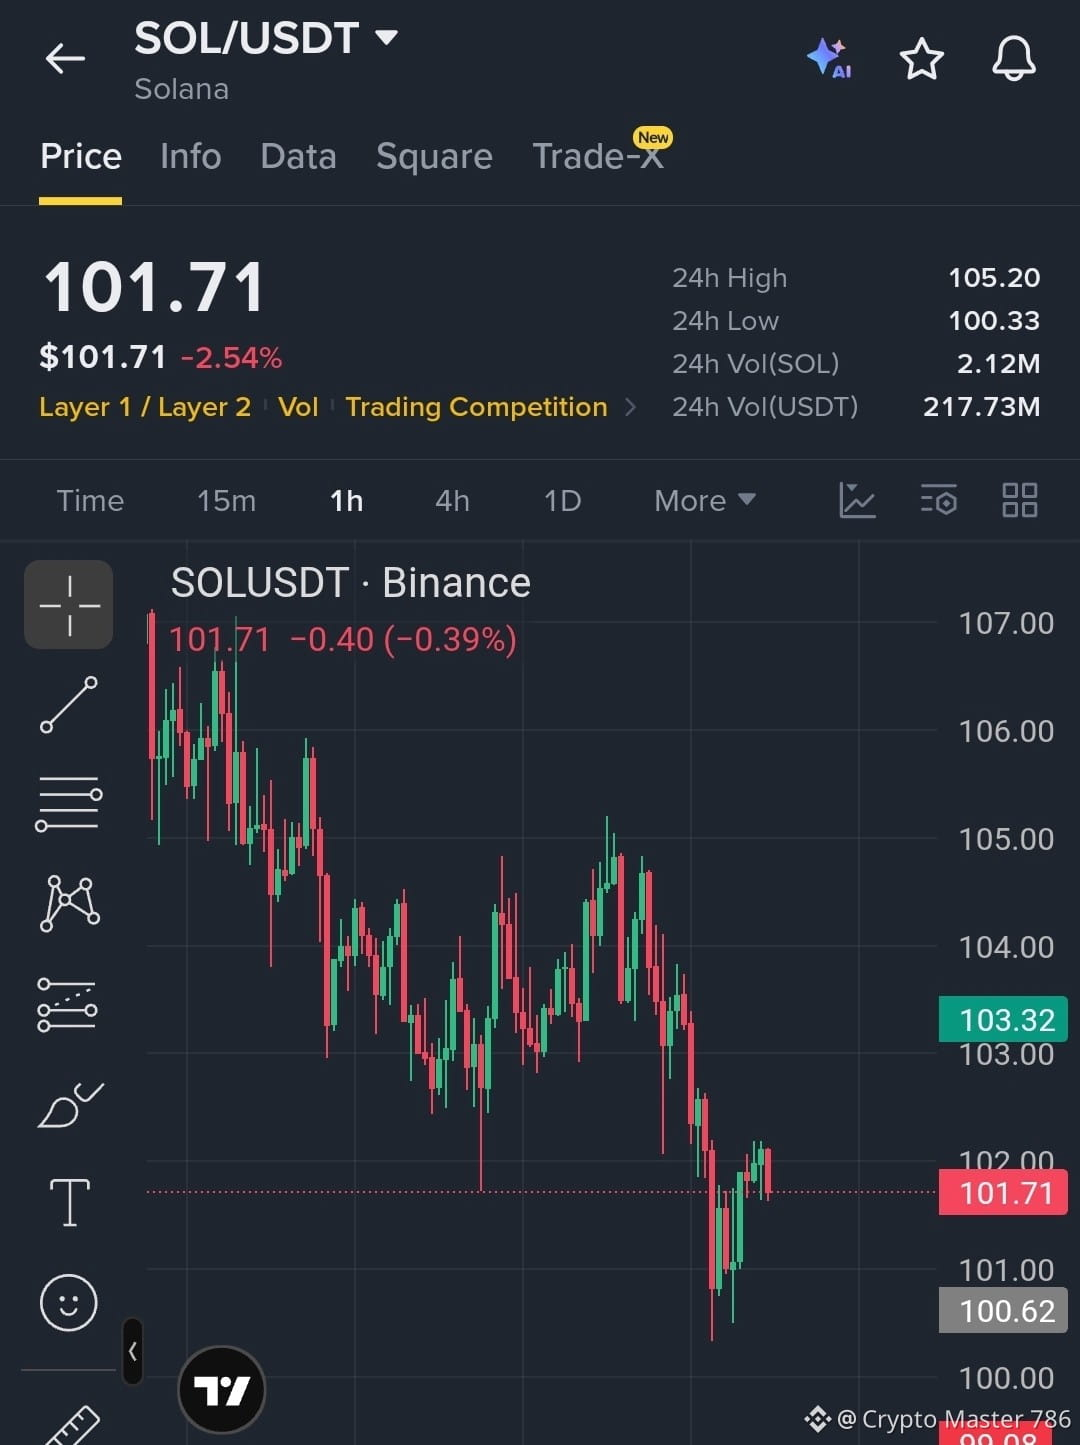
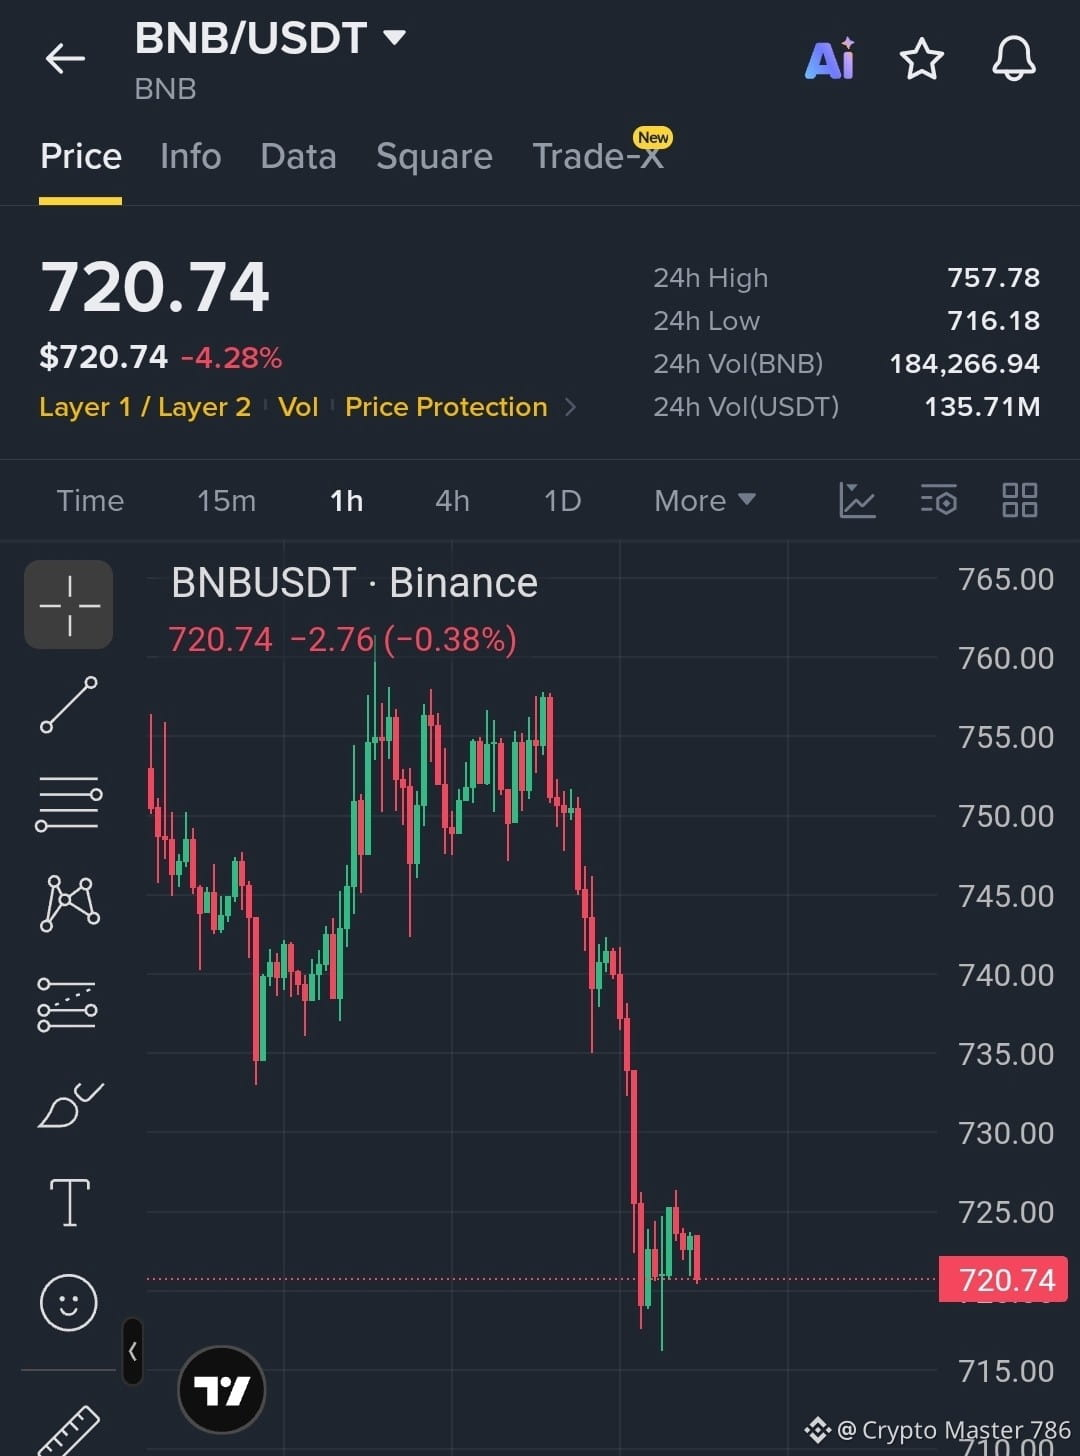
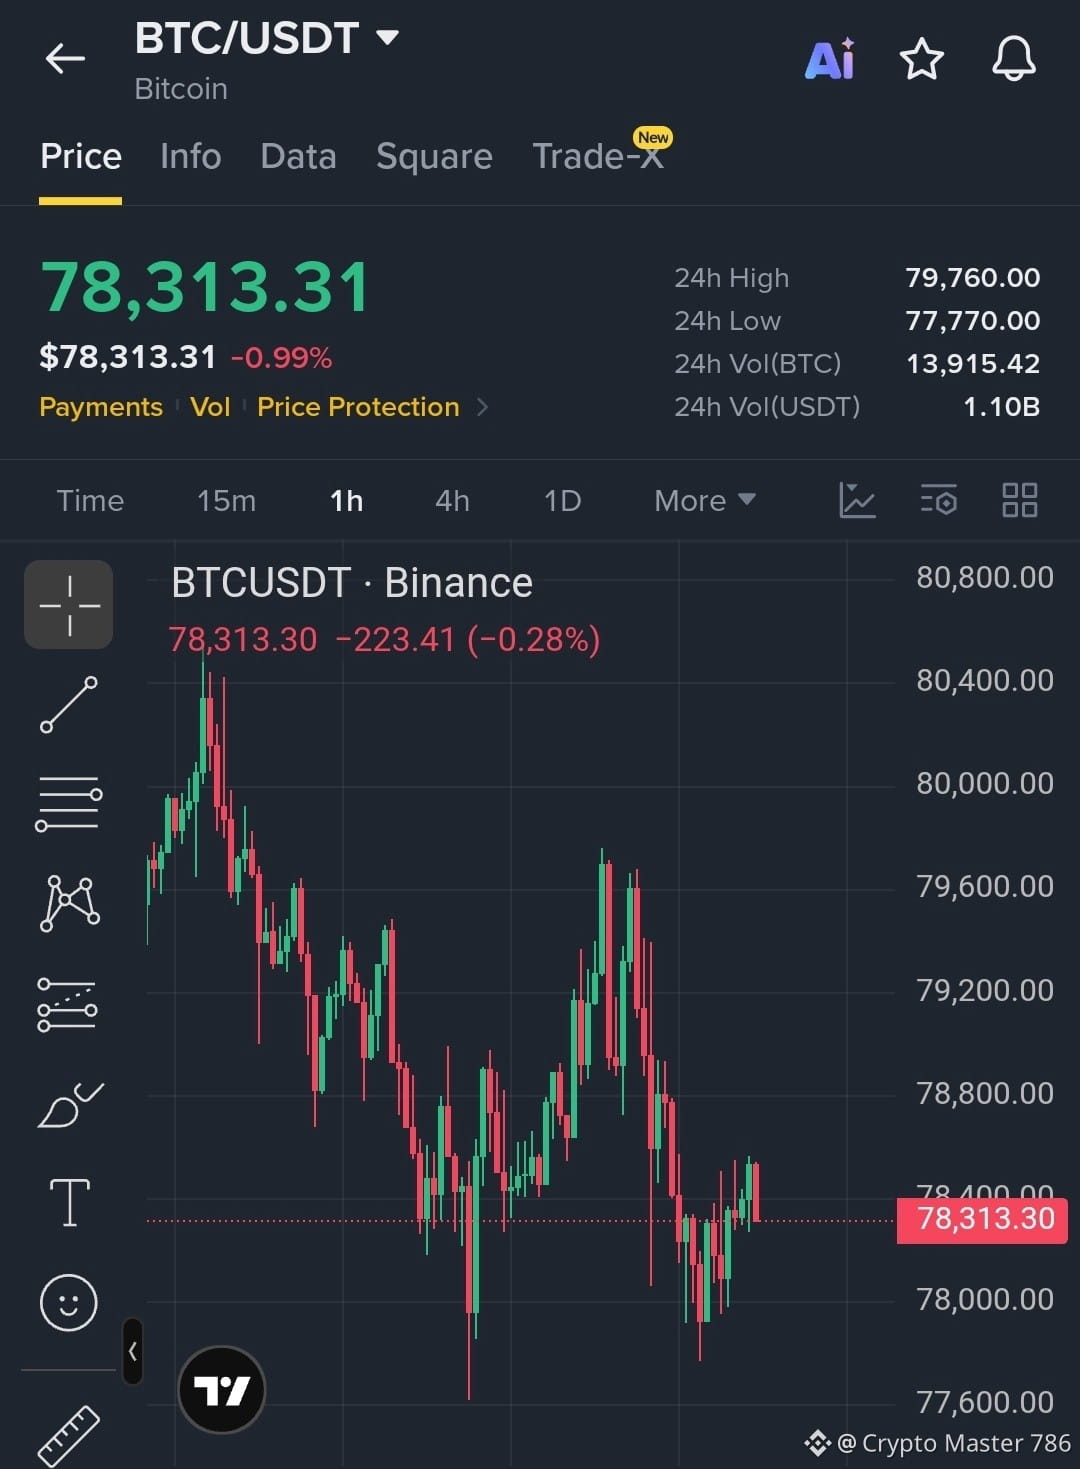
LISTEN DEAR FAM — WATCH THESE THREE CLOSELY‼️ $BTC , $BNB and $SOL are dropping again as selling pressure remains strong. I already reminded you yesterday: don’t open fresh long positions yet. Keep holding your short positions with proper risk management. #BTC — trading around $78.3K #BNB — dropped near $720 #SOL — trading around $101.7 I’m watching all three very closely. Stay active, don’t miss the next move, and enjoy the profits.
LISTEN DEAR FAM — WATCH THESE THREE CLOSELY‼️

$BTC , $BNB and $SOL are dropping again as selling pressure remains strong.

I already reminded you yesterday: don’t open fresh long positions yet. Keep holding your short positions with proper risk management.

#BTC — trading around $78.3K

#BNB — dropped near $720

#SOL — trading around $101.7

I’m watching all three very closely. Stay active, don’t miss the next move, and enjoy the profits.
zye khan:
update me time to time of crypto latest .
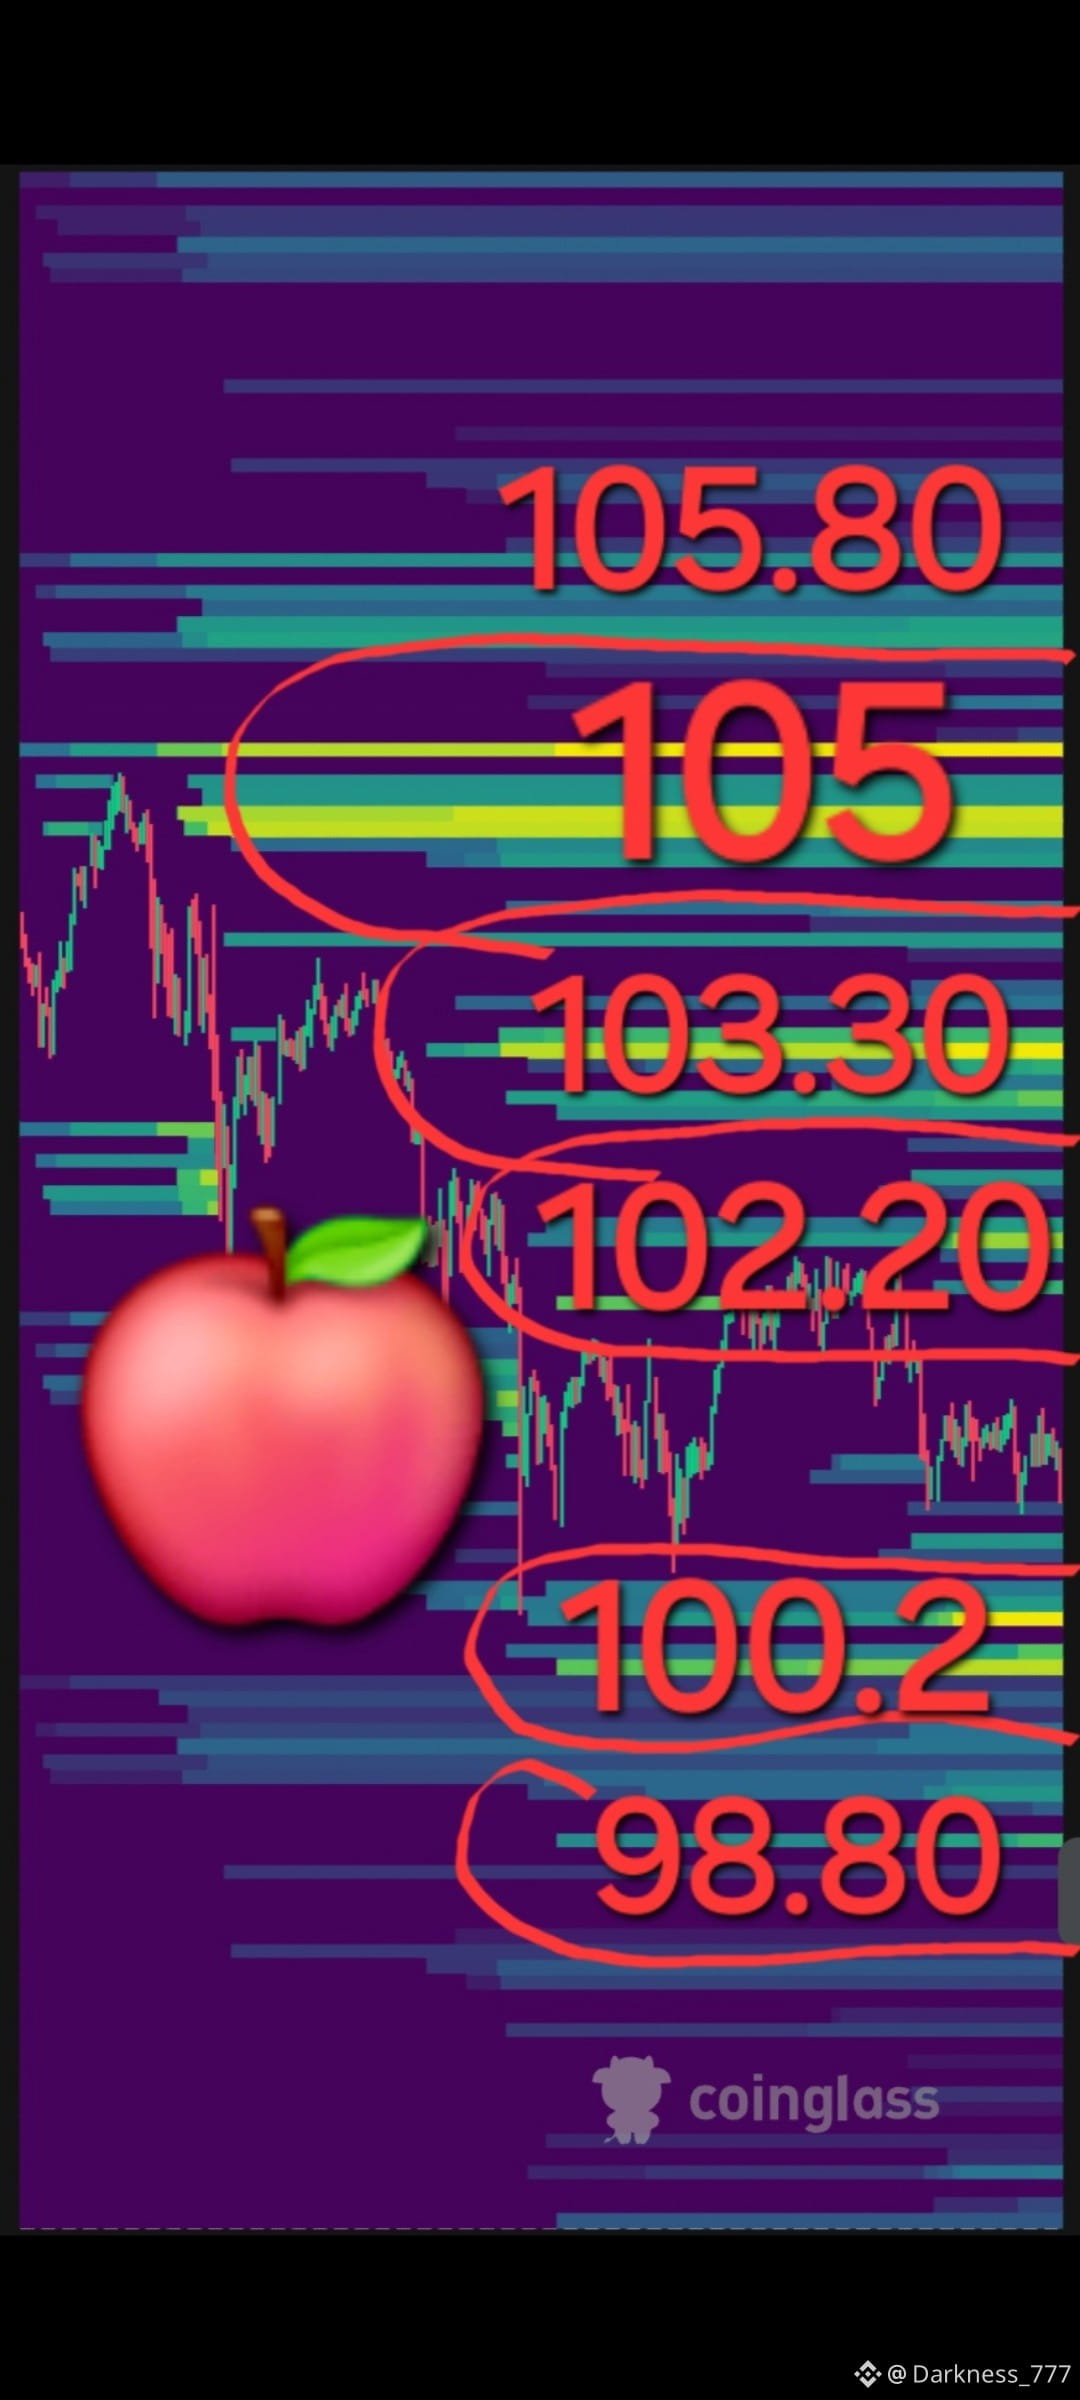
🧬 🎯 $SOL : THE LAST PURCHASERS’ LINE — WHERE WILL THE MAKER FIND LIQUIDITY?🔬🍎 Solana dipped to $101.01, making a local poke to the low $100.33 and edging right up to the critical SuperTrend support level. ​🔎 OPERATIONAL DATA: 1️⃣ Whale Flow 🐋: Large-capital outflow! The daily outflow of big orders reached -262,319. The 5-day accumulation balance flipped to minus -91,693. 2️⃣ Market Energy 🏔️⚡: OI dropped to 8.0M SOL, shedding excess heat. The funding rate turned negative. 3️⃣ L/S Trap 📊: Total L/S accounts are rising to 2.27, while top traders per account are holding at high levels of 2.50. The market remains overheated in longs. 4️⃣ CVD & Z-SCORE 🛠️: Z-Score discharged into the negative zone -0.02. CVD is deeply negative at -0.99, indicating that selling dominates. ​🎯 LIQUIDITY MAGNETS: ⬆️ UP $103 – $105: The “Golden Apple” zone 🟡 ⬇️ DOWN $100.3 – $98.5: The “Poisoned Apple” zone 🩸 ​🍎 Mini Apple VERDICT: Status — Poisoned Trap 🩸 A negative Z-Score and negative funding create the technical basis for a rebound. However, the strong daily whale outflow and overheated overall L/S are warning signals: if price breaks and closes below SuperTrend, the maker will trigger a cascading stop sweep with a drop down to $98.5. ​#sol #MiniApple #BinanceSquare {future}(SOLUSDT)
🧬 🎯 $SOL : THE LAST PURCHASERS’ LINE — WHERE WILL THE MAKER FIND LIQUIDITY?🔬🍎
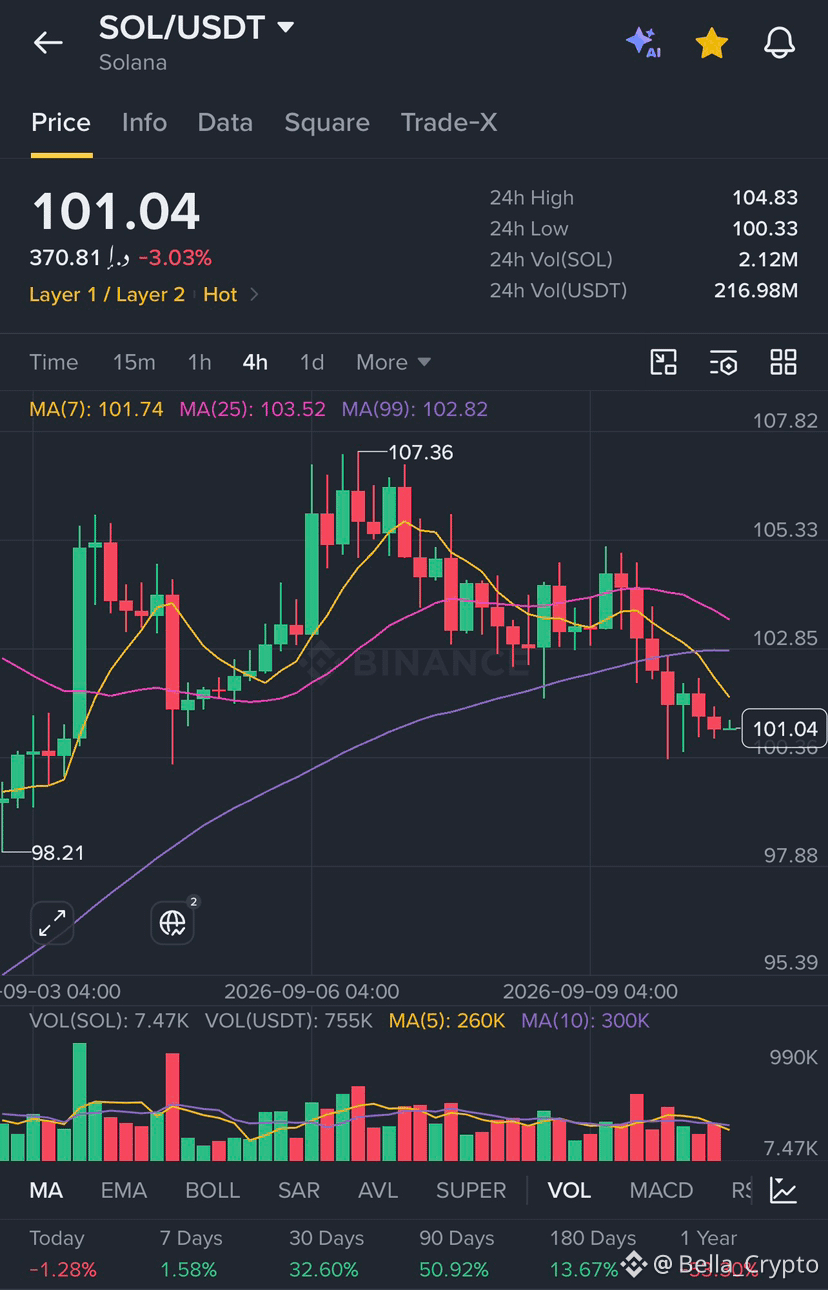
Solana dipped to $101.01, making a local poke to the low $100.33 and edging right up to the critical SuperTrend support level.
​🔎 OPERATIONAL DATA:
1️⃣ Whale Flow 🐋: Large-capital outflow! The daily outflow of big orders reached -262,319. The 5-day accumulation balance flipped to minus -91,693.
2️⃣ Market Energy 🏔️⚡: OI dropped to 8.0M SOL, shedding excess heat. The funding rate turned negative.
3️⃣ L/S Trap 📊: Total L/S accounts are rising to 2.27, while top traders per account are holding at high levels of 2.50. The market remains overheated in longs.
4️⃣ CVD & Z-SCORE 🛠️: Z-Score discharged into the negative zone -0.02. CVD is deeply negative at -0.99, indicating that selling dominates.
​🎯 LIQUIDITY MAGNETS:
⬆️ UP $103 – $105: The “Golden Apple” zone 🟡
⬇️ DOWN $100.3 – $98.5: The “Poisoned Apple” zone 🩸
​🍎 Mini Apple VERDICT:
Status — Poisoned Trap 🩸
A negative Z-Score and negative funding create the technical basis for a rebound. However, the strong daily whale outflow and overheated overall L/S are warning signals: if price breaks and closes below SuperTrend, the maker will trigger a cascading stop sweep with a drop down to $98.5.
#sol #MiniApple #BinanceSquare
·
--
Bullish
🚦 TRADING SIGNAL — $SOL / USDT 📈 Direction: LONG (Buy) Entry Zone: $102.80 – $103.50 Leverage: 5x to 20x Take Profit 1: $104.80 Take Profit 2: $106.20 Take Profit 3: $107.40 Stop Loss: $101.50 📊 Technical Rationale: Sell exhaustion reflected in the RCI Tape (-75.76) over the $103.00 area. Early recovery toward the 21-period moving average ($103.70) and subsequent search for the previous high ($107.46). 👇 Enter your position from the trading widget! #solana #sol #CryptoSignals #Binance #TradingView {spot}(SOLUSDT)
🚦 TRADING SIGNAL — $SOL / USDT 📈
Direction: LONG (Buy)
Entry Zone: $102.80 – $103.50
Leverage: 5x to 20x
Take Profit 1: $104.80
Take Profit 2: $106.20
Take Profit 3: $107.40
Stop Loss: $101.50
📊 Technical Rationale:
Sell exhaustion reflected in the RCI Tape (-75.76) over the $103.00 area. Early recovery toward the 21-period moving average ($103.70) and subsequent search for the previous high ($107.46).
👇 Enter your position from the trading widget!
#solana #sol #CryptoSignals #Binance #TradingView
SOL quotes today at 104.45 USDT on Binance. Over the last 24 hours, it opened at 102.77, reached a maximum of 105.20, and a minimum of 101.72. That implies an approximate increase of 1.63%, so the immediate trend is bullish in the short term. The current price is closer to the daily high than to the daily low, indicating intraday strength. However, since it remains within the day’s range, there could still be brief pullbacks due to profit-taking. In summary, SOL shows positive momentum today, with a bullish bias in the short term, although with the usual volatility of the crypto market.$SOL {spot}(SOLUSDT) #sol #solana
SOL quotes today at 104.45 USDT on Binance. Over the last 24 hours, it opened at 102.77, reached a maximum of 105.20, and a minimum of 101.72. That implies an approximate increase of 1.63%, so the immediate trend is bullish in the short term. The current price is closer to the daily high than to the daily low, indicating intraday strength. However, since it remains within the day’s range, there could still be brief pullbacks due to profit-taking. In summary, SOL shows positive momentum today, with a bullish bias in the short term, although with the usual volatility of the crypto market.$SOL
#sol #solana
🔥 SOLANA IS CONSOLIDATING NEAR $100 — AND THE NEXT MOVE COULD SET THE MOMENTUM. $SOL is trading today near $103, after weeks of recovery and an increase of approximately 35% over the last 30 days. 👀🚀 Even with this recovery, the current area deserves attention. SOL is consolidating after facing resistance close to $105–110, while buyers try to defend the important $100 range. 📊 Levels to watch: 🟢 $100–102: immediate support 🟢 $97–98: more important support 🔴 $105–107: first resistance 🚀 $110: decisive area for a stronger move 💰 Solana maintains a market cap close to $60.6 billion, while daily volume is above $3 billion, showing that the asset remains among the most liquid and relevant in the market. 🔥 The current scenario: ⚡ SOL near $103 📈 About 35% gain in 30 days 💰 Market cap near $60 billion 📊 Daily volume above $3 billion 🛡️ $100 as an important area 🔥 $105–107 as resistance 🚀 $110 on the radar ⚠️ The risk is losing $100. If this area isn’t defended, SOL could start retesting lower supports again. But there’s an interesting point: even after the recent recovery, the price is consolidating instead of quickly giving back all the gains. This keeps the current area on buyers’ radar. If Solana defends $100–102 and breaks again above $105–107, the $110 region could quickly return to the market’s focus. 👀🔥 With strong liquidity, one of the biggest ecosystems in the market, and signs of recovery over the last month, SOL continues to be one of the most interesting assets to watch right now. 🚀 ⚠️ Not financial advice. Cryptocurrencies are volatile assets. Do your own research and invest only what you can afford to lose. #sol #solana #sol板块
🔥 SOLANA IS CONSOLIDATING NEAR $100 — AND THE NEXT MOVE COULD SET THE MOMENTUM.

$SOL is trading today near $103, after weeks of recovery and an increase of approximately 35% over the last 30 days. 👀🚀

Even with this recovery, the current area deserves attention. SOL is consolidating after facing resistance close to $105–110, while buyers try to defend the important $100 range.

📊 Levels to watch:

🟢 $100–102: immediate support
🟢 $97–98: more important support
🔴 $105–107: first resistance
🚀 $110: decisive area for a stronger move

💰 Solana maintains a market cap close to $60.6 billion, while daily volume is above $3 billion, showing that the asset remains among the most liquid and relevant in the market.

🔥 The current scenario:

⚡ SOL near $103
📈 About 35% gain in 30 days
💰 Market cap near $60 billion
📊 Daily volume above $3 billion
🛡️ $100 as an important area
🔥 $105–107 as resistance
🚀 $110 on the radar

⚠️ The risk is losing $100. If this area isn’t defended, SOL could start retesting lower supports again.

But there’s an interesting point: even after the recent recovery, the price is consolidating instead of quickly giving back all the gains. This keeps the current area on buyers’ radar.

If Solana defends $100–102 and breaks again above $105–107, the $110 region could quickly return to the market’s focus. 👀🔥

With strong liquidity, one of the biggest ecosystems in the market, and signs of recovery over the last month, SOL continues to be one of the most interesting assets to watch right now. 🚀

⚠️ Not financial advice. Cryptocurrencies are volatile assets. Do your own research and invest only what you can afford to lose.
#sol #solana #sol板块
·
--
Bullish
$SOL 🚨 The interesting part isn’t the price at $104 it’s how dramatically the chart’s character has changed. On the 1D chart, SOL recovered from the $60 area and eventually pushed above $100, but the latest candles show a very different mood: consolidation. On the 4H chart, price has repeatedly struggled around the $105–$107 zone, while the 15m and 1h charts show choppy back-and-forth action rather than a clean breakout. RSI is sitting around the mid 50s across the shorter timeframes, suggesting momentum is positive but not overheated. Volume has also cooled compared with the earlier surge. The key lesson? After a major move, holding gains can be just as important as making them.👀 📍 Entry Zone: 102.50 – 103.20 (bullish order block + sell-side liquidity sweep + discount area) 🛑 Stop Loss * Below 101.20 (below structural liquidity / invalidation zone) 🎯 Take Profits * TP1: 104.90 → internal buy-side liquidity * TP2: 105.60 – 106.10 → 1H resistance / supply * TP3: 107.00 – 107.40 → major buy-side liquidity / 1H swing high * TP4: 110.00 – 110.60+ → major 4H/Daily resistance + extension if bullish trend continues Trade $SOL here 👇🏻👇🏻 {future}(SOLUSDT) #sol #solana #TradingSignals #TradingCommunity
$SOL 🚨 The interesting part isn’t the price at $104 it’s how dramatically the chart’s character has changed.

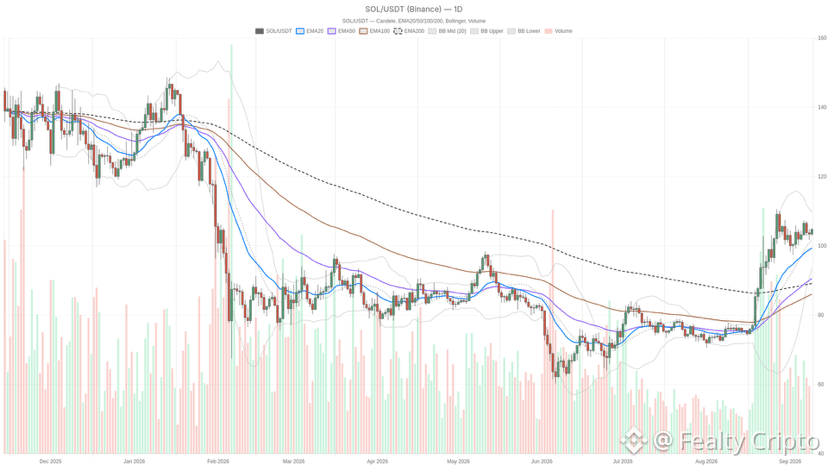
On the 1D chart, SOL recovered from the $60 area and eventually pushed above $100, but the latest candles show a very different mood: consolidation. On the 4H chart, price has repeatedly struggled around the $105–$107 zone, while the 15m and 1h charts show choppy back-and-forth action rather than a clean breakout.

RSI is sitting around the mid 50s across the shorter timeframes, suggesting momentum is positive but not overheated. Volume has also cooled compared with the earlier surge.

The key lesson? After a major move, holding gains can be just as important as making them.👀

📍 Entry Zone: 102.50 – 103.20
(bullish order block + sell-side liquidity sweep + discount area)

🛑 Stop Loss * Below 101.20
(below structural liquidity / invalidation zone)

🎯 Take Profits

* TP1: 104.90 → internal buy-side liquidity
* TP2: 105.60 – 106.10 → 1H resistance / supply
* TP3: 107.00 – 107.40 → major buy-side liquidity / 1H swing high
* TP4: 110.00 – 110.60+ → major 4H/Daily resistance + extension if bullish trend continues

Trade $SOL here 👇🏻👇🏻
#sol #solana #TradingSignals #TradingCommunity
·
--
Bullish
Solana is trying to break through $105. But the most interesting piece is happening inside the network. 👇👇👇👇👇 $SOL is trading near: $104–105. But instead of only looking at the chart, I would look at DEX activity. In the most recent reported data: Raydium fees grew by approximately 363% over the month. Orca also recorded growth above 80%. This matters because it increases the gap between: price rising through speculation and the network gaining economic activity. At the same time, Solana is facing a technical region close to: $105–110. And today, the Transaction V1 mainnet update is also on the radar. So we have three elements coming together: on-chain activity ↑ network technical catalyst price testing resistance Now I want to see whether these fundamentals can sustain interest after the first wave of the ETF. $SOL What matters most in your analysis of Solana today: price, the ETF, or on-chain activity? #solana #sol #DeFi {spot}(SOLUSDT)
Solana is trying to break through $105. But the most interesting piece is happening inside the network.

👇👇👇👇👇

$SOL is trading near:

$104–105.

But instead of only looking at the chart, I would look at DEX activity.

In the most recent reported data:

Raydium fees grew by approximately 363% over the month.

Orca also recorded growth above 80%.

This matters because it increases the gap between:

price rising through speculation and
the network gaining economic activity.

At the same time, Solana is facing a technical region close to:

$105–110.

And today, the Transaction V1 mainnet update is also on the radar.

So we have three elements coming together:

on-chain activity ↑
network technical catalyst
price testing resistance

Now I want to see whether these fundamentals can sustain interest after the first wave of the ETF.

$SOL

What matters most in your analysis of Solana today: price, the ETF, or on-chain activity?

#solana #sol #DeFi
🧬 🎯 $SOL : TRAP FOR $103.5 OR PREPARATION FOR AN EXPLOSION?🔬🍎 ​Solana is trading around $103.49, bouncing after a local high of $105.20 and holding above the SuperTrend line. ​🔎 OPERATIONAL DATA: 1️⃣ Whale Flow 🐋: Amid a daily outflow of large orders -36,111 SOL, the 5-day accumulation base confidently holds in the green zone +180,480 SOL. 2️⃣ Market Energy 🏔️⚡: OI unloaded leverage down to the 7.9M–8.0M SOL level. The funding rate is calm and moderately bullish. 3️⃣ L/S Trap 📊: The total L/S of accounts has dropped to a working 2.04, even though top traders are still heavily overheated on longs (2.36). 4️⃣ CVD & Z-SCORE 🛠️: The Z-Score is fully discharged to 0.33, and the negative CVD delta (-0.78) shows active limit-order absorption of sell pressure. ​🎯 LIQUIDITY MAGNETS: ⬆️ UP $105–$106: The “Golden Apple” zone 🟡 ⬇️ DOWN $102–$101.5: The “Poisoned Apple” zone 🩸 ​🍎 Mini Apple VERDICT: Status — Golden Apple 🟡 A discharged Z-Score, OI tension easing, and 5-day whale accumulation set the stage for a push to $105.0–$107.5. However, due to the overheated L/S of the leaders, if $103 is lost, the maker may stage a quick wick down to $101.5 to sweep excess leverage before the next move. ​#SOL #MiniApple #BinanceSquare #Darkness_777 {future}(SOLUSDT)
🧬 🎯 $SOL : TRAP FOR $103.5 OR PREPARATION FOR AN EXPLOSION?🔬🍎
​Solana is trading around $103.49, bouncing after a local high of $105.20 and holding above the SuperTrend line.
​🔎 OPERATIONAL DATA:
1️⃣ Whale Flow 🐋: Amid a daily outflow of large orders -36,111 SOL, the 5-day accumulation base confidently holds in the green zone +180,480 SOL.
2️⃣ Market Energy 🏔️⚡: OI unloaded leverage down to the 7.9M–8.0M SOL level. The funding rate is calm and moderately bullish.
3️⃣ L/S Trap 📊: The total L/S of accounts has dropped to a working 2.04, even though top traders are still heavily overheated on longs (2.36).
4️⃣ CVD & Z-SCORE 🛠️: The Z-Score is fully discharged to 0.33, and the negative CVD delta (-0.78) shows active limit-order absorption of sell pressure.
​🎯 LIQUIDITY MAGNETS:
⬆️ UP $105–$106: The “Golden Apple” zone 🟡
⬇️ DOWN $102–$101.5: The “Poisoned Apple” zone 🩸
​🍎 Mini Apple VERDICT:
Status — Golden Apple 🟡
A discharged Z-Score, OI tension easing, and 5-day whale accumulation set the stage for a push to $105.0–$107.5. However, due to the overheated L/S of the leaders, if $103 is lost, the maker may stage a quick wick down to $101.5 to sweep excess leverage before the next move.
#SOL #MiniApple #BinanceSquare #Darkness_777
·
--
Bullish
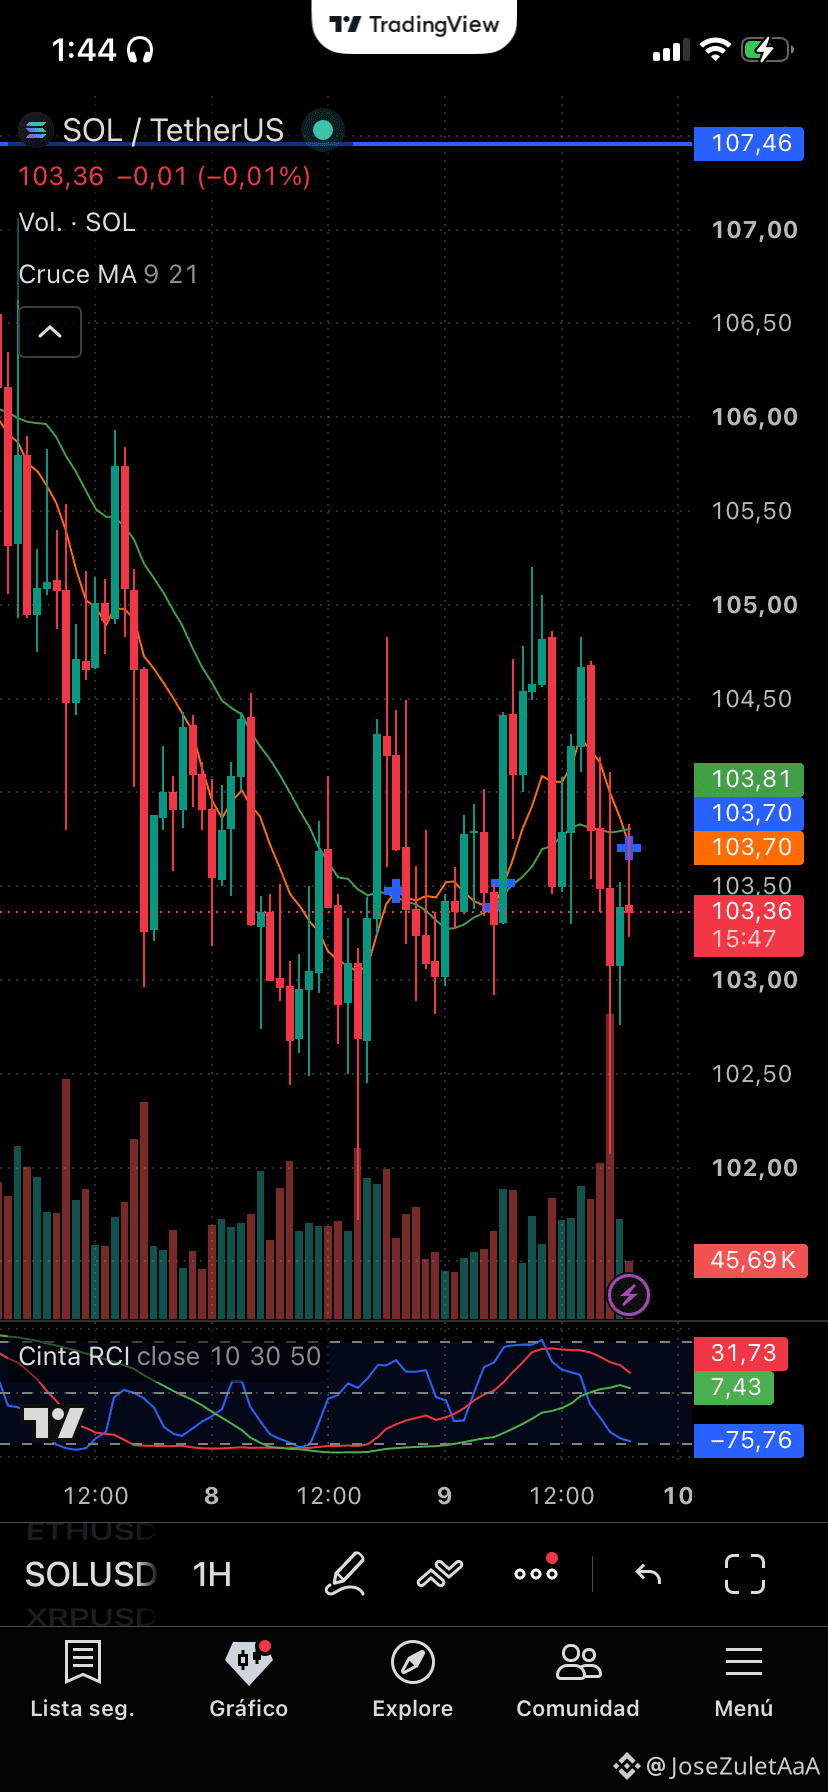
🚨 SOLANA RETESTS SUPPORT ZONE! RCI SINKS TO -75.76 AT $103.36 🚨 $SOL registers a slight pullback trading at $103.36 (-0.01%), staying just above its local support after a quick sweep toward $102.00. The RCI Tape indicator on the 1H timeframe shows a strong oversold condition (-75.76), placing the asset in a potential rebound area toward the immediate resistance represented by the MA9 ($103.81) and the MA21 ($103.70), with targets up to the high of $107.46. Is this the perfect entry before the next bullish impulse? Comment your move and trade below! 👇 #solana #sol #CryptoNews #Solanaecosystem #BinanceSquare
🚨 SOLANA RETESTS SUPPORT ZONE! RCI SINKS TO -75.76 AT $103.36 🚨
$SOL registers a slight pullback trading at $103.36 (-0.01%), staying just above its local support after a quick sweep toward $102.00.
The RCI Tape indicator on the 1H timeframe shows a strong oversold condition (-75.76), placing the asset in a potential rebound area toward the immediate resistance represented by the MA9 ($103.81) and the MA21 ($103.70), with targets up to the high of $107.46.
Is this the perfect entry before the next bullish impulse? Comment your move and trade below! 👇
#solana #sol #CryptoNews #Solanaecosystem #BinanceSquare
isaias2k24:
muy detallado. Muchas gracias.
🔥 $SOL ПО $103: COMPRESSION BEFORE THE EXPLOSION! Where will the impulse go? While most people are waiting for a breakout, Solana is squeezed into a narrow range between support of $101.53 and resistance of $105.27. Volumes have dropped, and the RSI has cooled to neutral 53—this is a classic spring compression before a powerful move. Transaction V1 has given developers more freedom, but the market is still waiting. On the daily chart, holding the Bollinger midline ($101.50) keeps the bullish structure. Setup: Entry: $101.8 – $103.2 Targets: $105.2 / $110.6 / $115.8 Stop: $99.8 Are you catching the $105 breakout, or waiting for a pullback to $95? #sol #solana #cryptotrading #BinanceSquare {spot}(SOLUSDT)
🔥 $SOL ПО $103: COMPRESSION BEFORE THE EXPLOSION! Where will the impulse go?
While most people are waiting for a breakout, Solana is squeezed into a narrow range between support of $101.53 and resistance of $105.27. Volumes have dropped, and the RSI has cooled to neutral 53—this is a classic spring compression before a powerful move.
Transaction V1 has given developers more freedom, but the market is still waiting. On the daily chart, holding the Bollinger midline ($101.50) keeps the bullish structure.
Setup:
Entry: $101.8 – $103.2
Targets: $105.2 / $110.6 / $115.8
Stop: $99.8
Are you catching the $105 breakout, or waiting for a pullback to $95?
#sol #solana #cryptotrading #BinanceSquare
Just today Solana activates a change that few are discussing The "Transaction V1" update goes live on September 9 on the Solana network, enabling transactions more than 3 times larger than before—something key for more complex applications (DeFi, gaming, tokenization). This comes after, by the end of August, validators approved another change that doubled the annual "deflation" rate of SOL, from 15% to 30%, meaning fewer new coins are issued over time. It’s not a "hidden" coin like yesterday’s, but it does have real, concrete technical catalysts this week that many generic posts about "$SOL went up X%" aren’t explaining. Are you following the technical updates, or just the price? 👇 #Solana #SOL #Altcoins #CreatorPad
Just today Solana activates a change that few are discussing

The "Transaction V1" update goes live on September 9 on the Solana network, enabling transactions more than 3 times larger than before—something key for more complex applications (DeFi, gaming, tokenization).

This comes after, by the end of August, validators approved another change that doubled the annual "deflation" rate of SOL, from 15% to 30%, meaning fewer new coins are issued over time.

It’s not a "hidden" coin like yesterday’s, but it does have real, concrete technical catalysts this week that many generic posts about "$SOL went up X%" aren’t explaining.

Are you following the technical updates, or just the price? 👇

#Solana #SOL #Altcoins #CreatorPad
🚀 $SOL POISED FOR 10X BY 2029? 🦈 📊 Solana’s recent order‑block accumulation on the 4H chart reveals smart‑money liquidity sweeps, with volume spikes carving a clear bullish corridor. 📈 The protocol’s upcoming sharding upgrade aligns with a historic demand‑gap that institutional players have been quietly filling, suggesting a potential upside trajectory that dwarfs the broader market’s pace. 💡 With on‑chain activity rebounding and a tightening supply‑demand dynamic, the risk‑reward profile appears compelling for a multi‑year swing. 🤔 Are you ready to ride the institutional wave or waiting for the next liquidity trap? 👇 ⚠️ Not financial advice. Always manage your risk. 🛡️ 🏷️ #SOL #Altcoin #SmartMoney #LongSetup #Crypto 🔥 💎
🚀 $SOL POISED FOR 10X BY 2029? 🦈

📊 Solana’s recent order‑block accumulation on the 4H chart reveals smart‑money liquidity sweeps, with volume spikes carving a clear bullish corridor. 📈 The protocol’s upcoming sharding upgrade aligns with a historic demand‑gap that institutional players have been quietly filling, suggesting a potential upside trajectory that dwarfs the broader market’s pace.

💡 With on‑chain activity rebounding and a tightening supply‑demand dynamic, the risk‑reward profile appears compelling for a multi‑year swing. 🤔 Are you ready to ride the institutional wave or waiting for the next liquidity trap? 👇

⚠️ Not financial advice. Always manage your risk. 🛡️

🏷️ #SOL #Altcoin #SmartMoney #LongSetup #Crypto

🔥 💎
$SOL Four hours in a row with five consecutive bearish candles. It was smashed all the way from 104.53 down to 100.19. There hasn’t been a decent bounce. This old-school L1 chain is weak now. It used to compete for market dominance with Ethereum as a high-performance network, but its price action is showing serious weakness. It’s not the kind of low-volume, drifting-down decline—it’s with volume. 5,008,585 SOL were dumped into the last four-hour candle with heavy volume, directly breaking through the 102 support. The signals are clear: the bears are in control. In the last 24 hours, the high was 105.19 and the low was 100.19, with a 5% range. It closed at 101.94, down 1.88%. This isn’t a violent collapse—it’s like a dull knife cutting into you: one candle after another, with the longs having no strength left to resist. Market sentiment is rather cold. The funding rate is -0.0033%, meaning shorts are paying for longs. What does that imply? The people shorting aren’t scared of paying funding—they think it can still go lower. The mark price 101.944 and the index price 102.002 are basically aligned, with no abnormal premium. This isn’t a contract-driven move; spot is also selling. Watch the large players by volume. That four-hour megadump bearish candle of 5 million SOL is the turning point. Before that, there were 2.87 million and 2.75 million SOL—those weren’t small, but the direction was still oscillating. After the huge volume spike, the whole price center of gravity dropped by a step. The big players sold near 104, and only stopped dumping once the price was below 102. Now price is consolidating with reduced volume between 101 and 102. Trading volume dropped from 5 million to 760,000. Sell pressure has been temporarily released, but nobody is stepping in as buyers. The volume-price structure isn’t encouraging: down moves with rising volume, and rebounds with shrinking volume. Total traded value over 24 hours is $1.806 billion—not low. But looking at the four-hour level volume distribution: in the down leg, the average is 3 million to 5 million SOL; in the rebound leg, only 1.3 million to 2.3 million. That’s a classic distribution/outflow structure. It’s not that longs don’t want to buy—it’s that they can’t catch the bids. K-line details are worth noting. The last six four-hour candles: open 104.53 → close 103.02; open 103.02 → close 102.30; open 102.30 → close 101.51; open 101.50 → close 101.78; open 101.78 → close 101.94. With each bearish candle, the real body gets smaller, and the lower wicks get shorter. This isn’t a stop-here signal; it shows bearish momentum is fading, but the bulls also have no power to counterattack. After the probe wick around 100.19, price was pulled back quickly, suggesting someone is defending around 100—but the defense isn’t actively pushing upward. Support levels: 100.19, 100.42, 101.58. 100 is the psychological line—break it and look for 98. Resistance levels: 104.79, 105.03, 105.19. Even getting to 103 in the short term looks tough. My bias is bearish. Solana’s ecosystem is indeed active—Meme coins, DePIN, and DeFi are all running on it, and on-chain data isn’t bad. But price action doesn’t lie. Funds are flowing out, the technical structure has deteriorated, and there’s no reversal signal in the near term. Nini’s plan: Current price is 101.94. If it bounces up into the 103.5 to 104 zone, short with a light position and set a stop-loss at 105.5. If it directly breaks below 100.19, then wait for a pullback near 100 to go long for a short-term bounce, with a stop-loss at 99. Both directions are possible, but position sizing must be kept within 5% of total capital. In this kind of weak market, staying alive matters more than making money. If you need a customized strategy, you can find Nini. #SOL #Layer1 #public chain
$SOL Four hours in a row with five consecutive bearish candles. It was smashed all the way from 104.53 down to 100.19. There hasn’t been a decent bounce.

This old-school L1 chain is weak now. It used to compete for market dominance with Ethereum as a high-performance network, but its price action is showing serious weakness. It’s not the kind of low-volume, drifting-down decline—it’s with volume. 5,008,585 SOL were dumped into the last four-hour candle with heavy volume, directly breaking through the 102 support.

The signals are clear: the bears are in control. In the last 24 hours, the high was 105.19 and the low was 100.19, with a 5% range. It closed at 101.94, down 1.88%. This isn’t a violent collapse—it’s like a dull knife cutting into you: one candle after another, with the longs having no strength left to resist.

Market sentiment is rather cold. The funding rate is -0.0033%, meaning shorts are paying for longs. What does that imply? The people shorting aren’t scared of paying funding—they think it can still go lower. The mark price 101.944 and the index price 102.002 are basically aligned, with no abnormal premium. This isn’t a contract-driven move; spot is also selling.

Watch the large players by volume. That four-hour megadump bearish candle of 5 million SOL is the turning point. Before that, there were 2.87 million and 2.75 million SOL—those weren’t small, but the direction was still oscillating. After the huge volume spike, the whole price center of gravity dropped by a step. The big players sold near 104, and only stopped dumping once the price was below 102. Now price is consolidating with reduced volume between 101 and 102. Trading volume dropped from 5 million to 760,000. Sell pressure has been temporarily released, but nobody is stepping in as buyers.

The volume-price structure isn’t encouraging: down moves with rising volume, and rebounds with shrinking volume. Total traded value over 24 hours is $1.806 billion—not low. But looking at the four-hour level volume distribution: in the down leg, the average is 3 million to 5 million SOL; in the rebound leg, only 1.3 million to 2.3 million. That’s a classic distribution/outflow structure. It’s not that longs don’t want to buy—it’s that they can’t catch the bids.

K-line details are worth noting. The last six four-hour candles: open 104.53 → close 103.02; open 103.02 → close 102.30; open 102.30 → close 101.51; open 101.50 → close 101.78; open 101.78 → close 101.94. With each bearish candle, the real body gets smaller, and the lower wicks get shorter. This isn’t a stop-here signal; it shows bearish momentum is fading, but the bulls also have no power to counterattack. After the probe wick around 100.19, price was pulled back quickly, suggesting someone is defending around 100—but the defense isn’t actively pushing upward.

Support levels: 100.19, 100.42, 101.58. 100 is the psychological line—break it and look for 98.

Resistance levels: 104.79, 105.03, 105.19. Even getting to 103 in the short term looks tough.

My bias is bearish. Solana’s ecosystem is indeed active—Meme coins, DePIN, and DeFi are all running on it, and on-chain data isn’t bad. But price action doesn’t lie. Funds are flowing out, the technical structure has deteriorated, and there’s no reversal signal in the near term.

Nini’s plan: Current price is 101.94. If it bounces up into the 103.5 to 104 zone, short with a light position and set a stop-loss at 105.5. If it directly breaks below 100.19, then wait for a pullback near 100 to go long for a short-term bounce, with a stop-loss at 99. Both directions are possible, but position sizing must be kept within 5% of total capital. In this kind of weak market, staying alive matters more than making money.

If you need a customized strategy, you can find Nini.

#SOL #Layer1 #public chain
·
--
Bullish
$SOL may be entering a new phase 🚀 After months of weakness, Solana ( $SOL ) finally closed August with a green monthly candle. This is an important change, although one positive month alone doesn’t prove that a long-term trend has completely reversed. The bigger picture is becoming interesting. Solana’s real-world asset market has reached a record $4.35B, while RWA holders have crossed 420,000. Meanwhile, Solana captured around 67% of tracked multichain memecoin DEX volume, showing strong trading activity. If RWA adoption and on-chain activity continue growing, SOL could have stronger fundamentals supporting its next major move. 🔥 #Solana #SOL #Memecoins

$SOL may be entering a new phase 🚀

After months of weakness, Solana ( $SOL ) finally closed August with a green monthly candle. This is an important change, although one positive month alone doesn’t prove that a long-term trend has completely reversed.

The bigger picture is becoming interesting. Solana’s real-world asset market has reached a record $4.35B, while RWA holders have crossed 420,000.

Meanwhile, Solana captured around 67% of tracked multichain memecoin DEX volume, showing strong trading activity.

If RWA adoption and on-chain activity continue growing, SOL could have stronger fundamentals supporting its next major move. 🔥
#Solana #SOL
#Memecoins
206 Atlas:
Monthly green is noise without structure. RWA volume doesn't pay rent on a broken trend.
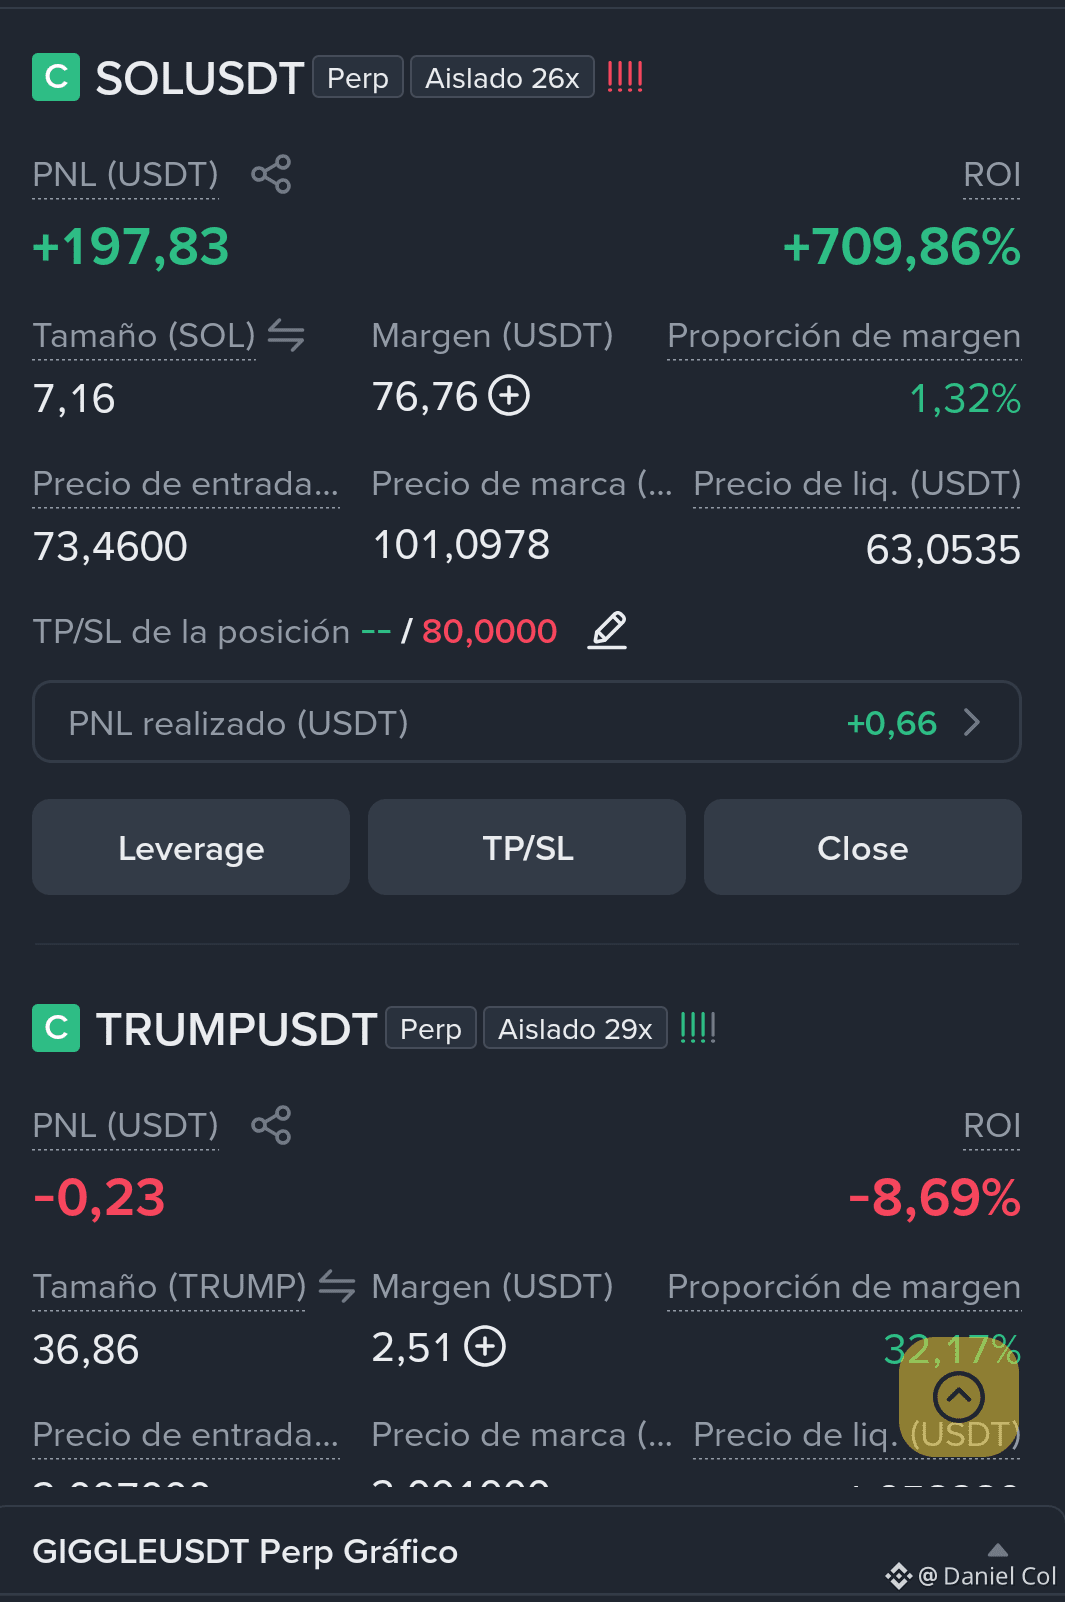
SOL + TRUMP Bearish market, SOL +709% and TRUMP slightly red. I don’t close anything. The positions that hurt today are the ones that pay tomorrow. I’m still in. No drama. Who else is holding through the red without selling? #SOL #TRUMP #PatiencePays $SOL $TRUMP $ESPORTS
SOL + TRUMP
Bearish market, SOL +709% and TRUMP slightly red.
I don’t close anything.
The positions that hurt today are the ones that pay tomorrow.
I’m still in. No drama.
Who else is holding through the red without selling?
#SOL #TRUMP #PatiencePays $SOL $TRUMP $ESPORTS
Heike Checketts YGlK:
Bueno yo mientras continuo acumulando en spot
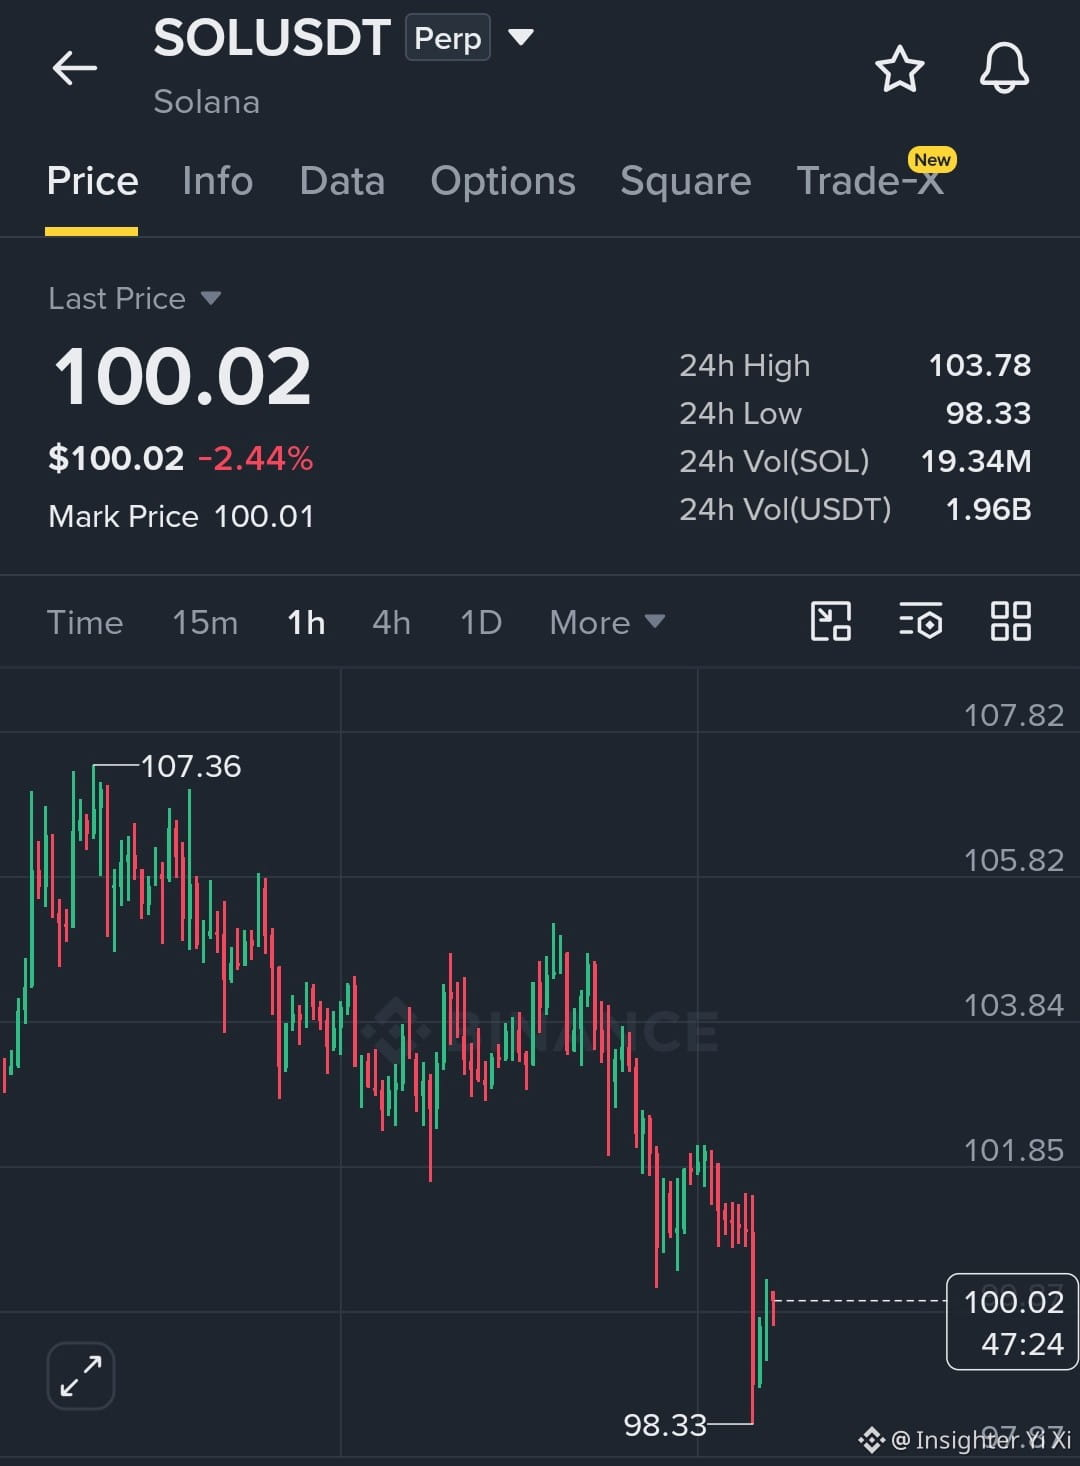
The SK hynix strategy I posted earlier already realized profits in the previous round—the underlying undercurrents have started to surface. For this rebound ($SOL ), we need to stay alert. On the chart, it looks like every time the price pushes upward, it seems to struggle. Volume can’t keep up, and when it spikes higher, it gets pushed back down. This kind of structure is actually quite concerning. The repeated tests of the overhead resistance zone failed to hold, which suggests the buying momentum isn’t being followed through. Instead of chasing the rebound, it’s better to wait for it to come back to the resistance area and then look for an opportunity. Personally, I lean toward a “short from higher” idea. Those two lower levels are worth watching as target zones. Everyone, control your pace—don’t rush. 🔴 Trading direction: Sell short 📍 Entry range: 995.5 – 101.05 🛑 Stop loss: 102.05 🎯 Take profit 1: 98.05 🎯 Take profit 2: 97.05 In still waters lie deep foresight; in the ebb and flow of the market, stay calm and composed. Walk with Sister Fei—together, read the pulse of the surging wealth tide. #SOL Click below to trade 👇
The SK hynix strategy I posted earlier already realized profits in the previous round—the underlying undercurrents have started to surface. For this rebound ($SOL ), we need to stay alert. On the chart, it looks like every time the price pushes upward, it seems to struggle. Volume can’t keep up, and when it spikes higher, it gets pushed back down. This kind of structure is actually quite concerning. The repeated tests of the overhead resistance zone failed to hold, which suggests the buying momentum isn’t being followed through.

Instead of chasing the rebound, it’s better to wait for it to come back to the resistance area and then look for an opportunity. Personally, I lean toward a “short from higher” idea. Those two lower levels are worth watching as target zones. Everyone, control your pace—don’t rush.

🔴 Trading direction: Sell short
📍 Entry range: 995.5 – 101.05
🛑 Stop loss: 102.05
🎯 Take profit 1: 98.05
🎯 Take profit 2: 97.05

In still waters lie deep foresight; in the ebb and flow of the market, stay calm and composed.
Walk with Sister Fei—together, read the pulse of the surging wealth tide.

#SOL

Click below to trade 👇
·
--
$SOL Don’t rush, it doesn’t feel stable yet. Current price 101.14. Current momentum ranks #1. 15m -0.06%, 1h -0.02%. Volume ratio 21.92x. 24h trading volume is about 218M. Personally, I’ll be more cautious at first, but I won’t go all-in here. Let’s see how the next candle moves—don’t get carried away and dump the whole position. Is anyone here brave enough to take it? #SOL #热门币种 #行情分析 #Crypto #BinanceSquare
$SOL Don’t rush, it doesn’t feel stable yet.

Current price 101.14. Current momentum ranks #1. 15m -0.06%, 1h -0.02%. Volume ratio 21.92x. 24h trading volume is about 218M.
Personally, I’ll be more cautious at first, but I won’t go all-in here. Let’s see how the next candle moves—don’t get carried away and dump the whole position.
Is anyone here brave enough to take it?

#SOL #热门币种 #行情分析 #Crypto #BinanceSquare
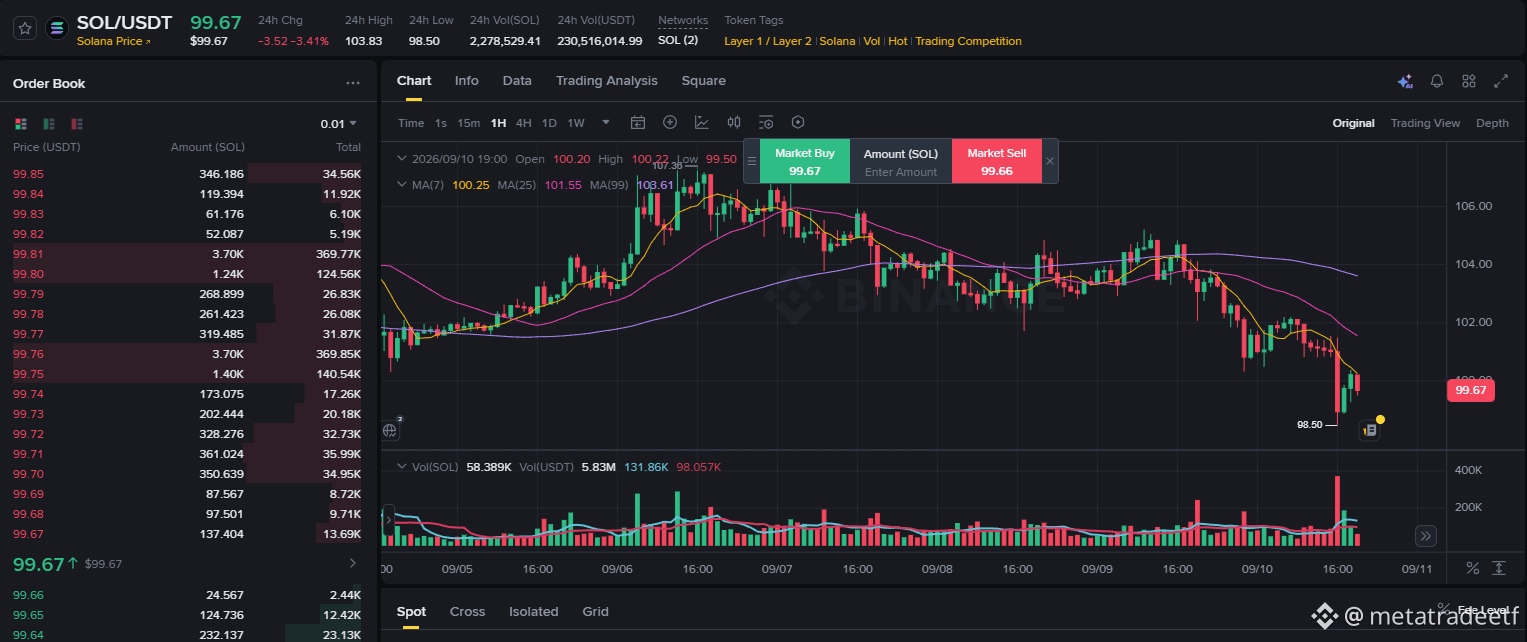
{spot}(SOLUSDT) ☀️$SOL put a prueba el soporte de los 100 USDT SOL/USDT closes near 101.25 USDT, with an approximate drop of 2.15%, after reaching a high of 105.20 and setting a low at 100.33. In 1H, $SOL trades below its 7, 25, and 99-period moving averages, confirming sell pressure in the short term. In addition, the increase in volume during the decline suggests it wasn’t just a sideways move. Even so, the daily structure remains intact: $SOL continues clearly above its 25-day moving average, around 98.26. For now, we’re talking about a short-term correction, not a complete break of the main trend. 🔹 Supports: 100–100.30 | 98.30–99 🔹 Resistances: 102–102.25 | 103.30–103.40 | 104.25–105.20 BTC also remains weak below 78,800–79,200 USDT, limiting any attempt to recover for SOL. If SOL holds the 100 level and recovers 102, it could look to retest 103.30 again. If it loses 100 with volume, it would increase the likelihood of an extension toward 99–98.30. The battle is on: defense of 100 or a slightly deeper correction? 👀 #SOL #Solana #BTC #Bitcoin #Crypto #Altcoins
☀️$SOL put a prueba el soporte de los 100 USDT

SOL/USDT closes near 101.25 USDT, with an approximate drop of 2.15%, after reaching a high of 105.20 and setting a low at 100.33.

In 1H, $SOL trades below its 7, 25, and 99-period moving averages, confirming sell pressure in the short term. In addition, the increase in volume during the decline suggests it wasn’t just a sideways move.

Even so, the daily structure remains intact: $SOL continues clearly above its 25-day moving average, around 98.26. For now, we’re talking about a short-term correction, not a complete break of the main trend.

🔹 Supports: 100–100.30 | 98.30–99
🔹 Resistances: 102–102.25 | 103.30–103.40 | 104.25–105.20

BTC also remains weak below 78,800–79,200 USDT, limiting any attempt to recover for SOL.

If SOL holds the 100 level and recovers 102, it could look to retest 103.30 again. If it loses 100 with volume, it would increase the likelihood of an extension toward 99–98.30.

The battle is on: defense of 100 or a slightly deeper correction? 👀

#SOL #Solana #BTC #Bitcoin #Crypto #Altcoins
🎯 AMBUSH OPERATION | TACTICAL COMPRESSION AND REACCUMULATION IN $SOL Direction 🟢 BULLISH. After sweeping the floor at $70.58 and surging strongly to the $110.60 barrier, $SOL has completed its absorption phase. The price is defensively compressed over the demand block at $100.00 – $102.50, and is currently trading at $103.72, ready to reactivate the buying flow. 📍 TACTICAL LOAD ZONE: Ambush Zone: $100.00 – $102.50 TP1: $110.60 (50% + SL to Break-even) TP2: $118.50 TP3: $128.00 SL: $96.50 ⚡ EXECUTION RULE: Firm defense above $100.00 shows the presence of institutional capital absorbing the supply. A break and close above $106.00 will be the final trigger to go liquidate the $110.60 peak and accelerate the move toward $118.50. 💬 Do you have your orders ready in the defensive band at $101.00, or are you waiting for confirmation by breaking above $106.00? Click on the $SOL widget below to track the order book depth in real time and position yourself on Binance. #sol #solana #Manumax_Sniper
🎯 AMBUSH OPERATION | TACTICAL COMPRESSION AND REACCUMULATION IN $SOL

Direction 🟢 BULLISH. After sweeping the floor at $70.58 and surging strongly to the $110.60 barrier, $SOL has completed its absorption phase. The price is defensively compressed over the demand block at $100.00 – $102.50, and is currently trading at $103.72, ready to reactivate the buying flow.

📍 TACTICAL LOAD ZONE:
Ambush Zone: $100.00 – $102.50
TP1: $110.60 (50% + SL to Break-even)
TP2: $118.50
TP3: $128.00
SL: $96.50

⚡ EXECUTION RULE: Firm defense above $100.00 shows the presence of institutional capital absorbing the supply. A break and close above $106.00 will be the final trigger to go liquidate the $110.60 peak and accelerate the move toward $118.50.

💬 Do you have your orders ready in the defensive band at $101.00, or are you waiting for confirmation by breaking above $106.00?

Click on the $SOL widget below to track the order book depth in real time and position yourself on Binance.

#sol #solana #Manumax_Sniper
$SOL 🔴 Per CryptoSlate, a planned upgrade that could make Solana 300 milliseconds faster and harder for trading bots to exploit may also carry an unintended downside. Solana's proposed 300ms speed upgrade aims to reduce the advantage of trading bots by tightening block times, which could structurally change how high-frequency participants interact with the network. However, the mention of a "hidden cost" suggests potential trade-offs — possibly in validator load or decentralization — that may affect how institutional and developer demand for SOL block space evolves. SOL trades at 101.31, -3.48% over 24h. Called the top on this one? What tipped you off? 👀 #SOL #bearish $SOPH $MARSCOIN
$SOL 🔴
Per CryptoSlate, a planned upgrade that could make Solana 300 milliseconds faster and harder for trading bots to exploit may also carry an unintended downside.
Solana's proposed 300ms speed upgrade aims to reduce the advantage of trading bots by tightening block times, which could structurally change how high-frequency participants interact with the network. However, the mention of a "hidden cost" suggests potential trade-offs — possibly in validator load or decentralization — that may affect how institutional and developer demand for SOL block space evolves.
SOL trades at 101.31, -3.48% over 24h.
Called the top on this one? What tipped you off?
👀 #SOL #bearish $SOPH $MARSCOIN
Log in to explore more content
Join global crypto users on Binance Square
⚡️ Get latest and useful information about crypto.
💬 Trusted by the world’s largest crypto exchange.
👍 Discover real insights from verified creators.
Email / Phone number