

#init
init
5.2M views
10,183 Discussing
Hot
Latest

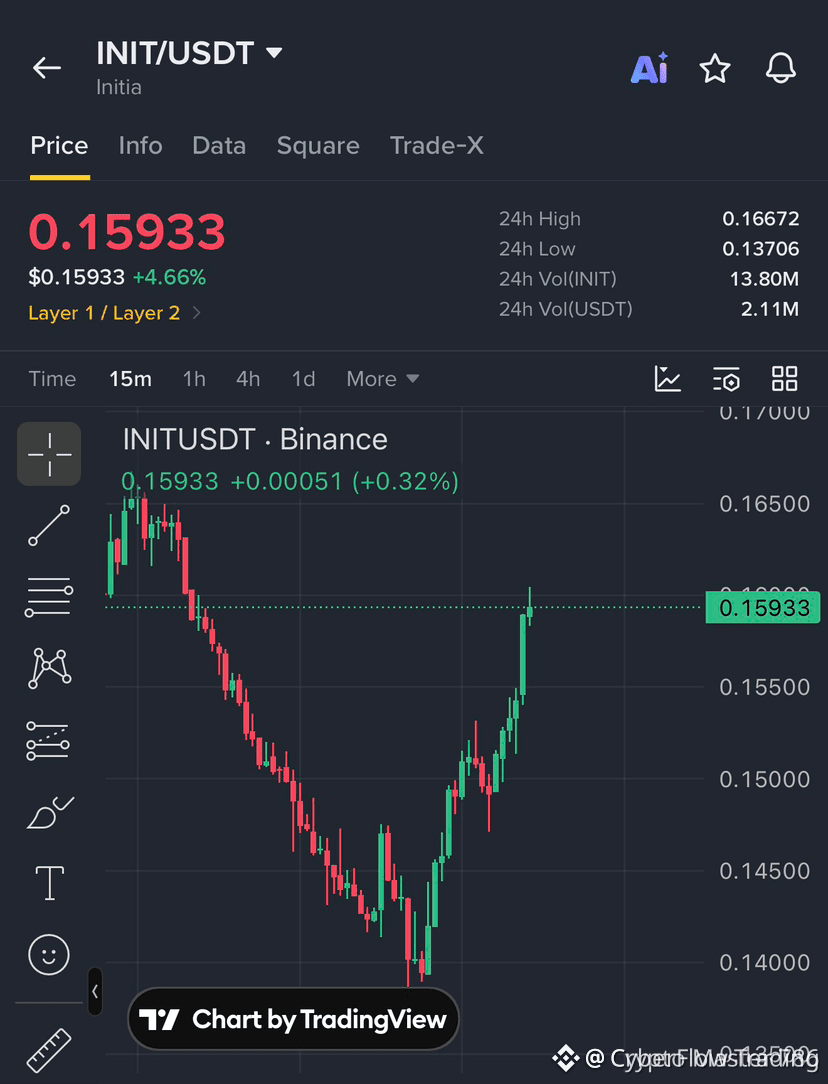
🚀 $INIT REBOUND IGNITES NEW LONG RALLY 🚀
Entry: 0.1570-0.1595 ⚡
Target: 0.1620, 0.1650, 0.1680 🚀
Stop Loss: 0.1535 ⚠️
Smart money is snapping up $INIT as the order block at 0.1580 crumbles, turning the sell wall into fresh buying pressure. 📊 The 4‑hour volume spike screams liquidity sweep, and the bullish divergence on the RSI backs the upside.
With the price flirting above the recent swing high, a clean path to 0.1680 opens. 🦈 Keep an eye on the 0.1535 floor – a breach would flip the narrative fast. 💡 Are you ready to ride this wave or waiting for the next pull? 👇
⚠️ Not financial advice. Always manage your risk. 🛡️
🏷️ #INIT #LongSetup #Bullish #Crypto
🚀 💎
4

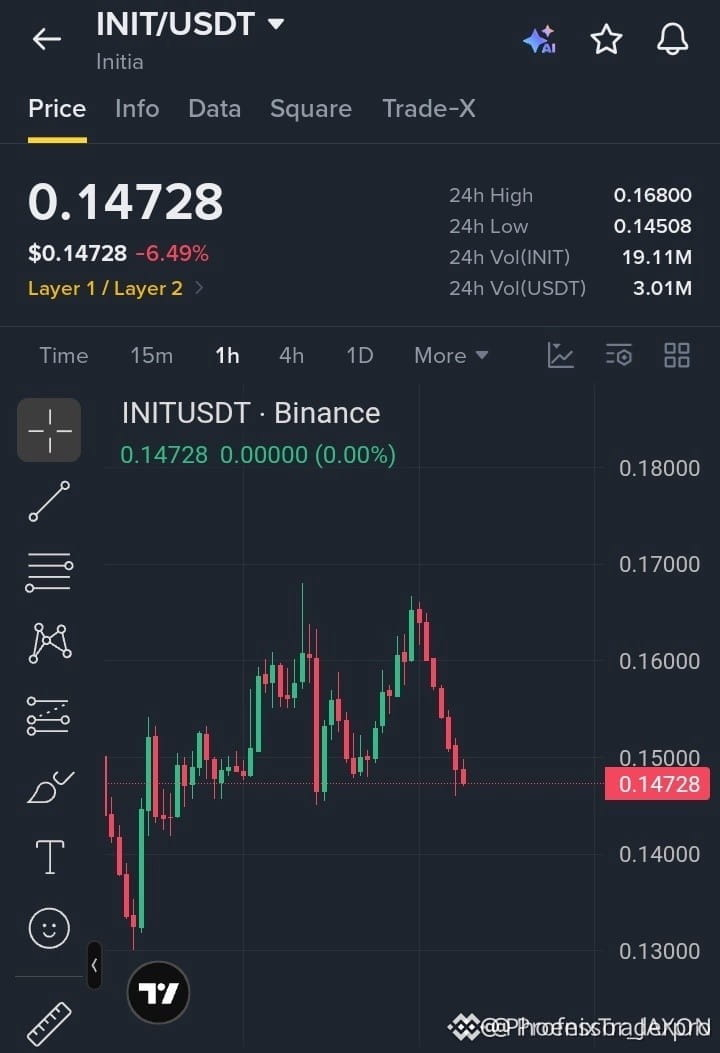
🔴 $INIT SLIDES INTO BEARISH SWEEP – LIQUIDITY UNDER ATTACK! 🚨
Entry: 0.14800 ⚡
Target: 0.14500, 0.14200, 0.13800 🚀
Stop Loss: 0.15200 ⚠️
📊 The market is dumping hard after a crisp rejection at 0.16600, and red candles keep stacking the pressure. 🦈 Smart money is sweeping the 0.14900 zone, leaving a thin order block that buyers can’t defend. ⚡ A break under 0.14500 could trigger a rapid cascade toward the next support cluster, while any bounce above 0.14900 would flip the script. 📌 Keep an eye on volume spikes as the next liquidity grab unfolds.
💬 How are you positioning for the next wave of downside? 👇
⚠️ Not financial advice. Always manage your risk. 🛡️
🏷️ #INIT #ShortSetup #Bearish #Crypto
🦈 🔥
9

·
--
🚨 $INIT at $0.163… Are we seeing a genuine breakout or a liquidity trap?
The price has broken through an important support zone, and volume has started picking up after a long period of dormancy.
✅ Entry: After holding above $0.165, targeting $0.185 and then $0.20.
⚠️ Stop-loss: A close below $0.155; a break could open the way to $0.14.
Check here $INIT
{future}(INITUSDT)
⚠️ Warning: Liquidity and volatility are high, and there are no “guaranteed” targets—risk management comes first.
Also follow $APR
{future}(APRUSDT)
#INIT #crypto #altcoins
Summary: INIT is in a testing phase; holding above $0.170 is the entry condition, while a break below $0.155 means waiting, not chasing.
🚨 $INIT at $0.163… Are we seeing a genuine breakout or a liquidity trap?
The price has broken through an important support zone, and volume has started picking up after a long period of dormancy.
✅ Entry: After holding above $0.165, targeting $0.185 and then $0.20.
⚠️ Stop-loss: A close below $0.155; a break could open the way to $0.14.
Check here $INIT
⚠️ Warning: Liquidity and volatility are high, and there are no “guaranteed” targets—risk management comes first.
Also follow $APR
#INIT #crypto #altcoins
Summary: INIT is in a testing phase; holding above $0.170 is the entry condition, while a break below $0.155 means waiting, not chasing.

ABO3ZAM:
تحليل جميل؛ نراقب الإغلاق القادم للتأكيد ودايم عيني على السيولة 👏
2
1
54


·
--
The more interesting chart here is INIT, because price is compressing directly beneath a local high instead of giving back the previous impulse.
$INIT is sitting around 0.1639 after printing 0.16672, and the 1H trend is still technically healthy: MA7 is rising at 0.16098, MA25 at 0.15622, and both remain comfortably above MA99.
What catches my attention is the change in candle behavior. The expansion candle did the heavy lifting, but the candles near the top are getting smaller while volume has dropped sharply. That can mean either absorption before another push or simple momentum exhaustion.
For bulls, 0.1617–0.1609 is the first important defense. As long as that area holds, the market is still building above the breakout rather than reversing it.
The real ceiling is 0.1667–0.1680. Acceptance above that zone would confirm that buyers are still willing to transact at higher prices. Repeated failure there, especially with fading volume, increases the probability of a deeper rotation toward 0.1562.
$T is a very different structure.
At 0.00550, price is still below MA7 0.00557 and MA25 0.00594, so the short-term trend has not actually turned bullish despite the bounce from 0.00538.
The most important thing on this chart is the compression between the declining short-term averages and MA99 support near 0.00505.
A reclaim of 0.00557 would be the first sign that sellers are losing control, but 0.00582–0.00594 is the real resistance band that has to be recovered before I’d call this a meaningful trend shift.
If 0.00538 breaks, there isn’t much technical support until the 0.00505–0.00498 region.
So right now:
INIT = high level consolidation beneath resistance.
T = weak structure trying to build a floor above long-term support.
{spot}(INITUSDT)
{spot}(TUSDT)
#INIT #T
Which technical event do you think happens first?
The more interesting chart here is INIT, because price is compressing directly beneath a local high instead of giving back the previous impulse.
$INIT is sitting around 0.1639 after printing 0.16672, and the 1H trend is still technically healthy: MA7 is rising at 0.16098, MA25 at 0.15622, and both remain comfortably above MA99.
What catches my attention is the change in candle behavior. The expansion candle did the heavy lifting, but the candles near the top are getting smaller while volume has dropped sharply. That can mean either absorption before another push or simple momentum exhaustion.
For bulls, 0.1617–0.1609 is the first important defense. As long as that area holds, the market is still building above the breakout rather than reversing it.
The real ceiling is 0.1667–0.1680. Acceptance above that zone would confirm that buyers are still willing to transact at higher prices. Repeated failure there, especially with fading volume, increases the probability of a deeper rotation toward 0.1562.
$T is a very different structure.
At 0.00550, price is still below MA7 0.00557 and MA25 0.00594, so the short-term trend has not actually turned bullish despite the bounce from 0.00538.
The most important thing on this chart is the compression between the declining short-term averages and MA99 support near 0.00505.
A reclaim of 0.00557 would be the first sign that sellers are losing control, but 0.00582–0.00594 is the real resistance band that has to be recovered before I’d call this a meaningful trend shift.
If 0.00538 breaks, there isn’t much technical support until the 0.00505–0.00498 region.
So right now:
INIT = high level consolidation beneath resistance.
T = weak structure trying to build a floor above long-term support.
#INIT #T
Which technical event do you think happens first?
$INIT clears 0.1680
22%
$INIT retests 0.1610
22%
$T reclaims 0.00594
22%
$T revisits 0.00505
34%
9 votes • Voting closed
3
1.4k

·
--
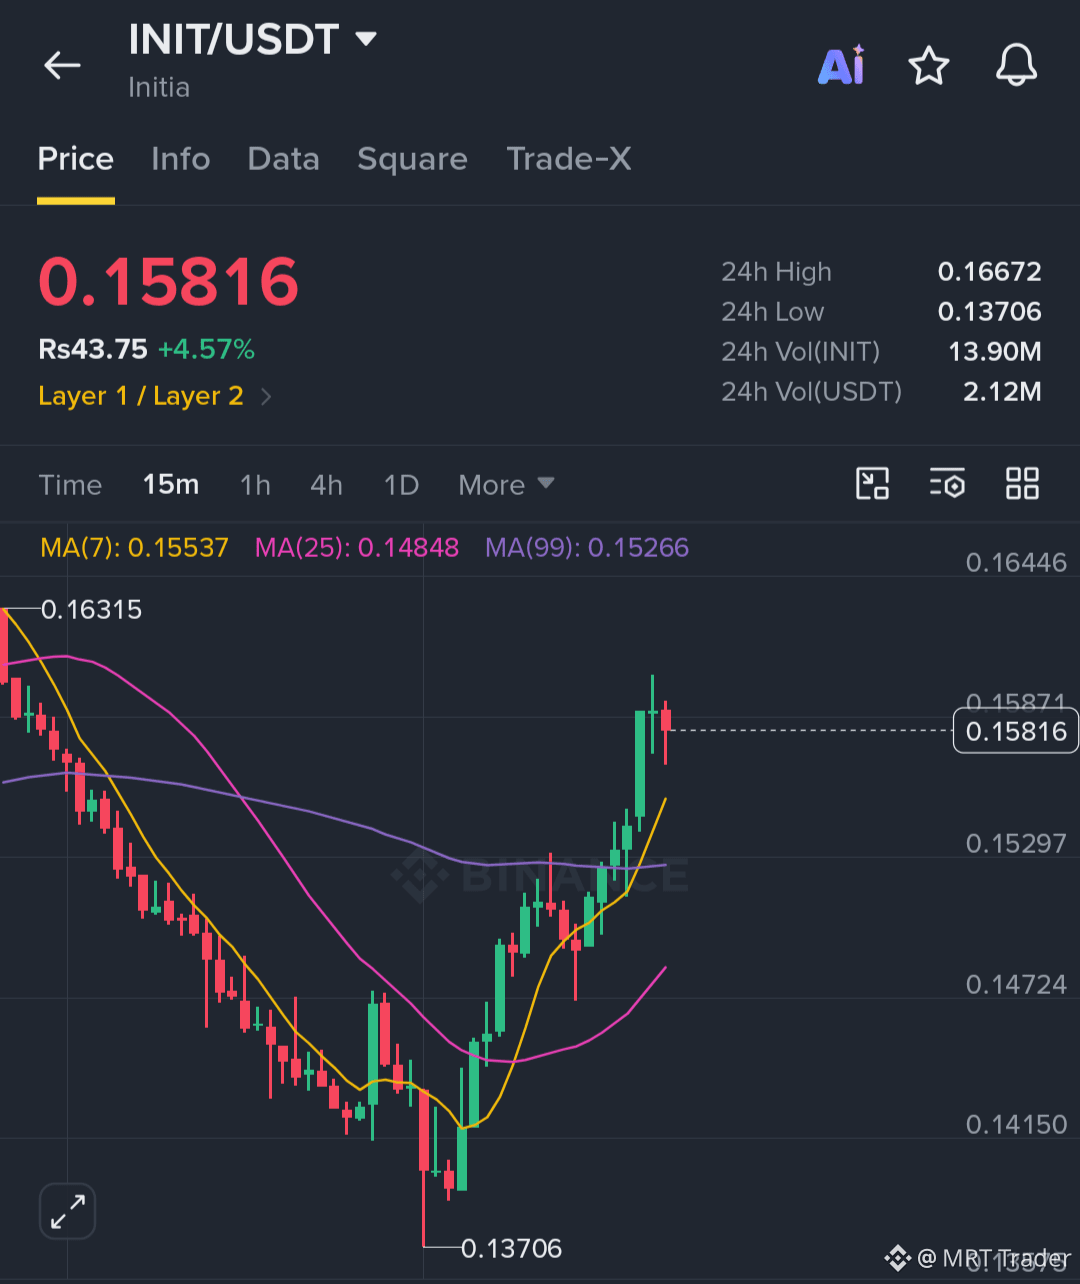
$INIT is staging a strong comeback, and the sharp recovery points to renewed strength. I'm looking at a long for another potential rally.
Key Level:
🟢 Bullish above: 0.1600
Trade Setup (Long):
🟢 Entry Zone: 0.1565 – 0.1590
🎯 Targets: 0.1622 / 0.1652 / 0.1682
⛔ Stop Loss: 0.1530
Wait for a small pullback into the zone instead of chasing. Keep your risk small.
Click here to buy now 👉 $INIT
{future}(INITUSDT)
#INIT #USQ3GDPAndSeptemberPCEDueNextWeek
$INIT is staging a strong comeback, and the sharp recovery points to renewed strength. I'm looking at a long for another potential rally.
Key Level:
🟢 Bullish above: 0.1600
Trade Setup (Long):
🟢 Entry Zone: 0.1565 – 0.1590
🎯 Targets: 0.1622 / 0.1652 / 0.1682
⛔ Stop Loss: 0.1530
Wait for a small pullback into the zone instead of chasing. Keep your risk small.
Click here to buy now 👉 $INIT
#INIT #USQ3GDPAndSeptemberPCEDueNextWeek
Key Level:
🟢 Bullish above: 0.1600
Trade Setup (Long):
🟢 Entry Zone: 0.1565 – 0.1590
🎯 Targets: 0.1622 / 0.1652 / 0.1682
⛔ Stop Loss: 0.1530
Wait for a small pullback into the zone instead of chasing. Keep your risk small.
Click here to buy now 👉 $INIT
#INIT #USQ3GDPAndSeptemberPCEDueNextWeek
18

·
--
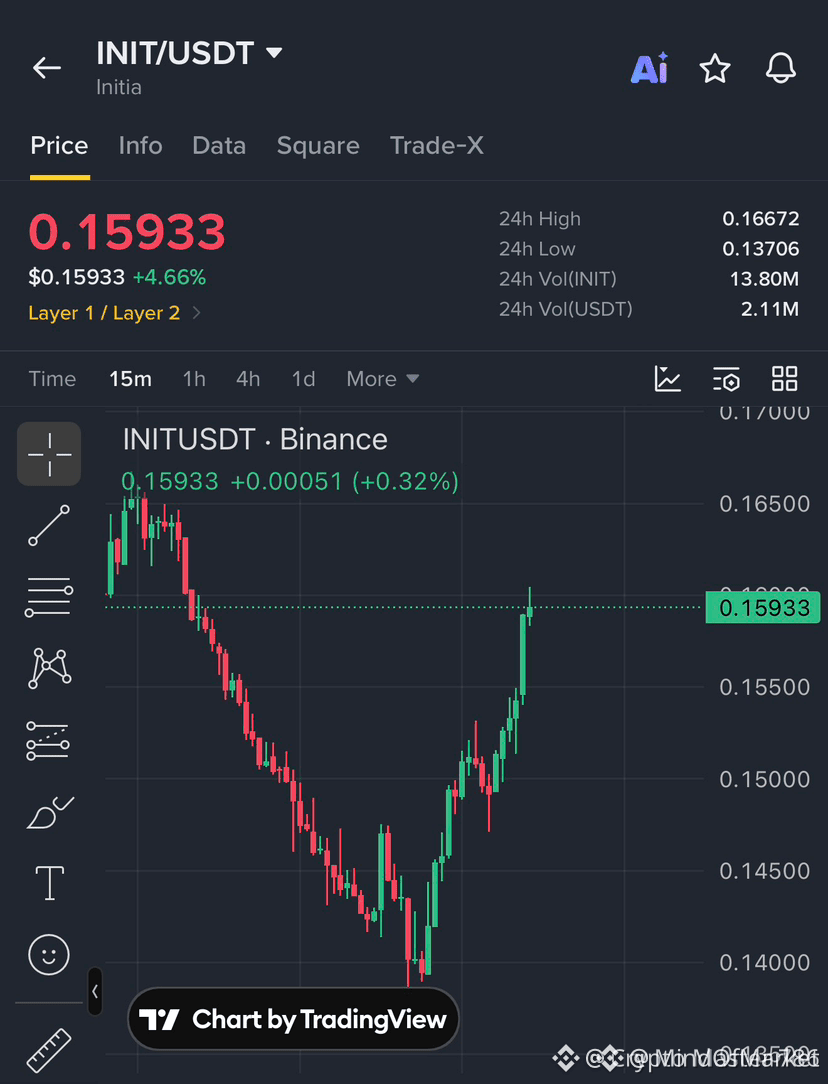
🚀 $INIT STAGE‑2 COMEBACK EYES ON NEXT RALLY 💥
Entry: 0.1570‑0.1595 ⚡
Target: 0.1620/0.1650/0.1680 🚀
Stop Loss: 0.1535 ⚠️
The recent bounce off the 0.1570‑0.1595 demand zone signals smart‑money re‑accumulation, with the order block soaking up sell pressure on the 4H chart. 📊 Volume spikes and a bullish RSI divergence hint the next leg could stretch toward the 0.1620‑0.1680 corridor, feeding the liquidity pool above the prior swing high. 🦈⚡
💬 Are you ready to ride this liquidity‑driven surge? 👇
⚠️ Not financial advice. Always manage your risk. 🛡️
🏷️ #INIT #LongSetup #Liquidity #Crypto
🔥 💎
3

·
--
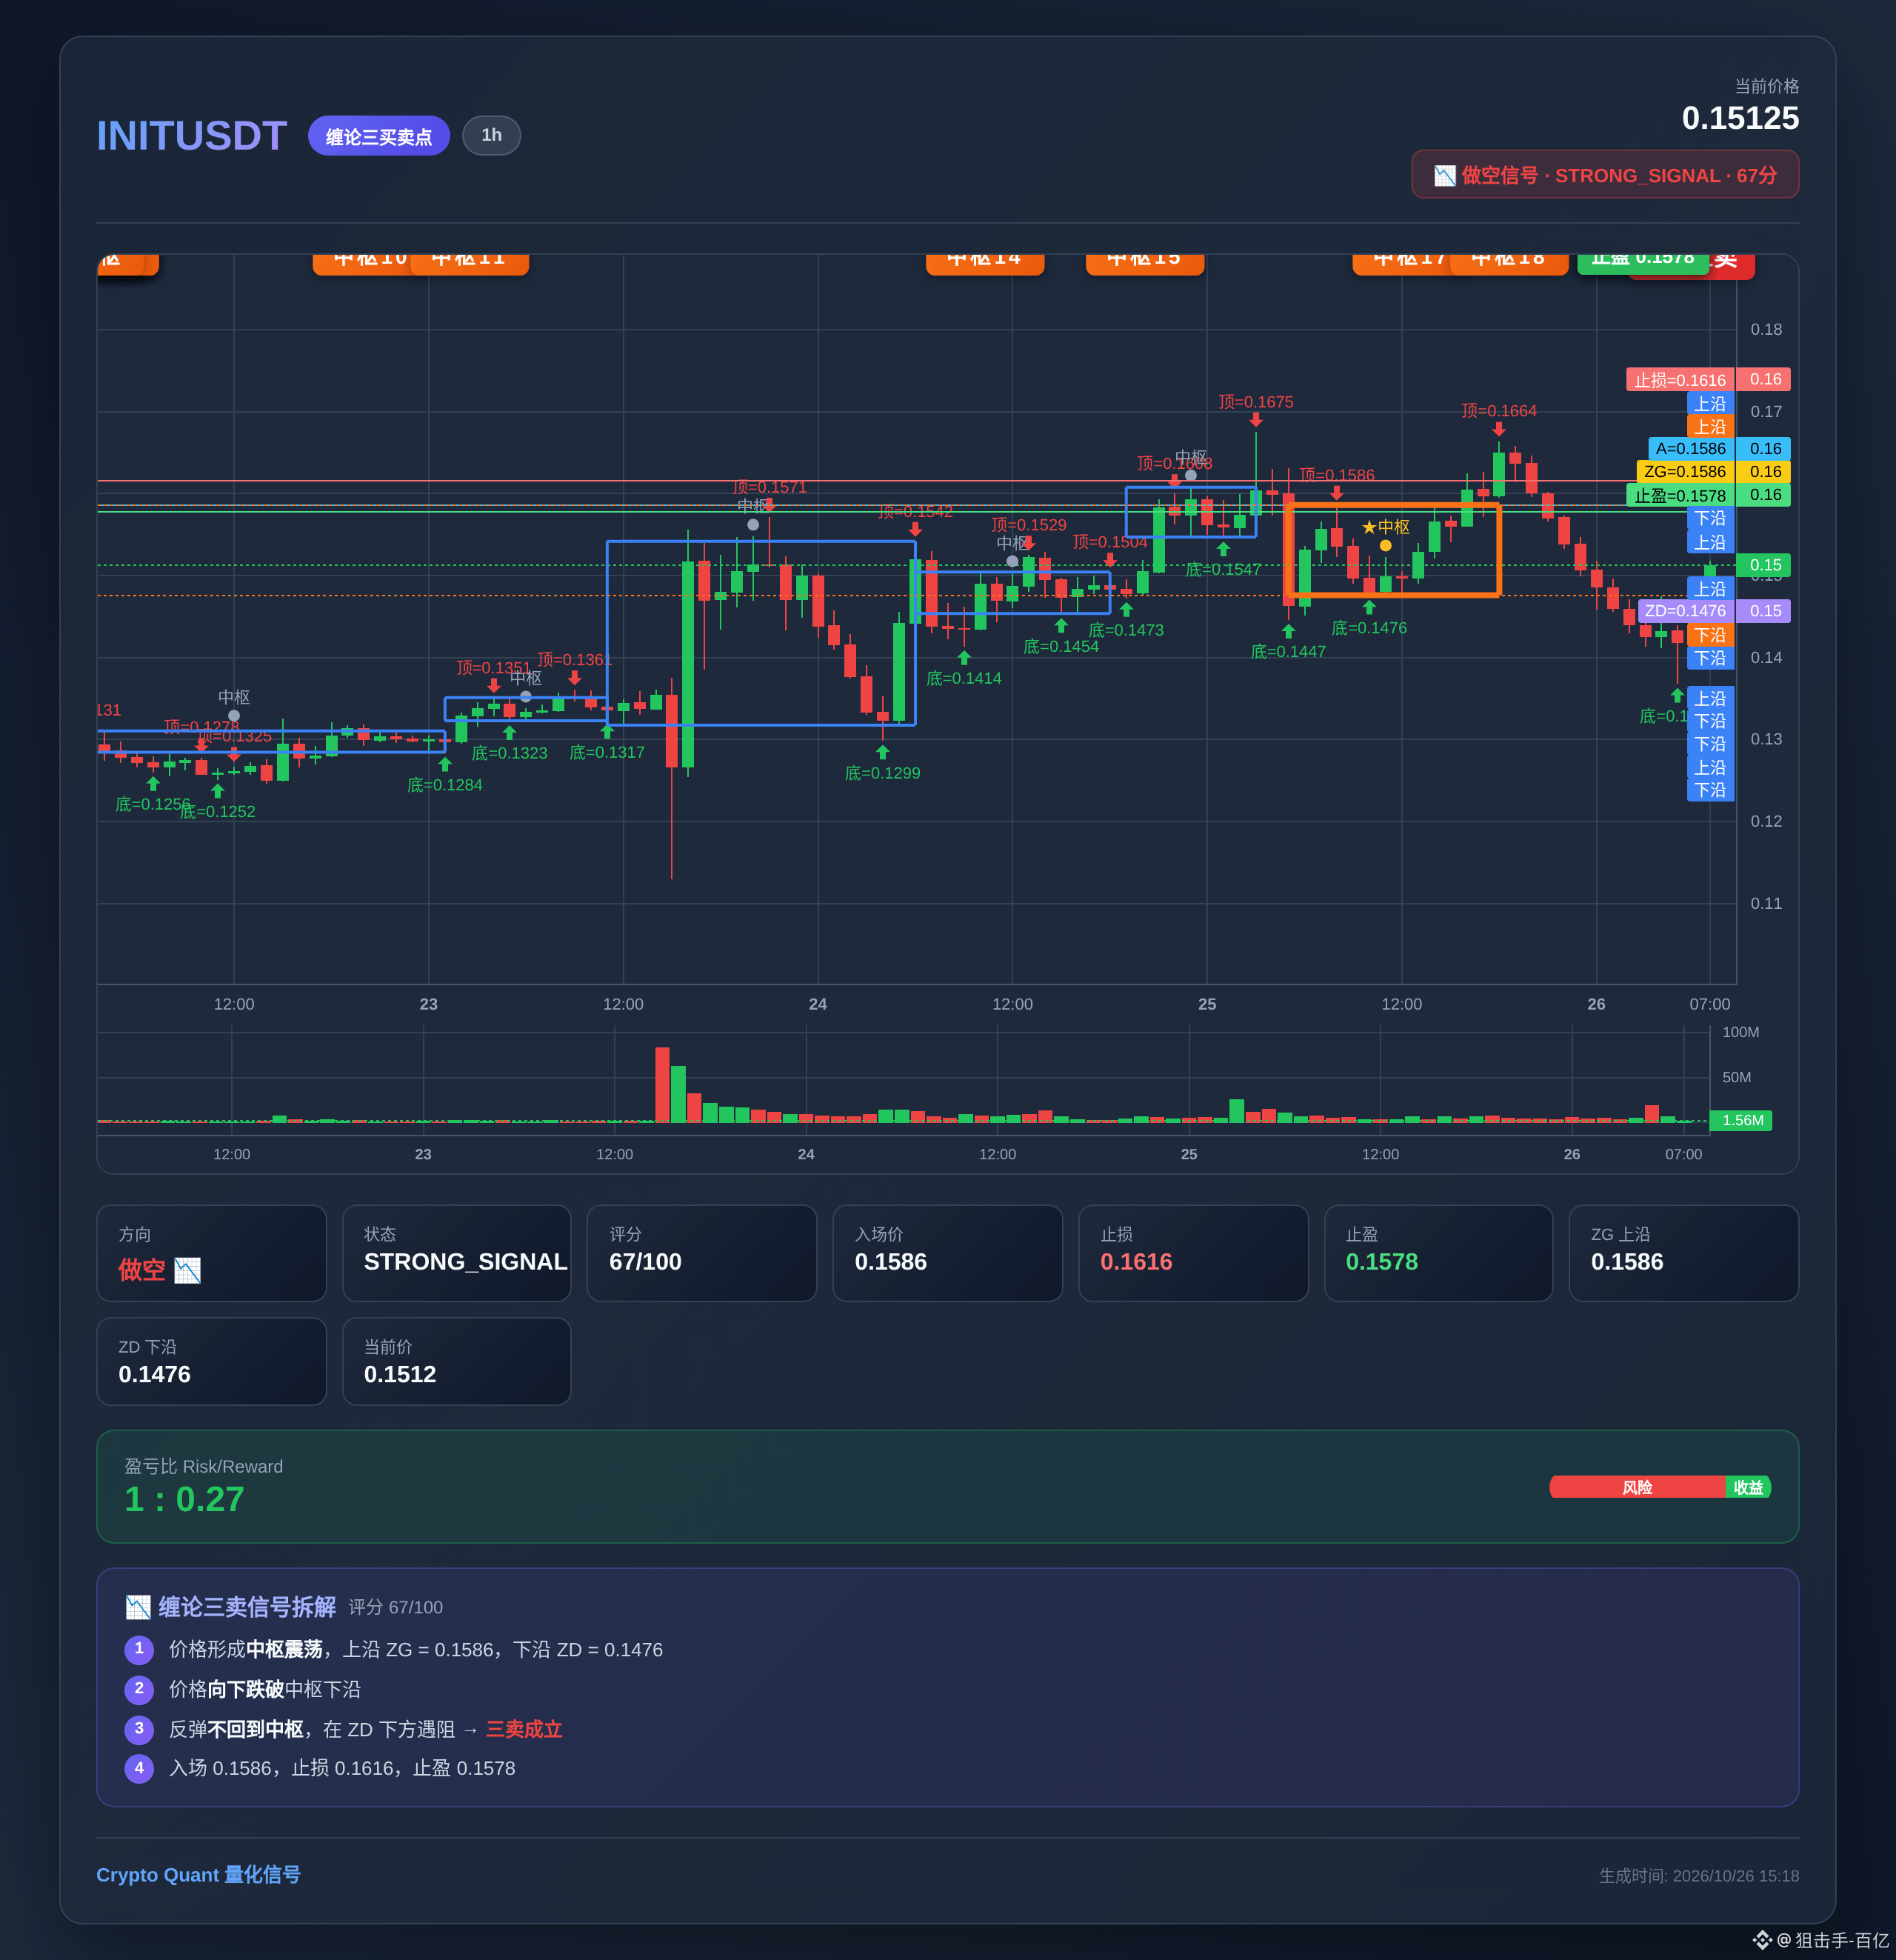
Would you dare enter at this level?
Guys, I’m getting into this short position on $INIT first.
Here’s the reasoning: CHAN strategy, 1-hour timeframe
Score: 89 points—not bad
Entry: 0.150420
Stop-loss: 0.154951
Take-profit: 0.144259
Risk/reward ratio: 1.36:1. As long as I don’t lose, I’m good 😂
Trade at your own risk—I’m going in first.
May everyone who likes this double their money 👍
#韭菜 #INIT #币安 #缠论交易 #shorttermtrading
8

·
--
Bullish
INIT #INIT
Unusual movement alert: Buy alert | INIT
Not activated on the 15m timeframe, but there is a strong unusual bullish move on the 1h timeframe
Structure: Bullish GMMA
Reason: Trading value on the 4h timeframe is 3.2x / strong 1h candle closed near its high / price above VWAP on the 1h timeframe / price above EMA8/20 on the 1h timeframe / bullish GMMA / 24h trading value is 27.0M
Current price 0.16496
Breakout level 0.16754
Protection level 0.14516
Upper levels to watch 0.18146 / 0.19795
Funding rate +0.0050% (long position holders pay; short position holders receive)
The signal direction is clear; after activation, execution can follow the trend, and the invalidation level is the stop-loss level. $INIT
{spot}(INITUSDT)
INIT #INIT
Unusual movement alert: Buy alert | INIT
Not activated on the 15m timeframe, but there is a strong unusual bullish move on the 1h timeframe
Structure: Bullish GMMA
Reason: Trading value on the 4h timeframe is 3.2x / strong 1h candle closed near its high / price above VWAP on the 1h timeframe / price above EMA8/20 on the 1h timeframe / bullish GMMA / 24h trading value is 27.0M
Current price 0.16496
Breakout level 0.16754
Protection level 0.14516
Upper levels to watch 0.18146 / 0.19795
Funding rate +0.0050% (long position holders pay; short position holders receive)
The signal direction is clear; after activation, execution can follow the trend, and the invalidation level is the stop-loss level. $INIT
1
146

·
--
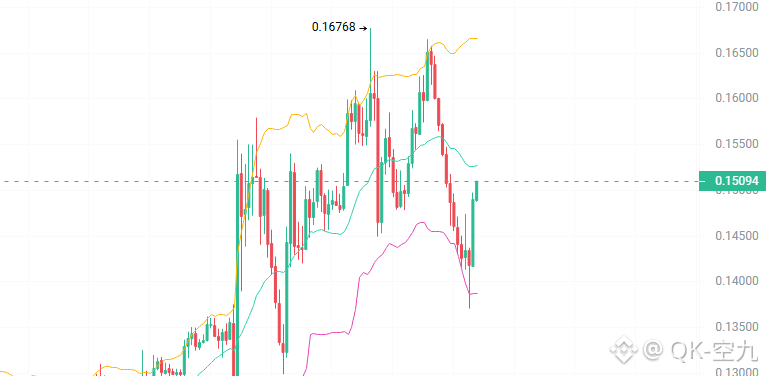
Opened a small short position in INIT, currently around 0.151.
Entered a short at the current price. The hourly trend is downward, and I'm betting on the current resistance holding. First downside target is around 0.14; a break below this level would open up more downside.
The price has pulled back from the previous high around 0.167. It rebounded to near 0.15 but met resistance and failed to break above it decisively. The hourly trend remains downward, so this is a bet on a second pullback from resistance!$INIT #INIT
{future}(INITUSDT)
Opened a small short position in INIT, currently around 0.151.
Entered a short at the current price. The hourly trend is downward, and I'm betting on the current resistance holding. First downside target is around 0.14; a break below this level would open up more downside.
The price has pulled back from the previous high around 0.167. It rebounded to near 0.15 but met resistance and failed to break above it decisively. The hourly trend remains downward, so this is a bet on a second pullback from resistance!$INIT #INIT
341

·
--
The market feels a bit chilly today 🥶—don’t panic; check your stop-loss orders first!
Several exchanges have listed Initia as an asset under a trading warning.
Bad news is out, but don’t jump to conclusions—take a moment to understand what’s going on.
$INIT 0.1453, don’t panic; keep your position size in check!
#INIT
Several exchanges have listed Initia as an asset under a trading warning.
Bad news is out, but don’t jump to conclusions—take a moment to understand what’s going on.
$INIT 0.1453, don’t panic; keep your position size in check!
#INIT
1

·
--
Upbit and Bithumb designated $INIT as an asset under trading caution on October 26, and deposits and withdrawals have been suspended on both exchanges. Upbit’s review period is scheduled for the week of November 23–27. The reason is a security incident, such as a hack, involving a wallet or distributed ledger, whose cause has yet to be determined and which may have caused user losses.
On South Korean exchanges, a trading caution designation is usually the first step in the delisting process.
#INIT #Upbit #Trading Caution
On South Korean exchanges, a trading caution designation is usually the first step in the delisting process.
#INIT #Upbit #Trading Caution
87

·
--
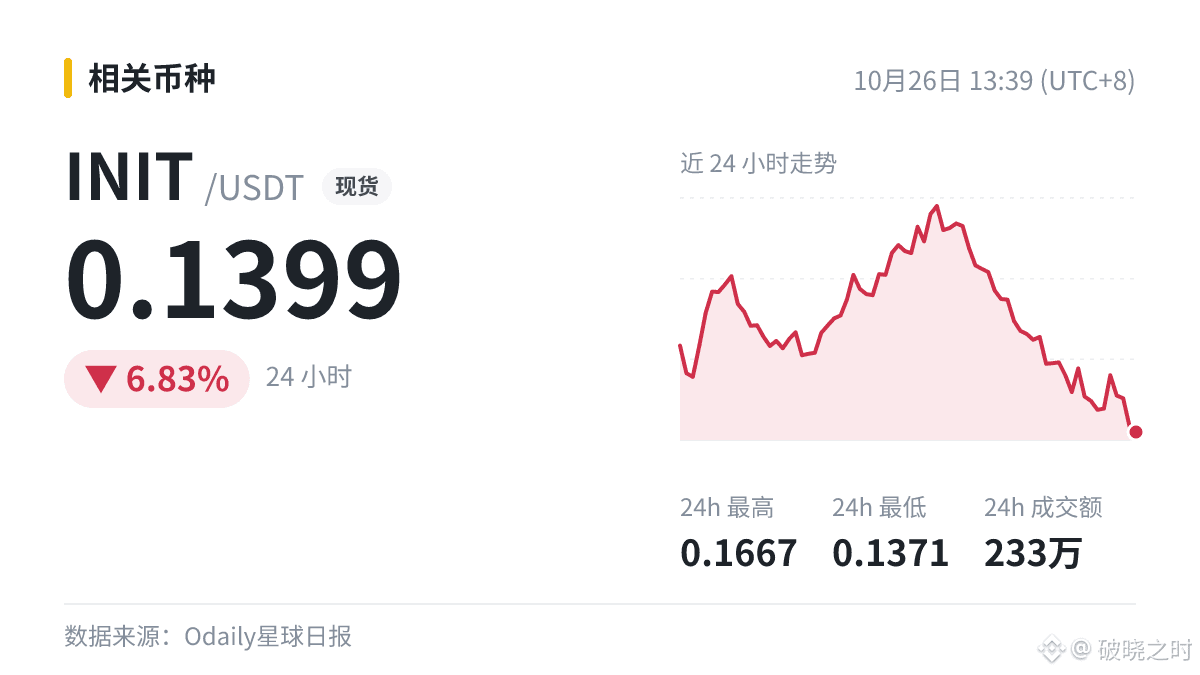
【Intraday Update】INIT is down nearly 13% in 24 hours, currently at 0.13978 USDT
· It won’t have much impact on the day, but it’s a useful reference for those following this area.
· Keep an eye on stablecoin inflows and outflows, and see whether off-exchange funds are entering because of this.
· $INIT currently 0.1399
#INIT
For record-keeping only, not trading advice.
· It won’t have much impact on the day, but it’s a useful reference for those following this area.
· Keep an eye on stablecoin inflows and outflows, and see whether off-exchange funds are entering because of this.
· $INIT currently 0.1399
#INIT
For record-keeping only, not trading advice.
1

·
--
📌 Multiple exchanges have flagged Initia (INIT) as a high-risk trading asset
$INIT 24h is already down 8.58%; some of the news may already be reflected in the price.
Don’t draw conclusions from a single number—compare at least a few indicators.
#INIT
📌 Multiple exchanges have flagged Initia (INIT) as a high-risk trading asset
$INIT 24h is already down 8.58%; some of the news may already be reflected in the price.
Don’t draw conclusions from a single number—compare at least a few indicators.
#INIT
$INIT 24h is already down 8.58%; some of the news may already be reflected in the price.
Don’t draw conclusions from a single number—compare at least a few indicators.
#INIT
2

·
--
A post I came across at 13:23: An exchange lists INIT as an asset under a trading alert
$INIT (24h -9.65%).
#INIT
A post I came across at 13:23: An exchange lists INIT as an asset under a trading alert
$INIT (24h -9.65%).
#INIT
$INIT (24h -9.65%).
#INIT

·
--
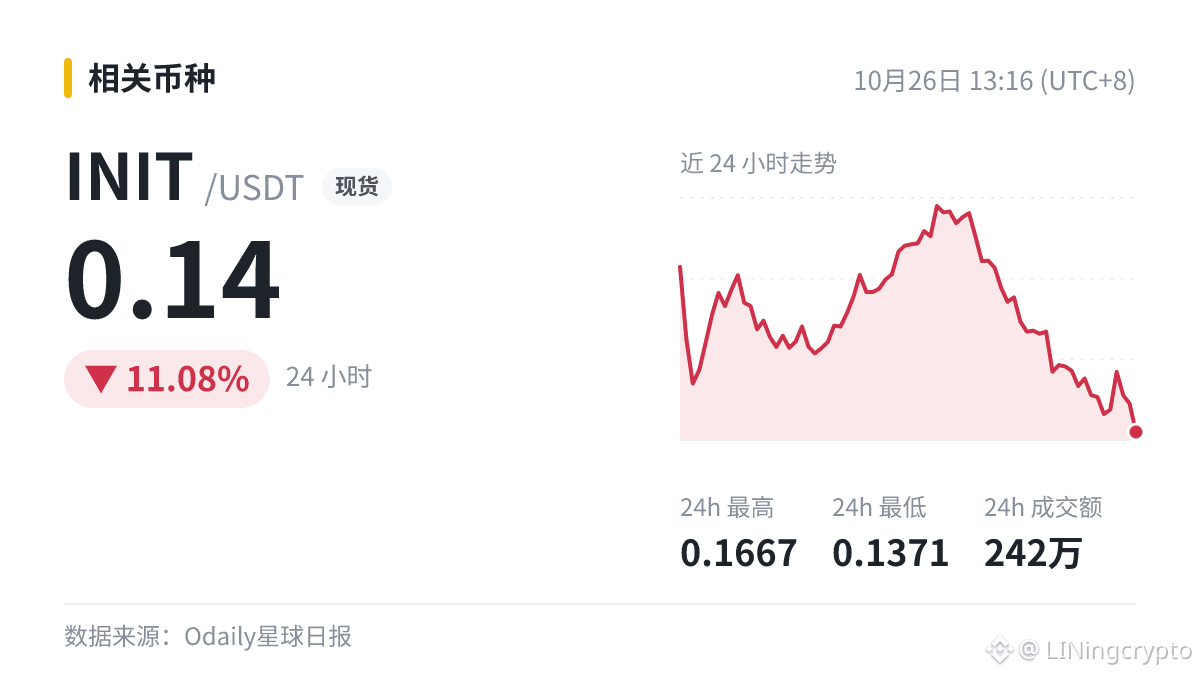
[Flash] An exchange has added Initia (INIT) to its list of tokens under trading warnings
· News like this is mostly for reference and usually has little impact on intraday price action.
· What really matters is whether money is flowing in or out.
· $INIT
#INIT
[Flash] An exchange has added Initia (INIT) to its list of tokens under trading warnings
· News like this is mostly for reference and usually has little impact on intraday price action.
· What really matters is whether money is flowing in or out.
· $INIT
#INIT
· News like this is mostly for reference and usually has little impact on intraday price action.
· What really matters is whether money is flowing in or out.
· $INIT
#INIT
7

·
--
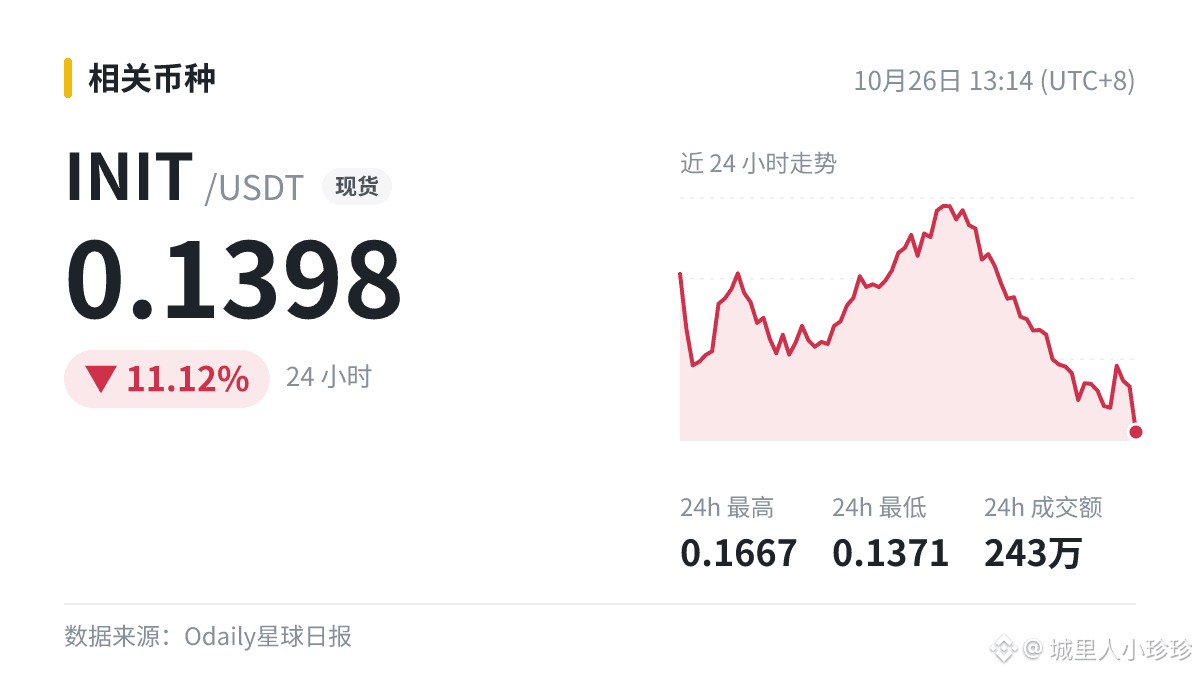
【Breaking】An exchange has added Initia (INIT) to its list of tokens under trading warning
· Not much impact in the short term, but it’s a useful reference for those following this project.
· Keep an eye on whether community interest can be sustained.
· $INIT currently at 0.1398 (24h -11.12%)
#INIT
【Breaking】An exchange has added Initia (INIT) to its list of tokens under trading warning
· Not much impact in the short term, but it’s a useful reference for those following this project.
· Keep an eye on whether community interest can be sustained.
· $INIT currently at 0.1398 (24h -11.12%)
#INIT
· Not much impact in the short term, but it’s a useful reference for those following this project.
· Keep an eye on whether community interest can be sustained.
· $INIT currently at 0.1398 (24h -11.12%)
#INIT

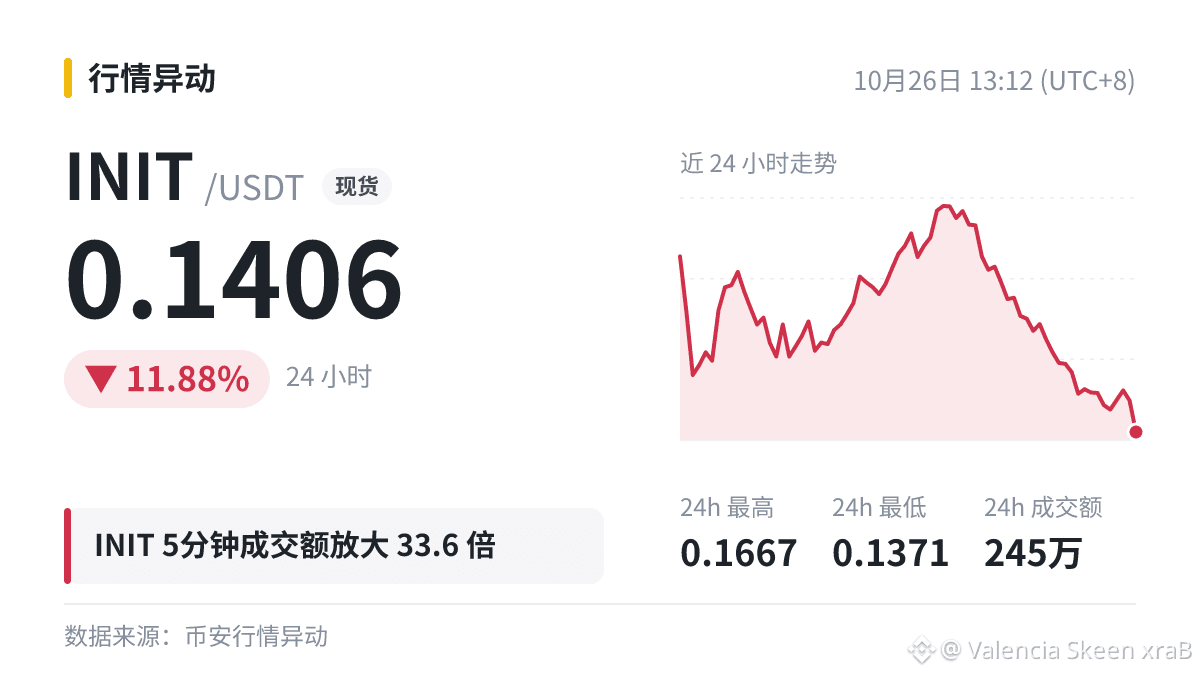
Volume surged 33.6 times over $INIT 5 minutes, down 2.46%, with the current price at 0.1406.
A volume spike is often when the most buying and selling turnover occurs, and afterward the price often picks a direction.
After an unusual move, the market often enters a consolidation phase. The shape of that consolidation determines which way the next move goes.
#INIT
A volume spike is often when the most buying and selling turnover occurs, and afterward the price often picks a direction.
After an unusual move, the market often enters a consolidation phase. The shape of that consolidation determines which way the next move goes.
#INIT
29

·
--
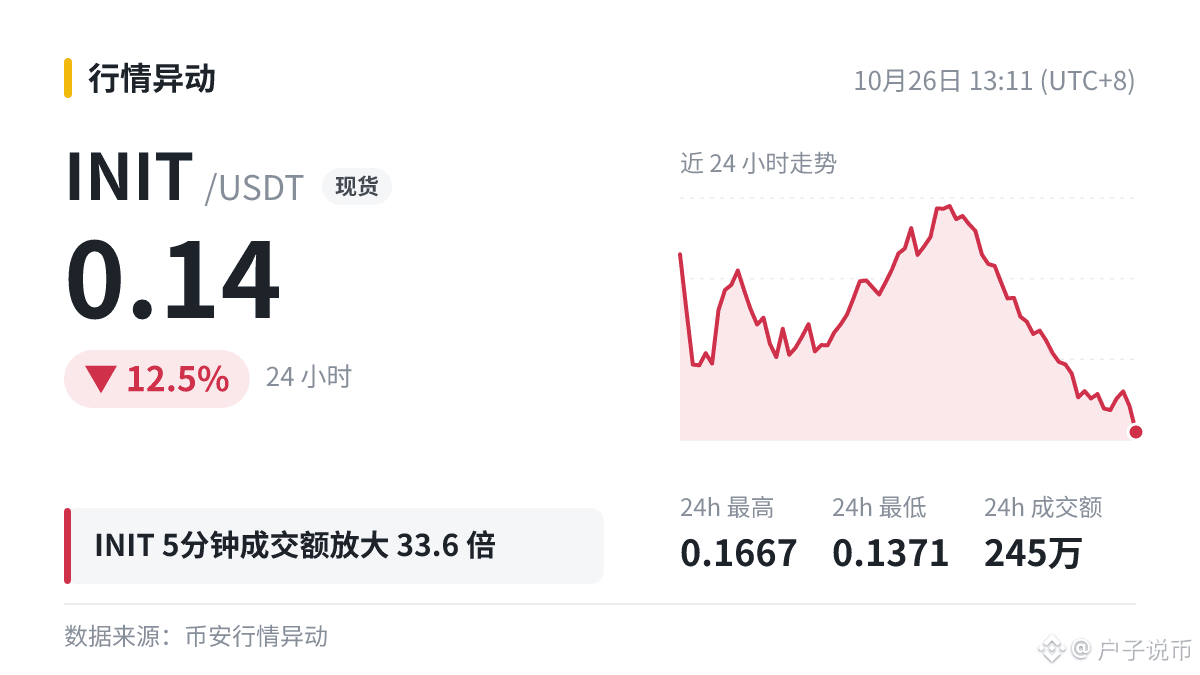
Volume is a leading indicator of price. $INIT 5-minute volume ratio: 33.6; trading volume: $1.69 million; price: -2.46%.
A high-volume selloff is underway. Don’t rush to buy the dip in the short term; wait for volume to ease and the price to stabilize.
Don’t assume it’s cheap just because it’s fallen a lot—it can always get cheaper.
#INIT
A high-volume selloff is underway. Don’t rush to buy the dip in the short term; wait for volume to ease and the price to stabilize.
Don’t assume it’s cheap just because it’s fallen a lot—it can always get cheaper.
#INIT

·
--
Volume and price need to move together for the signal to count. If the price is moving but momentum isn’t keeping up, treat it with caution.
For example, this update: An exchange has added Initia (INIT) to its trading warning list, $INIT (24h -12.4%).
A steady update—just make a note of it; there’s no need to change your trading plans.
#INIT
For example, this update: An exchange has added Initia (INIT) to its trading warning list, $INIT (24h -12.4%).
A steady update—just make a note of it; there’s no need to change your trading plans.
#INIT

·
--
【Intraday update】An exchange has added Initia (INIT) to its trading warning list
· This kind of development won’t reverse the trend right away, but it’s a clue.
· You can compare how the market moved when similar news came out in the past.
· $INIT Current price: 0.1406
Follow here for further updates as they develop.
#INIT
· This kind of development won’t reverse the trend right away, but it’s a clue.
· You can compare how the market moved when similar news came out in the past.
· $INIT Current price: 0.1406
Follow here for further updates as they develop.
#INIT
8
Log in to explore more content
Join global crypto users on Binance Square
⚡️ Get latest and useful information about crypto.
💬 Trusted by the world’s largest crypto exchange.
👍 Discover real insights from verified creators.
Email / Phone number
Trending Topics
1
#BinancePick
2.6M views
141,866 Discussing
2
#EarningsSeason
5M views
24,364 Discussing
3
#FranklinTempletonFilesForTwoDividendToBitcoinETFs
2,034 views
111 Discussing
4
#StrategyMSTRSurpassesNasdaqInMarketCap
2,387 views
102 Discussing
5
#CanadaProposesStablecoinRedemptionWithin3BusinessDays
103 views
13 Discussing
6
#ElectrumWalletBugLetRogueServersStealFunds
8,951 views
240 Discussing
7
#ArgentineCourtDismissesLIBRACaseAgainstMilei
19,084 views
317 Discussing
8
#SKHynixReportedlyPlansSpecialDividendFromKioxiaStakeSale
3,158 views
48 Discussing
9
#KeystoneWebsiteBreachExposesBuyersShippingAddresses
1,688 views
41 Discussing
10
#USQ3GDPAndSeptemberPCEDueNextWeek
96,688 views
1,135 Discussing