
#cryptomonk
cryptomonk
617 views
5 Discussing
Hot
Latest

🔥 MASSIVE $3.2B WEEKLY INFLOW INTO CRYPTO FUNDS: THE BIGGEST SINCE 2025! 🔥
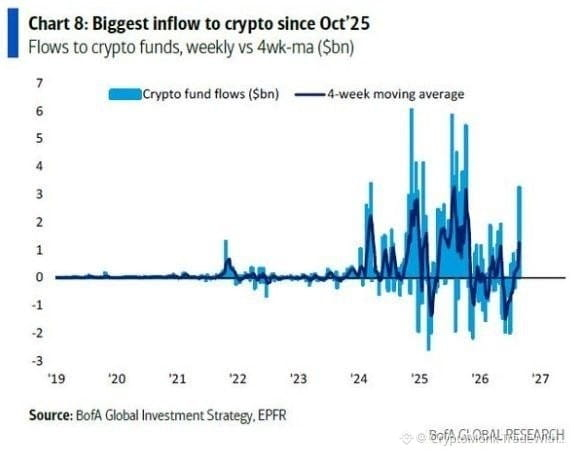
According to the latest data from Bank of America Global Research, crypto funds have seen a monumental surge of capital. Last week alone, a staggering $3.2 billion in net inflows poured into crypto investment vehicles.
This isn't just a minor fluctuation; it's a monumental shift in market sentiment. This represents the single largest weekly inflow since October 2025.
What does this outcome mean?
This data point strongly suggests that institutional FOMO is back in a big way. Large institutional investors are not just watching from the sidelines anymore; they are aggressively committing capital.
Chart Confirmation: The chart from BofA Global Research shows a colossal blue spike at the far right, towering over almost everything since the late 2025 peaks. The dark blue line (4-week moving average) has decisively broken higher, signaling a sustained trend of strong demand.
Data Source: BofA Global Investment Strategy, EPFR.
Look at the Chart: This is a clear indicator of market momentum.
What do you think of this massive flow? Is this a sign of the next massive bull run, or is it a short-lived spike? Share your analysis in the comments!
$BTC $ETH $SOL
#cryptomonk #CFTCSeeksToDismissCMEMotionInPerpFutures
According to the latest data from Bank of America Global Research, crypto funds have seen a monumental surge of capital. Last week alone, a staggering $3.2 billion in net inflows poured into crypto investment vehicles.
This isn't just a minor fluctuation; it's a monumental shift in market sentiment. This represents the single largest weekly inflow since October 2025.
What does this outcome mean?
This data point strongly suggests that institutional FOMO is back in a big way. Large institutional investors are not just watching from the sidelines anymore; they are aggressively committing capital.
Chart Confirmation: The chart from BofA Global Research shows a colossal blue spike at the far right, towering over almost everything since the late 2025 peaks. The dark blue line (4-week moving average) has decisively broken higher, signaling a sustained trend of strong demand.
Data Source: BofA Global Investment Strategy, EPFR.
Look at the Chart: This is a clear indicator of market momentum.
What do you think of this massive flow? Is this a sign of the next massive bull run, or is it a short-lived spike? Share your analysis in the comments!
$BTC $ETH $SOL
#cryptomonk #CFTCSeeksToDismissCMEMotionInPerpFutures
Log in to explore more content