
#crclb
crclb
75,755 views
1,237 Discussing
Hot
Latest

·
--
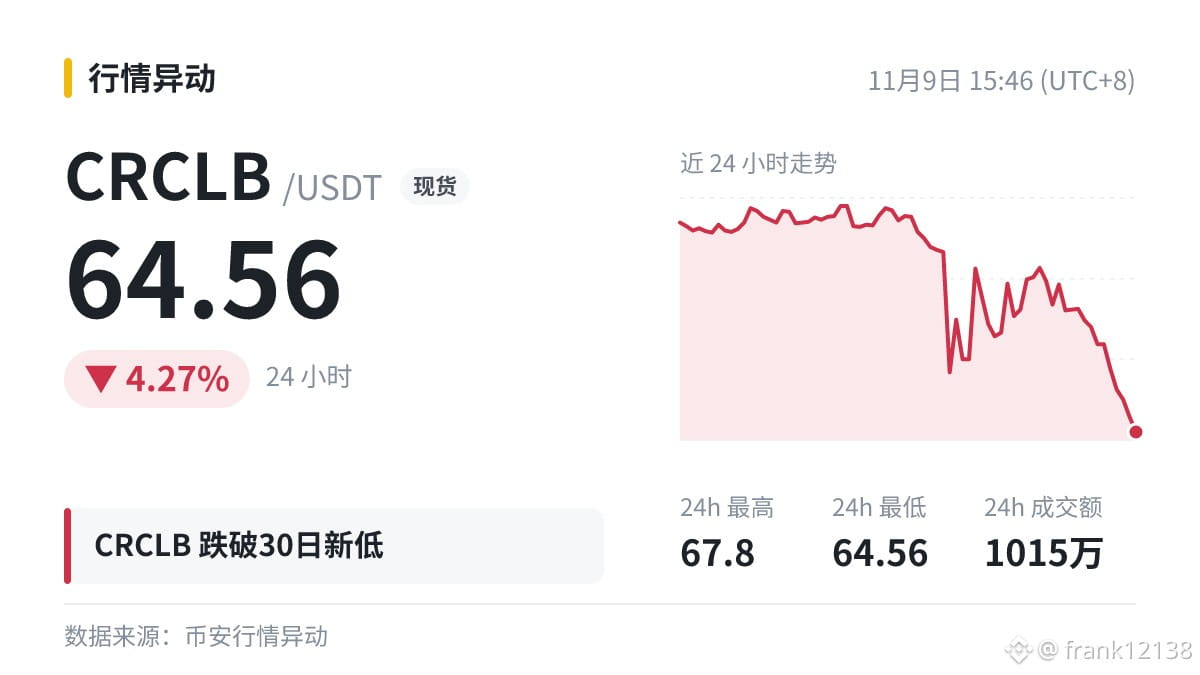
$CRCLB hit a 30-day low of 64.56
Previous low, 65: I did my best.
Me buying the dip: Turns out I still wasn't at the bottom.
They say what goes down must come up, but it seems it hasn't heard that saying.
If you laughed, you've been there too.
#CRCLB
Just chatting—not advice.
$CRCLB hit a 30-day low of 64.56
Previous low, 65: I did my best.
Me buying the dip: Turns out I still wasn't at the bottom.
They say what goes down must come up, but it seems it hasn't heard that saying.
If you laughed, you've been there too.
#CRCLB
Just chatting—not advice.
Previous low, 65: I did my best.
Me buying the dip: Turns out I still wasn't at the bottom.
They say what goes down must come up, but it seems it hasn't heard that saying.
If you laughed, you've been there too.
#CRCLB
Just chatting—not advice.
10

·
--
Hourly volume just spiked 6.26x above the average for $CRCLB at $68.47.
This surge pushed price above the 23-hour high of 67.8, showing strong short-term buyer participation.
If momentum sustains above 67.8, a continuation toward higher liquidity zones becomes a scenario to watch. However, losing the 64.55 low would invalidate this setup and expose the market to deeper retracements.
Will you wait for a confirmed hourly close above 67.8 to validate strength, or will you step aside if price slips back under 64.55?
Tap $CRCLB for the live chart. #CRCLB #BinanceSquare
Hourly volume just spiked 6.26x above the average for $CRCLB at $68.47.
This surge pushed price above the 23-hour high of 67.8, showing strong short-term buyer participation.
If momentum sustains above 67.8, a continuation toward higher liquidity zones becomes a scenario to watch. However, losing the 64.55 low would invalidate this setup and expose the market to deeper retracements.
Will you wait for a confirmed hourly close above 67.8 to validate strength, or will you step aside if price slips back under 64.55?
Tap $CRCLB for the live chart. #CRCLB #BinanceSquare
This surge pushed price above the 23-hour high of 67.8, showing strong short-term buyer participation.
If momentum sustains above 67.8, a continuation toward higher liquidity zones becomes a scenario to watch. However, losing the 64.55 low would invalidate this setup and expose the market to deeper retracements.
Will you wait for a confirmed hourly close above 67.8 to validate strength, or will you step aside if price slips back under 64.55?
Tap $CRCLB for the live chart. #CRCLB #BinanceSquare


$CRCLB: The Perils of Mixed Feed Comparisons
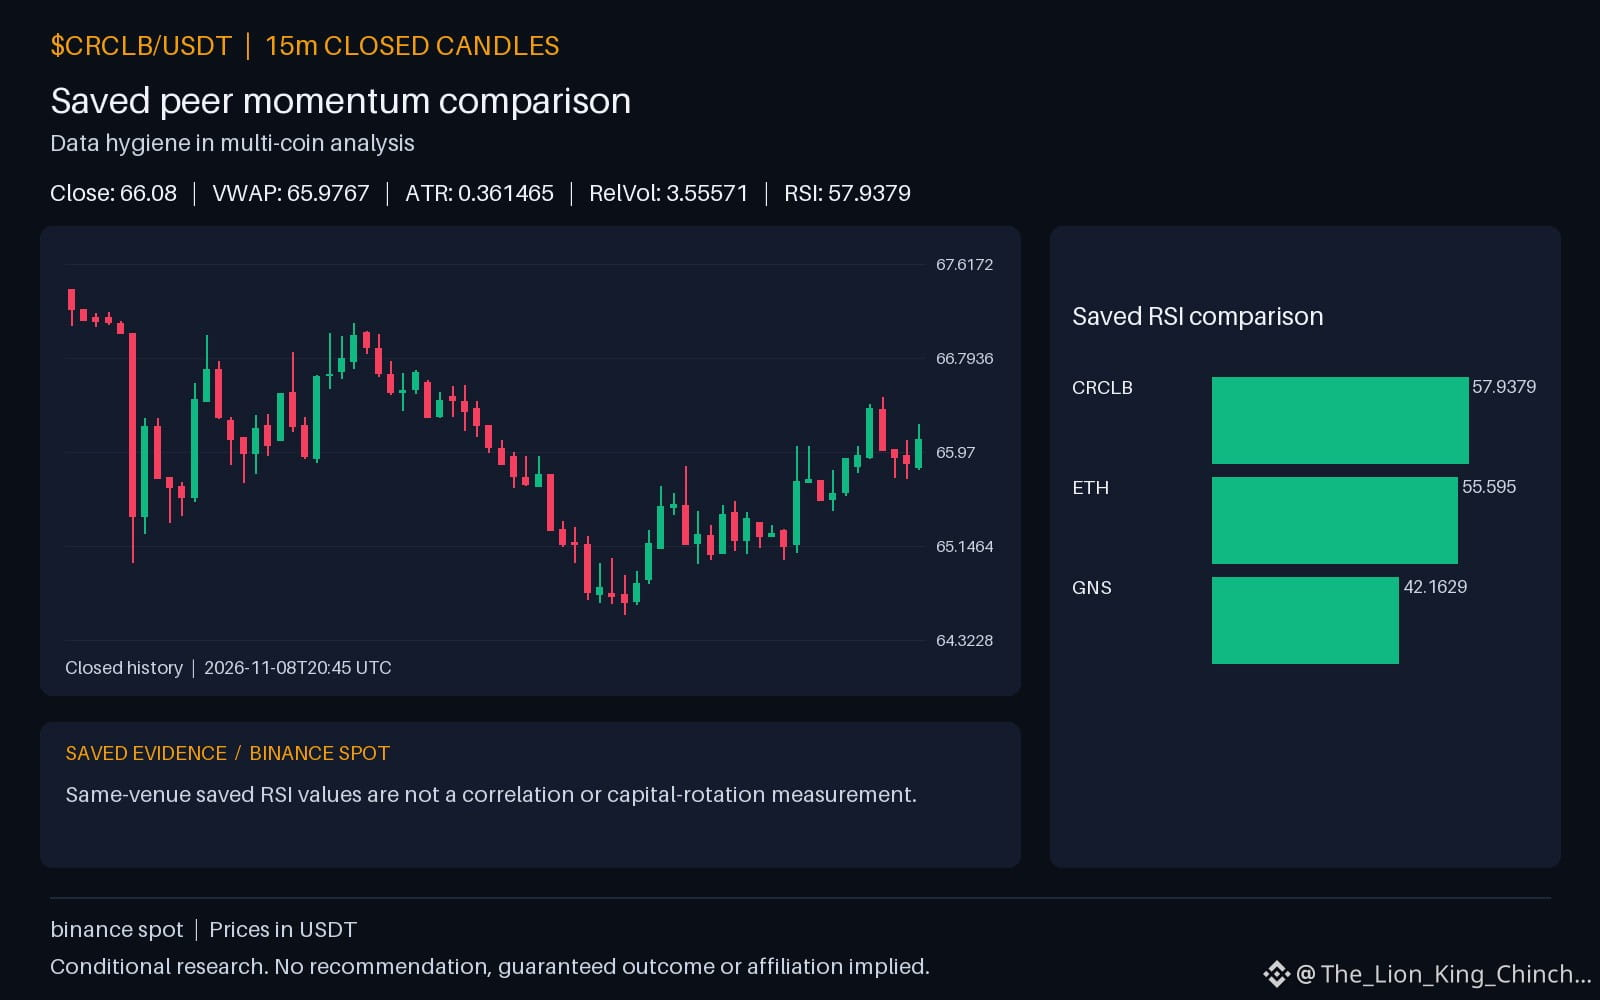
Does mixing data from different exchanges distort research? When evaluating $CRCLB, we observe an hourly direction down while volume remains above its baseline. In contrast, verified peers on the same venue show divergent paths. $ETH has an hourly direction up with volume not above its baseline, whereas $GNS shows an hourly direction down with volume not above its baseline. These variations occur within a single system, yet the data remains specific to this venue.
A hypothetical mechanism suggests that using different quote currencies or exchanges for comparison could introduce artificial gaps. If one feed updates faster or uses a different liquidity provider, a researcher might see a price difference that is just a technical delay rather than a market event. For example, a coin might appear to lead a move simply because its exchange feed is more sensitive.
To reassess interpretations, check if the observed direction persists across identical quote pairs. A shared hourly direction between $CRCLB and a peer is not a measured correlation or a sign of a common cause. Reliability depends on consistent hygiene. Comparing $CRCLB using its RSI of 57.9379 against mixed feeds risks ignoring the unique limits of each source. ⚖️
Probabilistic market research, not a recommendation or guaranteed return.
Watchlist contrast: $ETH has hourly direction up and volume not above its baseline; $GNS has hourly direction down and volume not above its baseline. This alone does not establish correlation.
Why is it important to compare coins using the exact same exchange and quote currency rather than mixing feeds?
#CRCLB #ETH
$CRCLB : The Perils of Mixed Feed Comparisons
Does mixing data from different exchanges distort research? When evaluating $CRCLB , we observe an hourly direction down while volume remains above its baseline. In contrast, verified peers on the same venue show divergent paths. $ETH has an hourly direction up with volume not above its baseline, whereas $GNS shows an hourly direction down with volume not above its baseline. These variations occur within a single system, yet the data remains specific to this venue.
A hypothetical mechanism suggests that using different quote currencies or exchanges for comparison could introduce artificial gaps. If one feed updates faster or uses a different liquidity provider, a researcher might see a price difference that is just a technical delay rather than a market event. For example, a coin might appear to lead a move simply because its exchange feed is more sensitive.
To reassess interpretations, check if the observed direction persists across identical quote pairs. A shared hourly direction between $CRCLB and a peer is not a measured correlation or a sign of a common cause. Reliability depends on consistent hygiene. Comparing $CRCLB using its RSI of 57.9379 against mixed feeds risks ignoring the unique limits of each source. ⚖️
Probabilistic market research, not a recommendation or guaranteed return.
Watchlist contrast: $ETH has hourly direction up and volume not above its baseline; $GNS has hourly direction down and volume not above its baseline. This alone does not establish correlation.
Why is it important to compare coins using the exact same exchange and quote currency rather than mixing feeds?
#CRCLB #ETH
Does mixing data from different exchanges distort research? When evaluating $CRCLB , we observe an hourly direction down while volume remains above its baseline. In contrast, verified peers on the same venue show divergent paths. $ETH has an hourly direction up with volume not above its baseline, whereas $GNS shows an hourly direction down with volume not above its baseline. These variations occur within a single system, yet the data remains specific to this venue.
A hypothetical mechanism suggests that using different quote currencies or exchanges for comparison could introduce artificial gaps. If one feed updates faster or uses a different liquidity provider, a researcher might see a price difference that is just a technical delay rather than a market event. For example, a coin might appear to lead a move simply because its exchange feed is more sensitive.
To reassess interpretations, check if the observed direction persists across identical quote pairs. A shared hourly direction between $CRCLB and a peer is not a measured correlation or a sign of a common cause. Reliability depends on consistent hygiene. Comparing $CRCLB using its RSI of 57.9379 against mixed feeds risks ignoring the unique limits of each source. ⚖️
Probabilistic market research, not a recommendation or guaranteed return.
Watchlist contrast: $ETH has hourly direction up and volume not above its baseline; $GNS has hourly direction down and volume not above its baseline. This alone does not establish correlation.
Why is it important to compare coins using the exact same exchange and quote currency rather than mixing feeds?
#CRCLB #ETH
26
·
--
Volume sits at $12.12M as $CRCLB pulls back 2.42% to trade at $66.04.
The latest hourly close printed 66.35 alongside a 1.29x volume spike over the 23-hour average, hinting at localized absorption inside the 64.55 to 67.80 range.
If buyers reclaim the upper boundary near 67.80 with sustained volume, continuation toward the session highs becomes a plausible watch scenario. Conversely, losing the 64.55 range low invalidates the short-term stabilization setup.
Which scenario do you see developing first based on the volume profile at these levels?
Tap $CRCLB for the live chart. #CRCLB #BinanceSquare
Volume sits at $12.12M as $CRCLB pulls back 2.42% to trade at $66.04.
The latest hourly close printed 66.35 alongside a 1.29x volume spike over the 23-hour average, hinting at localized absorption inside the 64.55 to 67.80 range.
If buyers reclaim the upper boundary near 67.80 with sustained volume, continuation toward the session highs becomes a plausible watch scenario. Conversely, losing the 64.55 range low invalidates the short-term stabilization setup.
Which scenario do you see developing first based on the volume profile at these levels?
Tap $CRCLB for the live chart. #CRCLB #BinanceSquare
The latest hourly close printed 66.35 alongside a 1.29x volume spike over the 23-hour average, hinting at localized absorption inside the 64.55 to 67.80 range.
If buyers reclaim the upper boundary near 67.80 with sustained volume, continuation toward the session highs becomes a plausible watch scenario. Conversely, losing the 64.55 range low invalidates the short-term stabilization setup.
Which scenario do you see developing first based on the volume profile at these levels?
Tap $CRCLB for the live chart. #CRCLB #BinanceSquare
2

·
--
🐳 Where is the money going?
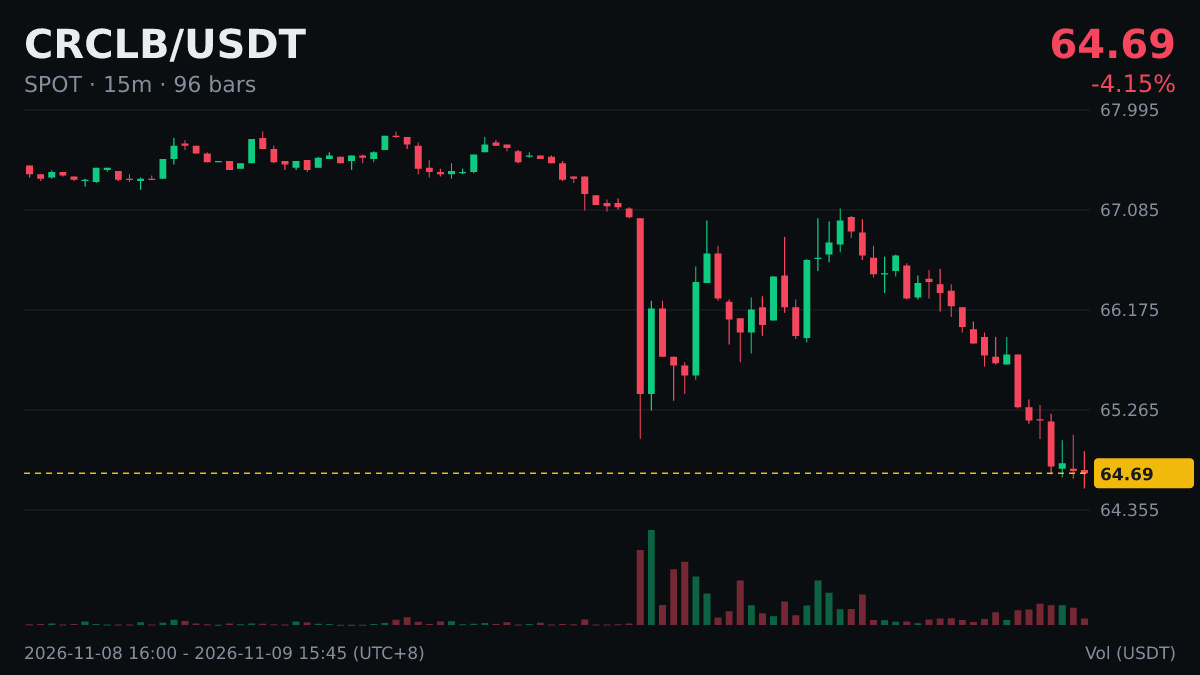
$CRCLB 30 hits a new daily low. Current price: 64.7, previous low: 65, 24h: -4.12%.
No clear signs of buying support near the new low yet, and large orders are still being pulled. Don’t rush to buy the dip.
Vote in the comments: bullish or bearish?
#CRCLB
🐳 Where is the money going?
$CRCLB 30 hits a new daily low. Current price: 64.7, previous low: 65, 24h: -4.12%.
No clear signs of buying support near the new low yet, and large orders are still being pulled. Don’t rush to buy the dip.
Vote in the comments: bullish or bearish?
#CRCLB
$CRCLB 30 hits a new daily low. Current price: 64.7, previous low: 65, 24h: -4.12%.
No clear signs of buying support near the new low yet, and large orders are still being pulled. Don’t rush to buy the dip.
Vote in the comments: bullish or bearish?
#CRCLB
2

·
--
$CRCLB broke below its 30-day low: current price 64.69, previous low 65.
After the breakdown, watch two things:
Whether the previous low of 65 turns from support into resistance (the price bounces but fails to reclaim it)
Whether volume increases on the breakdown; a low-volume break could just be a bear trap
What reasons do you have for being bullish or bearish?
#CRCLB
This may not be right, so don't follow it blindly.
$CRCLB broke below its 30-day low: current price 64.69, previous low 65.
After the breakdown, watch two things:
Whether the previous low of 65 turns from support into resistance (the price bounces but fails to reclaim it)
Whether volume increases on the breakdown; a low-volume break could just be a bear trap
What reasons do you have for being bullish or bearish?
#CRCLB
This may not be right, so don't follow it blindly.
After the breakdown, watch two things:
Whether the previous low of 65 turns from support into resistance (the price bounces but fails to reclaim it)
Whether volume increases on the breakdown; a low-volume break could just be a bear trap
What reasons do you have for being bullish or bearish?
#CRCLB
This may not be right, so don't follow it blindly.
2

·
--
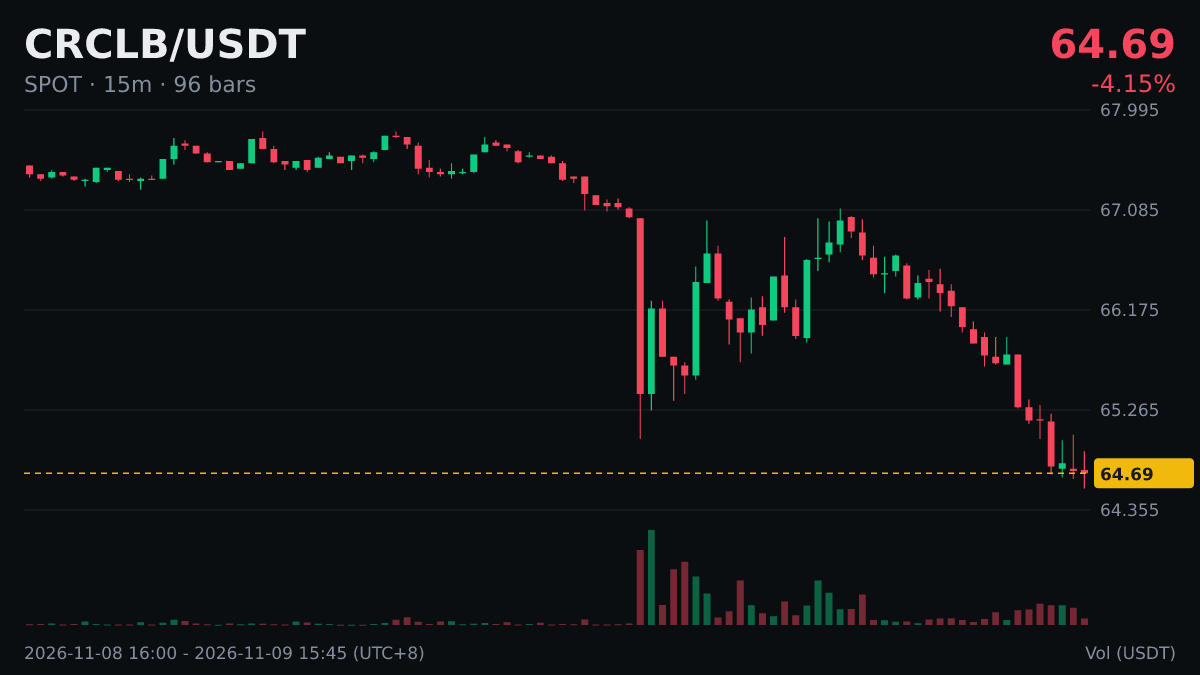
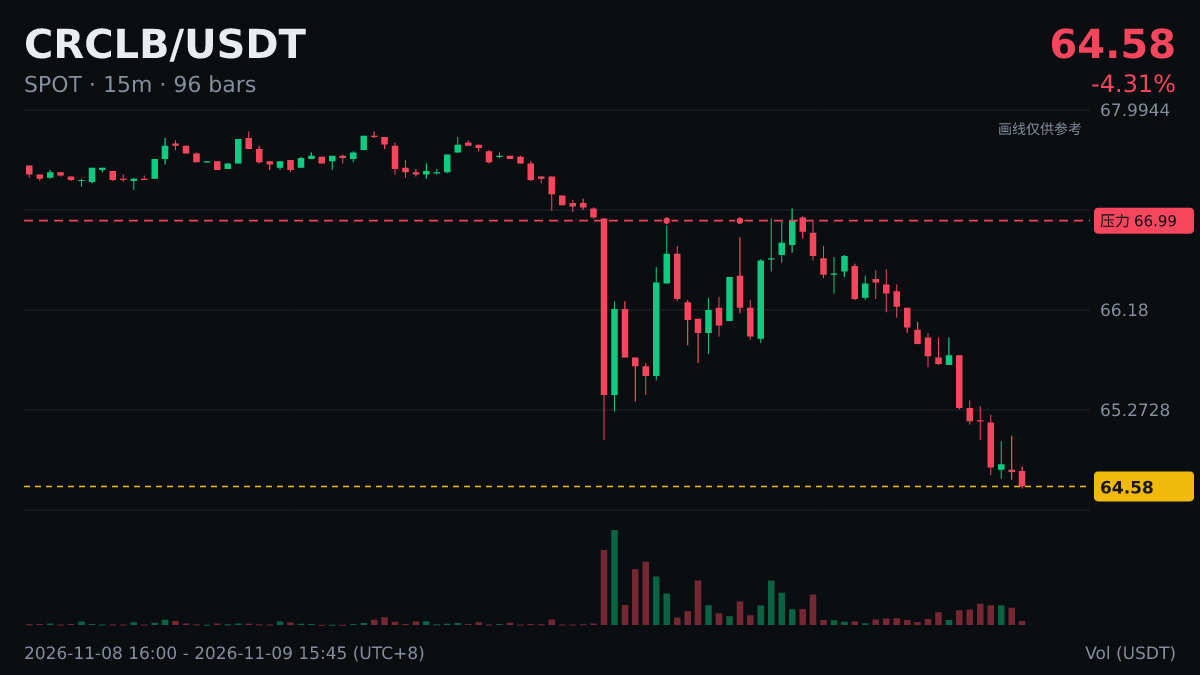
$CRCLB hit a 30-day low of 64.58, breaking below the previous low of 65.
Support below has been tested. There’s no need to rush into buying the dip; it’s safer to wait for confirmation that the decline has stopped. Watch for a possible retest of the lows.
#CRCLB
This is just my personal opinion, not investment advice.
$CRCLB hit a 30-day low of 64.58, breaking below the previous low of 65.
Support below has been tested. There’s no need to rush into buying the dip; it’s safer to wait for confirmation that the decline has stopped. Watch for a possible retest of the lows.
#CRCLB
This is just my personal opinion, not investment advice.
Support below has been tested. There’s no need to rush into buying the dip; it’s safer to wait for confirmation that the decline has stopped. Watch for a possible retest of the lows.
#CRCLB
This is just my personal opinion, not investment advice.

·
--
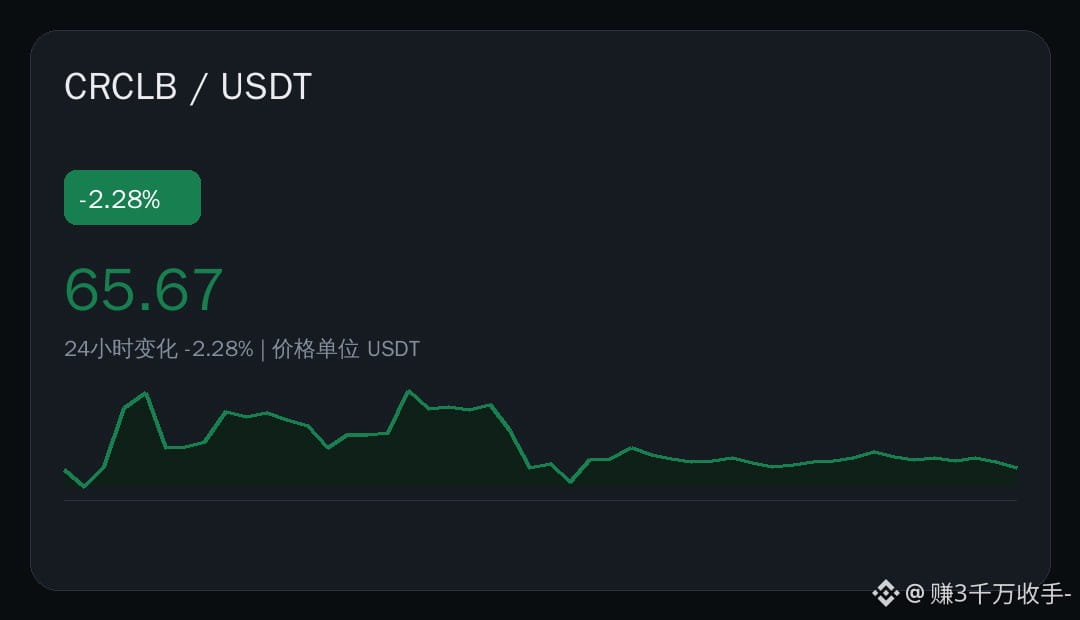
🩸 Can't hold on: $CRCLB 24 hours -2.28%, current price 65.67 USDT.
📊 Data snapshot
· Current price: 65.67 USDT
· 24h: -2.28%
· Range: 65.00 — 67.80
· Trading volume: 5091028.59 USDT
This pullback is no small move. Watching the market, you can feel both bulls and bears holding their ground. Volume tells a clearer story than price: the trading volume is right there, but neither side has made the first move. Price has tested both the top and bottom of the range, but still hasn't picked a clear direction.
What do you think? 👇
#市场观察 #CRCLB #Binance
🩸 Can't hold on: $CRCLB 24 hours -2.28%, current price 65.67 USDT.
📊 Data snapshot
· Current price: 65.67 USDT
· 24h: -2.28%
· Range: 65.00 — 67.80
· Trading volume: 5091028.59 USDT
This pullback is no small move. Watching the market, you can feel both bulls and bears holding their ground. Volume tells a clearer story than price: the trading volume is right there, but neither side has made the first move. Price has tested both the top and bottom of the range, but still hasn't picked a clear direction.
What do you think? 👇
#市场观察 #CRCLB #Binance
📊 Data snapshot
· Current price: 65.67 USDT
· 24h: -2.28%
· Range: 65.00 — 67.80
· Trading volume: 5091028.59 USDT
This pullback is no small move. Watching the market, you can feel both bulls and bears holding their ground. Volume tells a clearer story than price: the trading volume is right there, but neither side has made the first move. Price has tested both the top and bottom of the range, but still hasn't picked a clear direction.
What do you think? 👇
#市场观察 #CRCLB #Binance
11
$CRCLB: Navigating the Gap Between Attention and Evidence
When trading volume for $CRCLB moves above the baseline, it creates a visual gravity that pulls in attention. In the case of $CRCLB, we observe the hourly direction is down while daily volume sits at 2.4407e+06. It is easy to interpret this data as a signal of a coming trend, but separating evidence from persuasion requires a deeper look at incentives. A fair dilemma exists in modern crypto content: creators are often incentivized to present certainty where only probability exists.
Public analysis often relies on social proof. If many people see a RSI of 52.6285 or a price crossing 67.359, the sheer number of eyes can create a temporary feedback loop. However, the incentive structure of Write to Earn programs complicates this further. When rewards are tied to how much people consume or react to a post, creators may feel pressured to omit risks to make their thesis more attractive. This is why a reader must look for what could invalidate an idea.
For $CRCLB, if the price fails to hold near 67.26, the current downward hourly momentum might override the daily volume context. One way to reassess your interpretation is to ignore the narrative and check the relation between the price and 67.2336. Does the evidence support a recovery, or is the volume just high-velocity selling? We invite you to consider whether a creator should always show the exit door before the entry point.
Probabilistic market research, not a recommendation or guaranteed return.
Should a creator explain what could invalidate the idea before sharing a target?
#CRCLB #CryptoCommunity #CryptoLearning
$CRCLB : Navigating the Gap Between Attention and Evidence
When trading volume for $CRCLB moves above the baseline, it creates a visual gravity that pulls in attention. In the case of $CRCLB , we observe the hourly direction is down while daily volume sits at 2.4407e+06. It is easy to interpret this data as a signal of a coming trend, but separating evidence from persuasion requires a deeper look at incentives. A fair dilemma exists in modern crypto content: creators are often incentivized to present certainty where only probability exists.
Public analysis often relies on social proof. If many people see a RSI of 52.6285 or a price crossing 67.359, the sheer number of eyes can create a temporary feedback loop. However, the incentive structure of Write to Earn programs complicates this further. When rewards are tied to how much people consume or react to a post, creators may feel pressured to omit risks to make their thesis more attractive. This is why a reader must look for what could invalidate an idea.
For $CRCLB , if the price fails to hold near 67.26, the current downward hourly momentum might override the daily volume context. One way to reassess your interpretation is to ignore the narrative and check the relation between the price and 67.2336. Does the evidence support a recovery, or is the volume just high-velocity selling? We invite you to consider whether a creator should always show the exit door before the entry point.
Probabilistic market research, not a recommendation or guaranteed return.
Should a creator explain what could invalidate the idea before sharing a target?
#CRCLB #CryptoCommunity #CryptoLearning
When trading volume for $CRCLB moves above the baseline, it creates a visual gravity that pulls in attention. In the case of $CRCLB , we observe the hourly direction is down while daily volume sits at 2.4407e+06. It is easy to interpret this data as a signal of a coming trend, but separating evidence from persuasion requires a deeper look at incentives. A fair dilemma exists in modern crypto content: creators are often incentivized to present certainty where only probability exists.
Public analysis often relies on social proof. If many people see a RSI of 52.6285 or a price crossing 67.359, the sheer number of eyes can create a temporary feedback loop. However, the incentive structure of Write to Earn programs complicates this further. When rewards are tied to how much people consume or react to a post, creators may feel pressured to omit risks to make their thesis more attractive. This is why a reader must look for what could invalidate an idea.
For $CRCLB , if the price fails to hold near 67.26, the current downward hourly momentum might override the daily volume context. One way to reassess your interpretation is to ignore the narrative and check the relation between the price and 67.2336. Does the evidence support a recovery, or is the volume just high-velocity selling? We invite you to consider whether a creator should always show the exit door before the entry point.
Probabilistic market research, not a recommendation or guaranteed return.
Should a creator explain what could invalidate the idea before sharing a target?
#CRCLB #CryptoCommunity #CryptoLearning
92

$CRCLB Bull Market Target: Can 150,000 Turn Into 500,000? 📊
Right now, I am holding a total of 300 units of $CRCLB , currently valued at around 150,000. As we look ahead to the next major bull run, the big question I am analyzing is whether this position has the potential to reach 500,000.
Here is how I am breaking down the numbers and my plan:
The Math: Moving from 150,000 to 500,000 requires roughly a 3.33x return. In a full-blown crypto bull market, a 3x to 4x expansion is definitely within reach if volume, liquidity, and market sentiment align.
Spot Patience: Rather than chasing short-term pumps or risking capital with high leverage, I am keeping my 300 units safely in spot and letting the broader trend play out.
Disciplined Exit Plan: Reaching a target like 500,000 only matters if you actually secure it. If momentum kicks in, I plan to scale out gradually using staggered limit orders on the way up instead of getting greedy.
What is your realistic bull market target for $CRCLB ? Do you think a 3.3x from these levels is doable, or are you aiming even higher? Share your thoughts below! 👇
#CRCLB #CryptoTrading #bullmarket #SpotTrading. #BinanceSquare
$CRCLB Bull Market Target: Can 150,000 Turn Into 500,000? 📊
Right now, I am holding a total of 300 units of $CRCLB , currently valued at around 150,000. As we look ahead to the next major bull run, the big question I am analyzing is whether this position has the potential to reach 500,000.
Here is how I am breaking down the numbers and my plan:
The Math: Moving from 150,000 to 500,000 requires roughly a 3.33x return. In a full-blown crypto bull market, a 3x to 4x expansion is definitely within reach if volume, liquidity, and market sentiment align.
Spot Patience: Rather than chasing short-term pumps or risking capital with high leverage, I am keeping my 300 units safely in spot and letting the broader trend play out.
Disciplined Exit Plan: Reaching a target like 500,000 only matters if you actually secure it. If momentum kicks in, I plan to scale out gradually using staggered limit orders on the way up instead of getting greedy.
What is your realistic bull market target for $CRCLB ? Do you think a 3.3x from these levels is doable, or are you aiming even higher? Share your thoughts below! 👇
#CRCLB #CryptoTrading #bullmarket #SpotTrading. #BinanceSquare
Right now, I am holding a total of 300 units of $CRCLB , currently valued at around 150,000. As we look ahead to the next major bull run, the big question I am analyzing is whether this position has the potential to reach 500,000.
Here is how I am breaking down the numbers and my plan:
The Math: Moving from 150,000 to 500,000 requires roughly a 3.33x return. In a full-blown crypto bull market, a 3x to 4x expansion is definitely within reach if volume, liquidity, and market sentiment align.
Spot Patience: Rather than chasing short-term pumps or risking capital with high leverage, I am keeping my 300 units safely in spot and letting the broader trend play out.
Disciplined Exit Plan: Reaching a target like 500,000 only matters if you actually secure it. If momentum kicks in, I plan to scale out gradually using staggered limit orders on the way up instead of getting greedy.
What is your realistic bull market target for $CRCLB ? Do you think a 3.3x from these levels is doable, or are you aiming even higher? Share your thoughts below! 👇
#CRCLB #CryptoTrading #bullmarket #SpotTrading. #BinanceSquare
399
The Timing Dilemma for $CRCLB
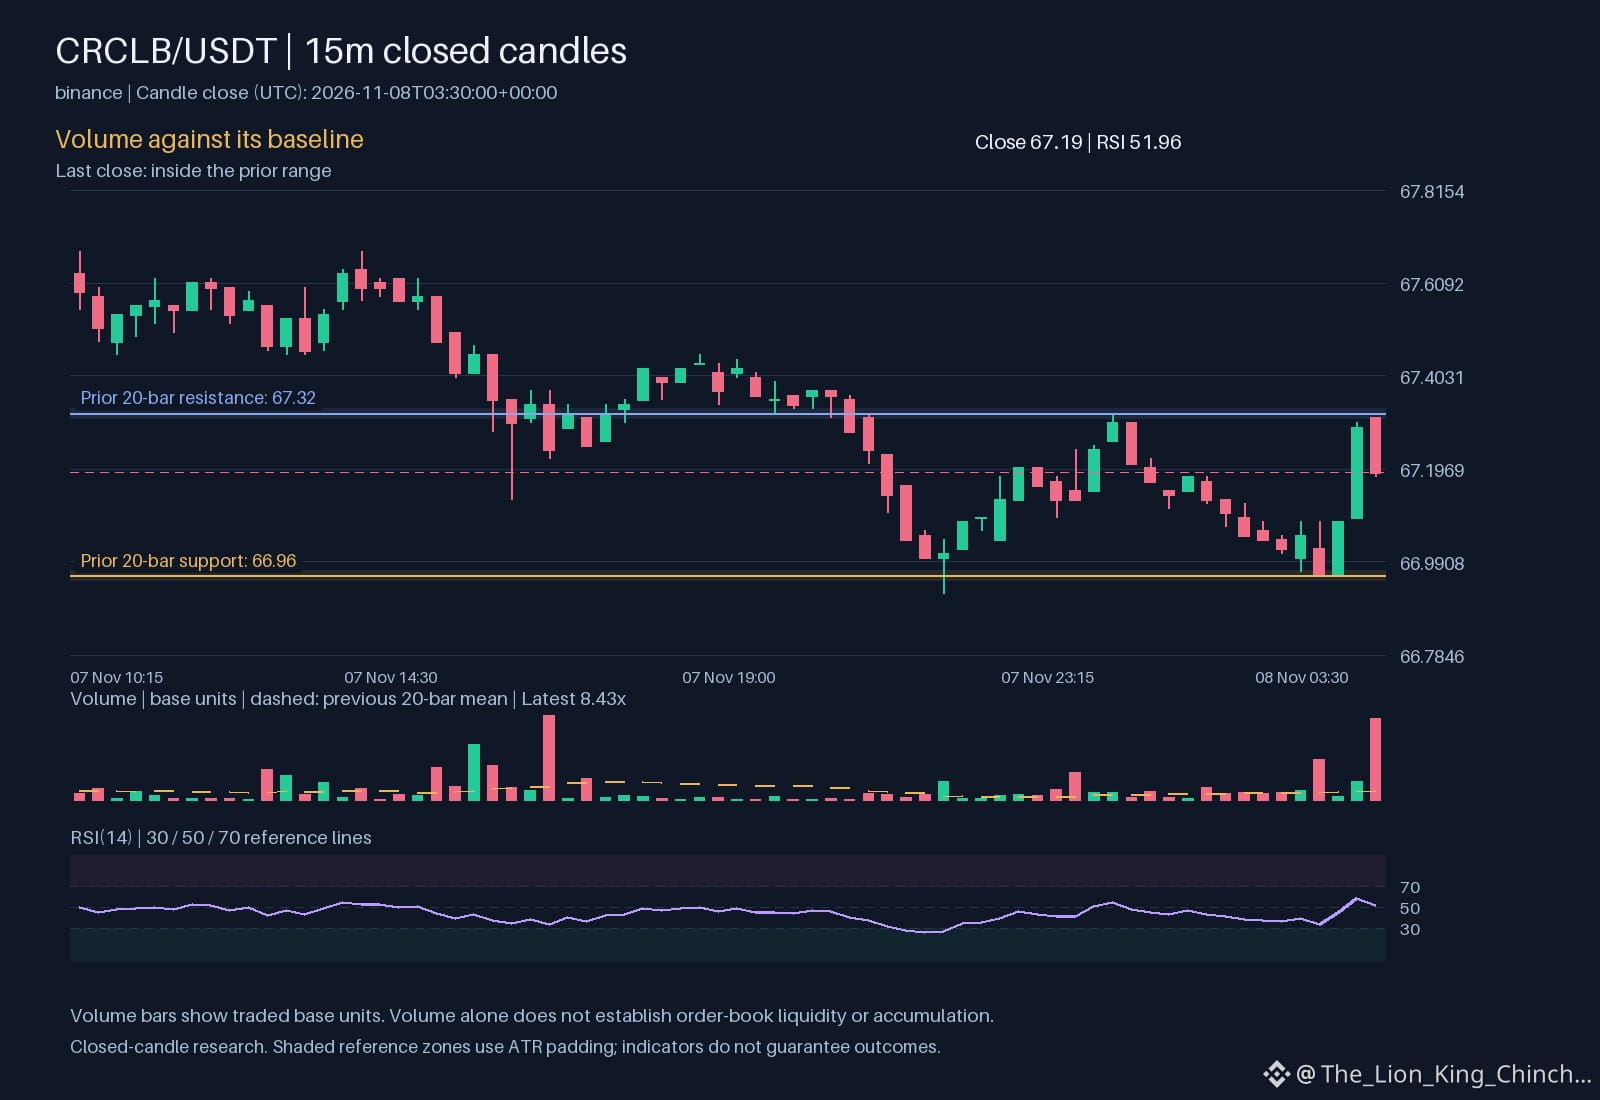
Current evidence for $CRCLB shows an hourly direction up with volume observed above its baseline. While the price sits at 67.19, the increase in activity relative to the daily volume of 1.8057e+06 suggests a shift in market participation. This creates a practical trade-off between entry quality and the risk of chasing a moving price.
Consider a thought experiment. If a researcher waits for a pullback to ensure a better entry price, the market might continue upward without them. Conversely, buying immediately often results in a wider distance to a meaningful invalidation point, such as the support at 66.96. This distance increases the potential loss if the thesis fails. A higher RSI of 51.9555 further complicates this by suggesting the move is already mature.
If the assumption of continued momentum fails, the increased volume could represent a localized peak rather than a sustainable trend. Reassessing the interpretation requires watching how price reacts to the resistance at 67.32. If $CRCLB fails to hold its ground despite high relative volume, the original bullish bias might be flawed.
Before acting, a decision checklist helps. Is the current gap to the stop loss manageable? Does the volume trend persist over multiple hourly candles? Balancing these factors is essential for navigating the current volatility of $CRCLB.
Probabilistic market research, not a recommendation or guaranteed return.
Would you wait for clearer structure or reassess the risk first?
#CRCLB #RiskManagement
The Timing Dilemma for $CRCLB
Current evidence for $CRCLB shows an hourly direction up with volume observed above its baseline. While the price sits at 67.19, the increase in activity relative to the daily volume of 1.8057e+06 suggests a shift in market participation. This creates a practical trade-off between entry quality and the risk of chasing a moving price.
Consider a thought experiment. If a researcher waits for a pullback to ensure a better entry price, the market might continue upward without them. Conversely, buying immediately often results in a wider distance to a meaningful invalidation point, such as the support at 66.96. This distance increases the potential loss if the thesis fails. A higher RSI of 51.9555 further complicates this by suggesting the move is already mature.
If the assumption of continued momentum fails, the increased volume could represent a localized peak rather than a sustainable trend. Reassessing the interpretation requires watching how price reacts to the resistance at 67.32. If $CRCLB fails to hold its ground despite high relative volume, the original bullish bias might be flawed.
Before acting, a decision checklist helps. Is the current gap to the stop loss manageable? Does the volume trend persist over multiple hourly candles? Balancing these factors is essential for navigating the current volatility of $CRCLB .
Probabilistic market research, not a recommendation or guaranteed return.
Would you wait for clearer structure or reassess the risk first?
#CRCLB #RiskManagement
Current evidence for $CRCLB shows an hourly direction up with volume observed above its baseline. While the price sits at 67.19, the increase in activity relative to the daily volume of 1.8057e+06 suggests a shift in market participation. This creates a practical trade-off between entry quality and the risk of chasing a moving price.
Consider a thought experiment. If a researcher waits for a pullback to ensure a better entry price, the market might continue upward without them. Conversely, buying immediately often results in a wider distance to a meaningful invalidation point, such as the support at 66.96. This distance increases the potential loss if the thesis fails. A higher RSI of 51.9555 further complicates this by suggesting the move is already mature.
If the assumption of continued momentum fails, the increased volume could represent a localized peak rather than a sustainable trend. Reassessing the interpretation requires watching how price reacts to the resistance at 67.32. If $CRCLB fails to hold its ground despite high relative volume, the original bullish bias might be flawed.
Before acting, a decision checklist helps. Is the current gap to the stop loss manageable? Does the volume trend persist over multiple hourly candles? Balancing these factors is essential for navigating the current volatility of $CRCLB .
Probabilistic market research, not a recommendation or guaranteed return.
Would you wait for clearer structure or reassess the risk first?
#CRCLB #RiskManagement
20

·
--
$CRCLB +0.99% | $RSR +0.98% | $TON +0.95%
#CRCLB nudged up to $67.34, gaining +0.99% on $5.7 M of volume.
#RSR slipped to $0.00155200, up +0.98% with $1.2 M changing hands. It remains the ERC‑20 token that backs the Reserve protocol’s over‑collateralisation model.
#TON rose to $1.60, climbing +0.95% on $7.7 M of volume.
👀 The trio’s sub‑1% moves together with solid turnover could hint at a quiet accumulation phase.
#Write2Earn #Binance
$CRCLB +0.99% | $RSR +0.98% | $TON +0.95%
#CRCLB nudged up to $67.34, gaining +0.99% on $5.7 M of volume.
#RSR slipped to $0.00155200, up +0.98% with $1.2 M changing hands. It remains the ERC‑20 token that backs the Reserve protocol’s over‑collateralisation model.
#TON rose to $1.60, climbing +0.95% on $7.7 M of volume.
👀 The trio’s sub‑1% moves together with solid turnover could hint at a quiet accumulation phase.
#Write2Earn #Binance
#CRCLB nudged up to $67.34, gaining +0.99% on $5.7 M of volume.
#RSR slipped to $0.00155200, up +0.98% with $1.2 M changing hands. It remains the ERC‑20 token that backs the Reserve protocol’s over‑collateralisation model.
#TON rose to $1.60, climbing +0.95% on $7.7 M of volume.
👀 The trio’s sub‑1% moves together with solid turnover could hint at a quiet accumulation phase.
#Write2Earn #Binance
10

·
--
$CRCLB +1.99% | $KORUB +1.91% | $ETHFI +1.83%
#CRCLB nudged up to $67.28, gaining +1.99% on $6.9 M of volume. The price edge is modest but the flow suggests some buying interest.
#KORUB rose to $6.94, up +1.91% with $2.3 M traded. Momentum is steady, though the volume is relatively thin compared with larger caps.
#ETHFI climbed to $0.5843, up +1.83% on $2.0 M of volume. The token’s rise is supported by a decent trade size for its tier, hinting at growing attention.
📊 Watch how the differing volume levels may influence the sustainability of these gains.
#Write2Earn #Binance
$CRCLB +1.99% | $KORUB +1.91% | $ETHFI +1.83%
#CRCLB nudged up to $67.28, gaining +1.99% on $6.9 M of volume. The price edge is modest but the flow suggests some buying interest.
#KORUB rose to $6.94, up +1.91% with $2.3 M traded. Momentum is steady, though the volume is relatively thin compared with larger caps.
#ETHFI climbed to $0.5843, up +1.83% on $2.0 M of volume. The token’s rise is supported by a decent trade size for its tier, hinting at growing attention.
📊 Watch how the differing volume levels may influence the sustainability of these gains.
#Write2Earn #Binance
#CRCLB nudged up to $67.28, gaining +1.99% on $6.9 M of volume. The price edge is modest but the flow suggests some buying interest.
#KORUB rose to $6.94, up +1.91% with $2.3 M traded. Momentum is steady, though the volume is relatively thin compared with larger caps.
#ETHFI climbed to $0.5843, up +1.83% on $2.0 M of volume. The token’s rise is supported by a decent trade size for its tier, hinting at growing attention.
📊 Watch how the differing volume levels may influence the sustainability of these gains.
#Write2Earn #Binance
18

·
--
Bottom line first: CRCLB clearly had a correction day yesterday, and the bulls failed to catch it.
Market data: Current price 67.63, down 3.05% over 24 hours; trading volume 14 million USDT; intraday high 69.78, low 65.82, with a 6.0% range.
The current price is in the lower-middle part of the range (46%). The market is consolidating weakly, and the rebound lacks strength.
The price has fallen below the 7-day moving average (71.4271) and is below the 25-day moving average (78.8936), indicating that the short-term structure has weakened.
In terms of positioning, the price is down 26.6% from the 30-day high of 92.13. The 30-day low is 65, and the 7-day cumulative change is -7.0%.
Trading volume is neutral; the market direction is being gradually determined by capital flows.
The key levels are clear: 69.78, the intraday high, is resistance above; 65.82 is the short-term support below. A break below the latter would truly open up more downside.
Keep an eye on two things next: whether the previous high above can be decisively broken—otherwise, treat this as range-bound trading—and whether effective support can form above the low, which will determine if more downside opens up.
Which part of this move did you catch, and which part did you miss?
(The above is a review of market action and does not constitute investment advice. Futures trading involves risk.)
#CRCLB #行情复盘 #FuturesTrading
Bottom line first: CRCLB clearly had a correction day yesterday, and the bulls failed to catch it.
Market data: Current price 67.63, down 3.05% over 24 hours; trading volume 14 million USDT; intraday high 69.78, low 65.82, with a 6.0% range.
The current price is in the lower-middle part of the range (46%). The market is consolidating weakly, and the rebound lacks strength.
The price has fallen below the 7-day moving average (71.4271) and is below the 25-day moving average (78.8936), indicating that the short-term structure has weakened.
In terms of positioning, the price is down 26.6% from the 30-day high of 92.13. The 30-day low is 65, and the 7-day cumulative change is -7.0%.
Trading volume is neutral; the market direction is being gradually determined by capital flows.
The key levels are clear: 69.78, the intraday high, is resistance above; 65.82 is the short-term support below. A break below the latter would truly open up more downside.
Keep an eye on two things next: whether the previous high above can be decisively broken—otherwise, treat this as range-bound trading—and whether effective support can form above the low, which will determine if more downside opens up.
Which part of this move did you catch, and which part did you miss?
(The above is a review of market action and does not constitute investment advice. Futures trading involves risk.)
#CRCLB #行情复盘 #FuturesTrading
Market data: Current price 67.63, down 3.05% over 24 hours; trading volume 14 million USDT; intraday high 69.78, low 65.82, with a 6.0% range.
The current price is in the lower-middle part of the range (46%). The market is consolidating weakly, and the rebound lacks strength.
The price has fallen below the 7-day moving average (71.4271) and is below the 25-day moving average (78.8936), indicating that the short-term structure has weakened.
In terms of positioning, the price is down 26.6% from the 30-day high of 92.13. The 30-day low is 65, and the 7-day cumulative change is -7.0%.
Trading volume is neutral; the market direction is being gradually determined by capital flows.
The key levels are clear: 69.78, the intraday high, is resistance above; 65.82 is the short-term support below. A break below the latter would truly open up more downside.
Keep an eye on two things next: whether the previous high above can be decisively broken—otherwise, treat this as range-bound trading—and whether effective support can form above the low, which will determine if more downside opens up.
Which part of this move did you catch, and which part did you miss?
(The above is a review of market action and does not constitute investment advice. Futures trading involves risk.)
#CRCLB #行情复盘 #FuturesTrading
80

🌀 Watching CRCLB lately feels like spotting a subtle tide shift in a quiet harbor – the coin’s last hour hinted a gentle rise, a whisper of momentum that’s still fresh in the water. Yet the deeper currents remain unseen: will that lift hold as broader sentiment steadies, or could a hidden swell pull it back? Keep an eye on the order‑book depth and any sudden volume spikes – that’s the practical litmus test before we ride the wave. 🌊🔍
Not financial advice.
#CryptoWatch #AltcoinInsights #MarketCuriosity #CRCLB #Write2Earn
🌀 Watching CRCLB lately feels like spotting a subtle tide shift in a quiet harbor – the coin’s last hour hinted a gentle rise, a whisper of momentum that’s still fresh in the water. Yet the deeper currents remain unseen: will that lift hold as broader sentiment steadies, or could a hidden swell pull it back? Keep an eye on the order‑book depth and any sudden volume spikes – that’s the practical litmus test before we ride the wave. 🌊🔍
Not financial advice.
#CryptoWatch #AltcoinInsights #MarketCuriosity #CRCLB #Write2Earn
Not financial advice.
#CryptoWatch #AltcoinInsights #MarketCuriosity #CRCLB #Write2Earn
690

·
--
🔍 $CRCLB price drop breakdown
5 min: +0.00%
1h: -0.07%
4h: -0.06%
24h: -2.33%
Current price: 67.45, 24h trading volume: $18.33 million
Down -2.33% in a single day, with the selling pressure not concentrated in any one short time frame—it looks more like a gradual weakening throughout the day.
Do you think this is a sentiment-driven exit or a trend turning bearish? 👇
(Data analysis, not investment advice. DYOR)
#CRCLB
🔍 $CRCLB price drop breakdown
5 min: +0.00%
1h: -0.07%
4h: -0.06%
24h: -2.33%
Current price: 67.45, 24h trading volume: $18.33 million
Down -2.33% in a single day, with the selling pressure not concentrated in any one short time frame—it looks more like a gradual weakening throughout the day.
Do you think this is a sentiment-driven exit or a trend turning bearish? 👇
(Data analysis, not investment advice. DYOR)
#CRCLB
5 min: +0.00%
1h: -0.07%
4h: -0.06%
24h: -2.33%
Current price: 67.45, 24h trading volume: $18.33 million
Down -2.33% in a single day, with the selling pressure not concentrated in any one short time frame—it looks more like a gradual weakening throughout the day.
Do you think this is a sentiment-driven exit or a trend turning bearish? 👇
(Data analysis, not investment advice. DYOR)
#CRCLB
7
·
--
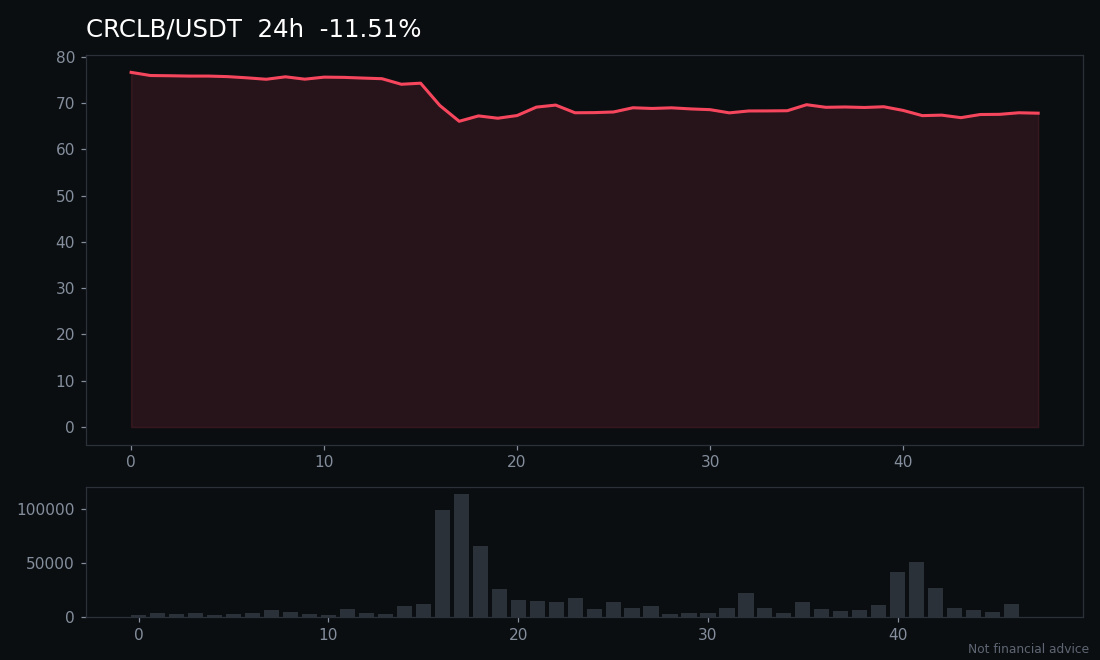
$CRCLB is cooling off after a strong run, down 1.7% in the last 24 hours to around $67.82, with volume still holding above $21 million. That kind of volume on a red day tells you traders are not walking away, they are watching the tape. The question now is whether buyers step back in near this level or sellers press the advantage. A clean reclaim of recent highs would shift the tone, while a weak bounce keeps the pressure on. #BinanceSquare #Crypto #CRCLB
Not financial advice.
$CRCLB is cooling off after a strong run, down 1.7% in the last 24 hours to around $67.82, with volume still holding above $21 million. That kind of volume on a red day tells you traders are not walking away, they are watching the tape. The question now is whether buyers step back in near this level or sellers press the advantage. A clean reclaim of recent highs would shift the tone, while a weak bounce keeps the pressure on. #BinanceSquare #Crypto #CRCLB
Not financial advice.
Not financial advice.
10

·
--
$CRCLB sliding 7.54% to $69.64 brings volume down to 0.20x of its prior hourly average.
The recent low sits at $65.00 while the high reached $75.68, showing deep intraday volatility within a broader daily pullback.
If buyers reclaim higher momentum above the recent range midpoint, a push toward the $75.68 high becomes a logical scenario to watch. Conversely, losing the $65.00 low invalidates immediate stabilization.
Will you wait for a confirmed reclaim of the midpoint, or does a drop below $65.00 keep you on the sidelines?
Tap $CRCLB for the live chart. #CRCLB #BinanceSquare
$CRCLB sliding 7.54% to $69.64 brings volume down to 0.20x of its prior hourly average.
The recent low sits at $65.00 while the high reached $75.68, showing deep intraday volatility within a broader daily pullback.
If buyers reclaim higher momentum above the recent range midpoint, a push toward the $75.68 high becomes a logical scenario to watch. Conversely, losing the $65.00 low invalidates immediate stabilization.
Will you wait for a confirmed reclaim of the midpoint, or does a drop below $65.00 keep you on the sidelines?
Tap $CRCLB for the live chart. #CRCLB #BinanceSquare
The recent low sits at $65.00 while the high reached $75.68, showing deep intraday volatility within a broader daily pullback.
If buyers reclaim higher momentum above the recent range midpoint, a push toward the $75.68 high becomes a logical scenario to watch. Conversely, losing the $65.00 low invalidates immediate stabilization.
Will you wait for a confirmed reclaim of the midpoint, or does a drop below $65.00 keep you on the sidelines?
Tap $CRCLB for the live chart. #CRCLB #BinanceSquare
8
·
--
A double-digit daily drop rarely signals an immediate floor.
$CRCLB trades at $67.85 after a 10.32% slide on $34.46M volume.
Recent hourly candles show a minor 0.63% uptick near 68.31, with volume pacing slightly above the daily average at 1.05x.
If buyers reclaim the 75.93 high from the preceding range, momentum could shift. However, a break below the 65 low invalidates this stabilization view.
Will you wait for a reclaim of 75.93, or does a drop past 65 signal deeper downside risks?
Tap $CRCLB for the live chart. #CRCLB #BinanceSquare
A double-digit daily drop rarely signals an immediate floor.
$CRCLB trades at $67.85 after a 10.32% slide on $34.46M volume.
Recent hourly candles show a minor 0.63% uptick near 68.31, with volume pacing slightly above the daily average at 1.05x.
If buyers reclaim the 75.93 high from the preceding range, momentum could shift. However, a break below the 65 low invalidates this stabilization view.
Will you wait for a reclaim of 75.93, or does a drop past 65 signal deeper downside risks?
Tap $CRCLB for the live chart. #CRCLB #BinanceSquare
$CRCLB trades at $67.85 after a 10.32% slide on $34.46M volume.
Recent hourly candles show a minor 0.63% uptick near 68.31, with volume pacing slightly above the daily average at 1.05x.
If buyers reclaim the 75.93 high from the preceding range, momentum could shift. However, a break below the 65 low invalidates this stabilization view.
Will you wait for a reclaim of 75.93, or does a drop past 65 signal deeper downside risks?
Tap $CRCLB for the live chart. #CRCLB #BinanceSquare
15

·
--
$CRCLB — Short Setup | Market Analysis
CRCLBUSDT has experienced a significant downturn, dropping over 9.5% in the last 24 hours, indicative of strong bearish momentum. This considerable depreciation, supported by healthy trading volume, points to potential further declines. Initiating a short position capitalizes on the established downtrend.
Market Context
24h Change: -9.56%
24h Volume: 32.9M USDT
Trade Plan
Entry: 68.83
Stop Loss: 69.86
TP1: 67.8
TP2: 66.77
TP3: 65.39
⚖️ Risk:Reward (TP1) 1:1.00
Confirmation Trigger: Immediate entry at current market price
Risk Note: Cryptocurrency trading is highly speculative and carries a substantial risk of loss. This trade setup is for informational purposes only and does not constitute financial advice. Always exercise proper risk management and conduct your own due diligence.
Not financial advice. Do your own research.
#CRCLB #crclb
$CRCLB — Short Setup | Market Analysis
CRCLBUSDT has experienced a significant downturn, dropping over 9.5% in the last 24 hours, indicative of strong bearish momentum. This considerable depreciation, supported by healthy trading volume, points to potential further declines. Initiating a short position capitalizes on the established downtrend.
Market Context
24h Change: -9.56%
24h Volume: 32.9M USDT
Trade Plan
Entry: 68.83
Stop Loss: 69.86
TP1: 67.8
TP2: 66.77
TP3: 65.39
⚖️ Risk:Reward (TP1) 1:1.00
Confirmation Trigger: Immediate entry at current market price
Risk Note: Cryptocurrency trading is highly speculative and carries a substantial risk of loss. This trade setup is for informational purposes only and does not constitute financial advice. Always exercise proper risk management and conduct your own due diligence.
Not financial advice. Do your own research.
#CRCLB #crclb
CRCLBUSDT has experienced a significant downturn, dropping over 9.5% in the last 24 hours, indicative of strong bearish momentum. This considerable depreciation, supported by healthy trading volume, points to potential further declines. Initiating a short position capitalizes on the established downtrend.
Market Context
24h Change: -9.56%
24h Volume: 32.9M USDT
Trade Plan
Entry: 68.83
Stop Loss: 69.86
TP1: 67.8
TP2: 66.77
TP3: 65.39
⚖️ Risk:Reward (TP1) 1:1.00
Confirmation Trigger: Immediate entry at current market price
Risk Note: Cryptocurrency trading is highly speculative and carries a substantial risk of loss. This trade setup is for informational purposes only and does not constitute financial advice. Always exercise proper risk management and conduct your own due diligence.
Not financial advice. Do your own research.
#CRCLB #crclb
42
Log in to explore more content
Join global crypto users on Binance Square
⚡️ Get latest and useful information about crypto.
💬 Trusted by the world’s largest crypto exchange.
👍 Discover real insights from verified creators.
Email / Phone number
Trending Topics
1
#NvidiaInvestigatesAfterHuang’sAffairApology
130,944 views
1,373 Discussing
2
#BitcoinFiveWeeklyLosses
160,269 views
1,841 Discussing
3
#AIChipSlumpNasdaq
83,045 views
1,152 Discussing
4
#CPITestsDecemberRateOutlook
586,831 views
2,604 Discussing
5
#AnthropicRejectsIPODelayValuationinQuestion
17,825 views
306 Discussing
6
#CryptoLiquidationsReach$1.16BIn24Hours
3,051 views
29 Discussing
7
#BrentCrudeDrops3.8%To$94.56
3,065 views
16 Discussing
8
#EUInstitutionsInviteIndustryToSetTokenizedSecuritiesStandards
1,080 views
8 Discussing
9
#ChinaCACListsFiveIssuesAffectingBlockchainFilings
7,347 views
108 Discussing
10
#UKBanksCanNowApplyToConductCryptoAssetBusiness
5,359 views
75 Discussing