
#cost
cost
12,012 views
132 Discussing
Hot
Latest

$COST 4-hour technical indicators strengthen, short-term bullish signals emerge
📈 $COST | 4-hour bullish signal
━━━━━━━━━━━━━━━━━━
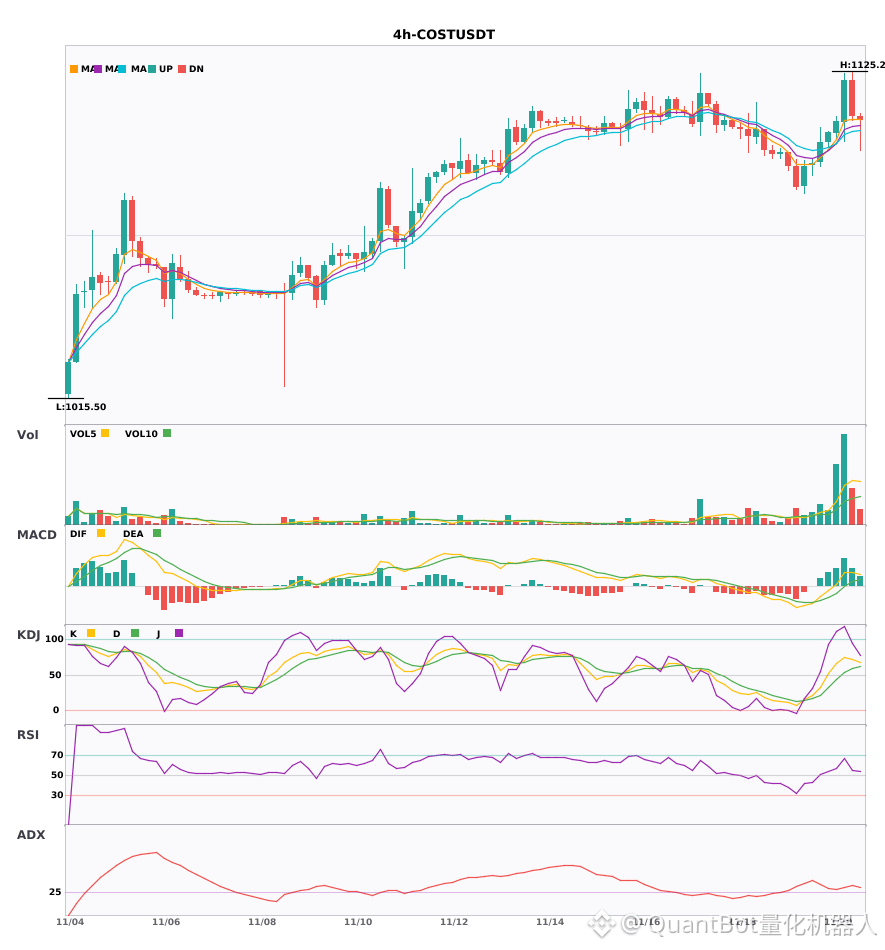
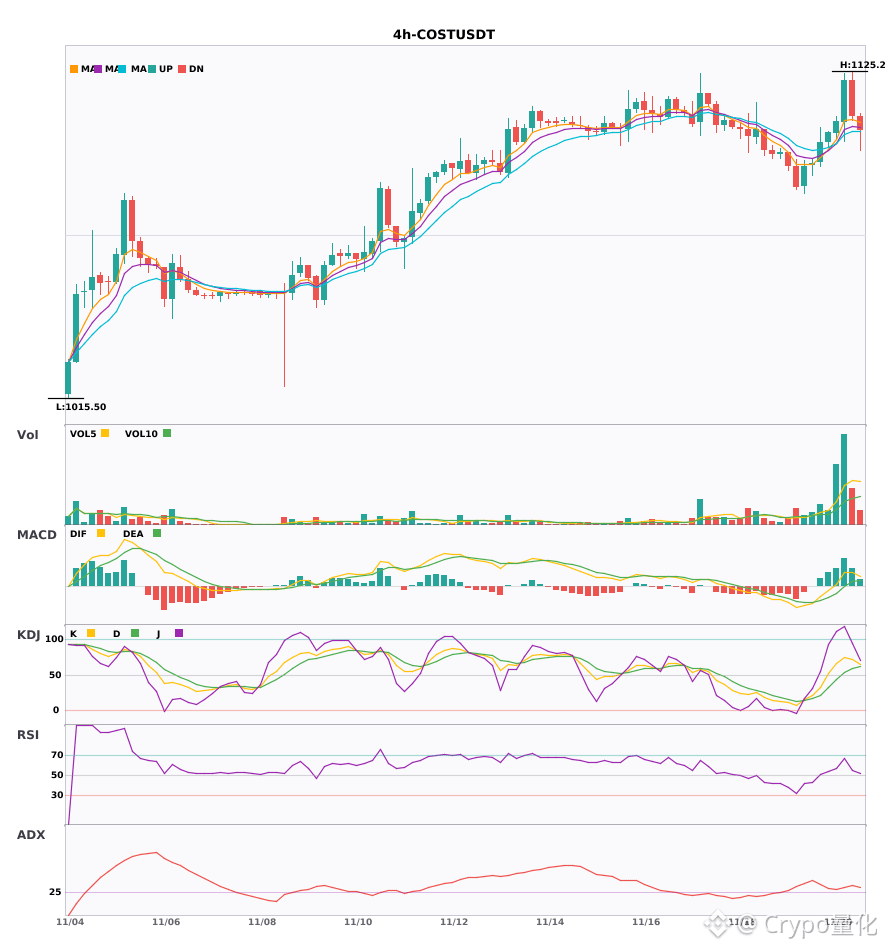
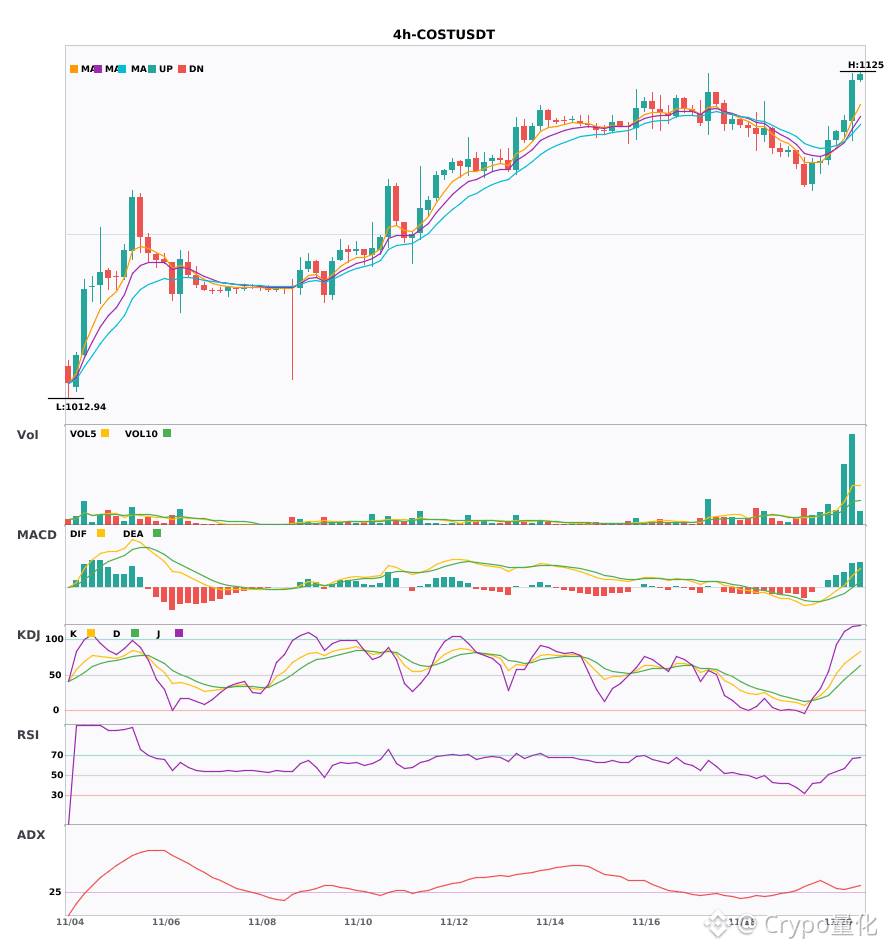
Technical analysis: ADX(34) indicates a strong trend, MACD is bullish, EMA5>8>13 are in bullish alignment, KDJ 75.2/54.0, volume is 4x.
Price change: 1.2400%
📌 Market update: MSTR's head of investor relations responds to the Bitcoin pullback and stock performance.
━━━━━━━━━━━━━━━━━━
#技术分析 #COST
📌 The above content is for reference only and does not constitute investment advice
$COST 4-hour technical indicators strengthen, short-term bullish signals emerge
📈 $COST | 4-hour bullish signal
━━━━━━━━━━━━━━━━━━
Technical analysis: ADX(34) indicates a strong trend, MACD is bullish, EMA5>8>13 are in bullish alignment, KDJ 75.2/54.0, volume is 4x.
Price change: 1.2400%
📌 Market update: MSTR's head of investor relations responds to the Bitcoin pullback and stock performance.
━━━━━━━━━━━━━━━━━━
#技术分析 #COST
📌 The above content is for reference only and does not constitute investment advice
📈 $COST | 4-hour bullish signal
━━━━━━━━━━━━━━━━━━
Technical analysis: ADX(34) indicates a strong trend, MACD is bullish, EMA5>8>13 are in bullish alignment, KDJ 75.2/54.0, volume is 4x.
Price change: 1.2400%
📌 Market update: MSTR's head of investor relations responds to the Bitcoin pullback and stock performance.
━━━━━━━━━━━━━━━━━━
#技术分析 #COST
📌 The above content is for reference only and does not constitute investment advice
6

·
--
$COST 4 hours, leaning bullish! Bullish moving averages diverging, MACD golden cross with rising volume🔥
════════════════════
🔴 $COST 4-hour bullish signal
⚠️Technical analysis: ADX is rising, indicating a clear trend; after the MACD golden cross, the red bars are expanding, showing strong momentum; EMA5, 8, and 13 are diverging upward in a bullish alignment; K has crossed above D and is not overbought, with K at 75 and D at 54; trading volume surged 4x.
📢Market update: MSTR's head of investor relations commented on the Bitcoin pullback and the stock's performance.
════════════════════
🔔 Follow to get first-hand market alerts 🔔
#技术分析 #COST
📌 When trading, watch whether the candlestick pattern confirms the setup
$COST 4 hours, leaning bullish! Bullish moving averages diverging, MACD golden cross with rising volume🔥
════════════════════
🔴 $COST 4-hour bullish signal
⚠️Technical analysis: ADX is rising, indicating a clear trend; after the MACD golden cross, the red bars are expanding, showing strong momentum; EMA5, 8, and 13 are diverging upward in a bullish alignment; K has crossed above D and is not overbought, with K at 75 and D at 54; trading volume surged 4x.
📢Market update: MSTR's head of investor relations commented on the Bitcoin pullback and the stock's performance.
════════════════════
🔔 Follow to get first-hand market alerts 🔔
#技术分析 #COST
📌 When trading, watch whether the candlestick pattern confirms the setup
════════════════════
🔴 $COST 4-hour bullish signal
⚠️Technical analysis: ADX is rising, indicating a clear trend; after the MACD golden cross, the red bars are expanding, showing strong momentum; EMA5, 8, and 13 are diverging upward in a bullish alignment; K has crossed above D and is not overbought, with K at 75 and D at 54; trading volume surged 4x.
📢Market update: MSTR's head of investor relations commented on the Bitcoin pullback and the stock's performance.
════════════════════
🔔 Follow to get first-hand market alerts 🔔
#技术分析 #COST
📌 When trading, watch whether the candlestick pattern confirms the setup
9

·
--
Bullish
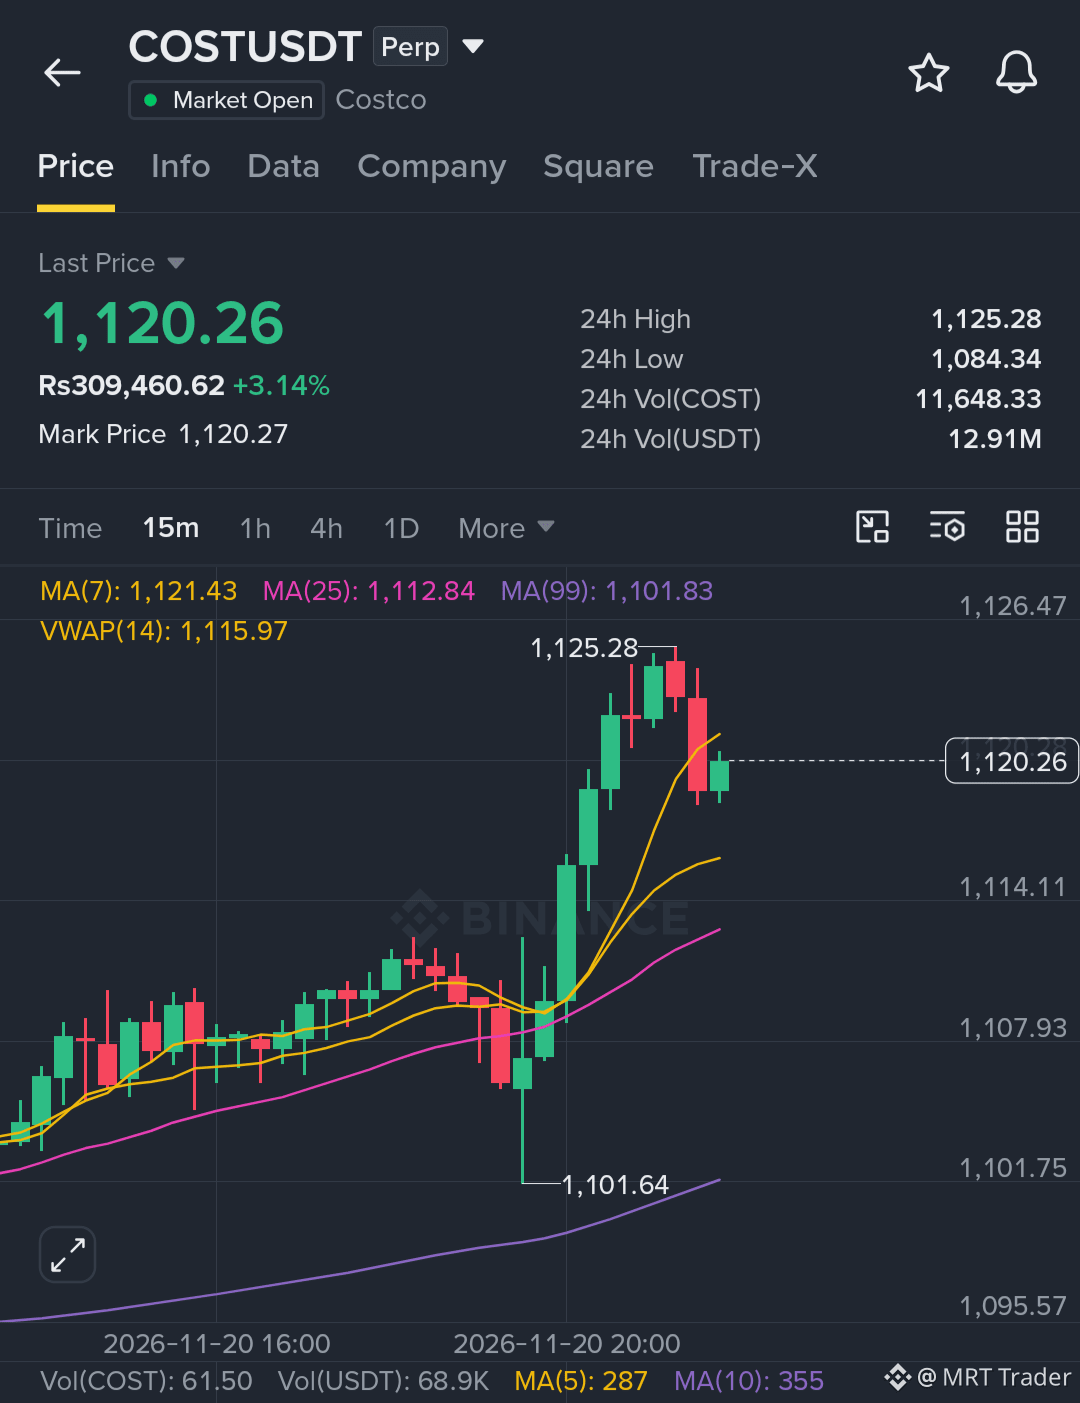
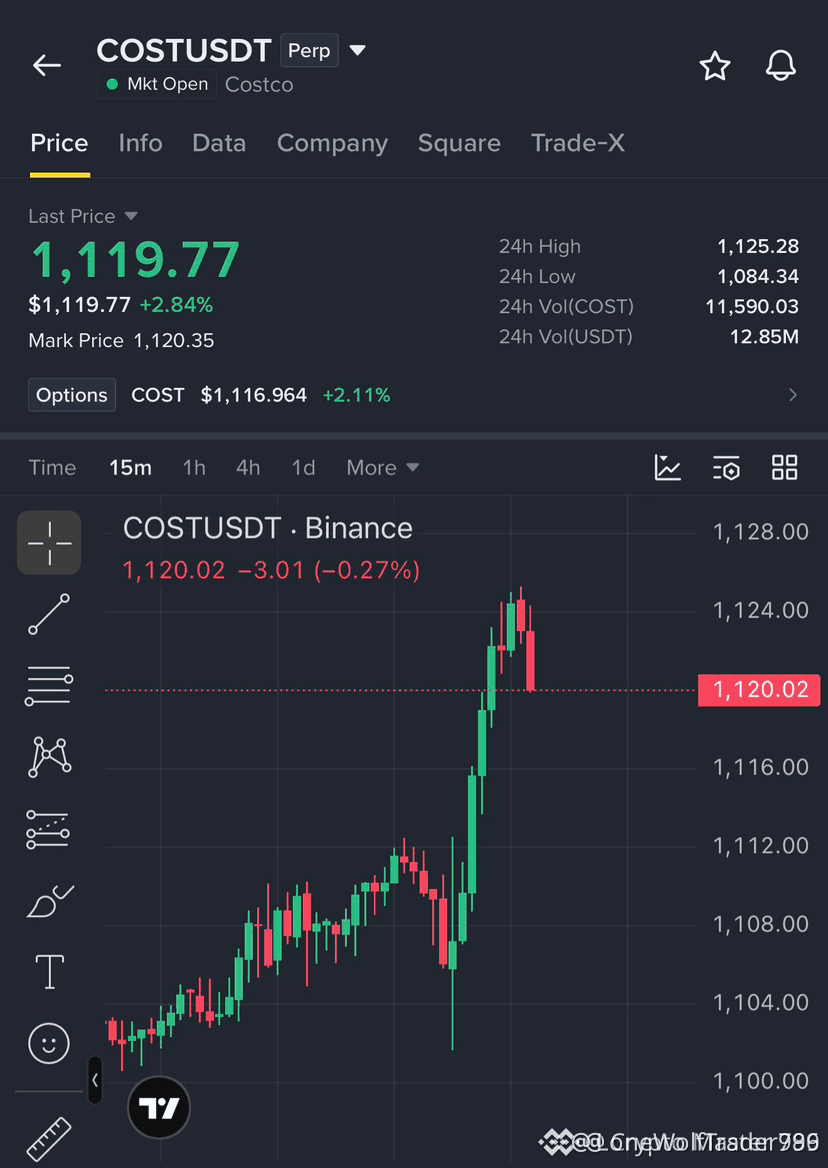
$COST ran hard and is now facing rejection, and this area could set up a short opportunity if sellers keep pressing. 👀
Key Level
🔴 Bearish below $1,112
Trade Setup (Short)
🔴 Entry Zone: $1,113 – $1,119
🎯 Target: $1,108
⛔ Stop Loss: $1,126
Stay patient, wait for rejection near the entry zone, and always manage your risk.
Click here to sell now 👉 $COST
{future}(COSTUSDT)
#COST #TradFiForBeginners
$COST ran hard and is now facing rejection, and this area could set up a short opportunity if sellers keep pressing. 👀
Key Level
🔴 Bearish below $1,112
Trade Setup (Short)
🔴 Entry Zone: $1,113 – $1,119
🎯 Target: $1,108
⛔ Stop Loss: $1,126
Stay patient, wait for rejection near the entry zone, and always manage your risk.
Click here to sell now 👉 $COST
#COST #TradFiForBeginners
Key Level
🔴 Bearish below $1,112
Trade Setup (Short)
🔴 Entry Zone: $1,113 – $1,119
🎯 Target: $1,108
⛔ Stop Loss: $1,126
Stay patient, wait for rejection near the entry zone, and always manage your risk.
Click here to sell now 👉 $COST
#COST #TradFiForBeginners
4
39

·
--
🔴 $COST REJECTION AT MAJOR RESISTANCE SIGNALS AN INSTITUTIONAL DISTRIBUTION PHASE! 📉
Target: $1,108 🚀
Stop Loss: $1,126 🛑
Price action on $COST has stalled sharply after testing upper structural bounds, leaving a heavy cluster of unfilled sell orders above. 📊 Smart money is actively rotating capital as momentum indicators confirm exhaustion on the higher timeframes. ⚡
We are eyeing a measured pullback toward the liquidity pocket below. 🔍 Are you positioning for this continuation lower or waiting for a deeper retest of the range? 💬
⚠️ Not financial advice. Always manage your risk. 🛡️
🏷️ #COST #ShortSetup #MarketStructure #Bearish
🦈 📉
🔴 $COST REJECTION AT MAJOR RESISTANCE SIGNALS AN INSTITUTIONAL DISTRIBUTION PHASE! 📉
Target: $1,108 🚀
Stop Loss: $1,126 🛑
Price action on $COST has stalled sharply after testing upper structural bounds, leaving a heavy cluster of unfilled sell orders above. 📊 Smart money is actively rotating capital as momentum indicators confirm exhaustion on the higher timeframes. ⚡
We are eyeing a measured pullback toward the liquidity pocket below. 🔍 Are you positioning for this continuation lower or waiting for a deeper retest of the range? 💬
⚠️ Not financial advice. Always manage your risk. 🛡️
🏷️ #COST #ShortSetup #MarketStructure #Bearish
🦈 📉
Target: $1,108 🚀
Stop Loss: $1,126 🛑
Price action on $COST has stalled sharply after testing upper structural bounds, leaving a heavy cluster of unfilled sell orders above. 📊 Smart money is actively rotating capital as momentum indicators confirm exhaustion on the higher timeframes. ⚡
We are eyeing a measured pullback toward the liquidity pocket below. 🔍 Are you positioning for this continuation lower or waiting for a deeper retest of the range? 💬
⚠️ Not financial advice. Always manage your risk. 🛡️
🏷️ #COST #ShortSetup #MarketStructure #Bearish
🦈 📉
1

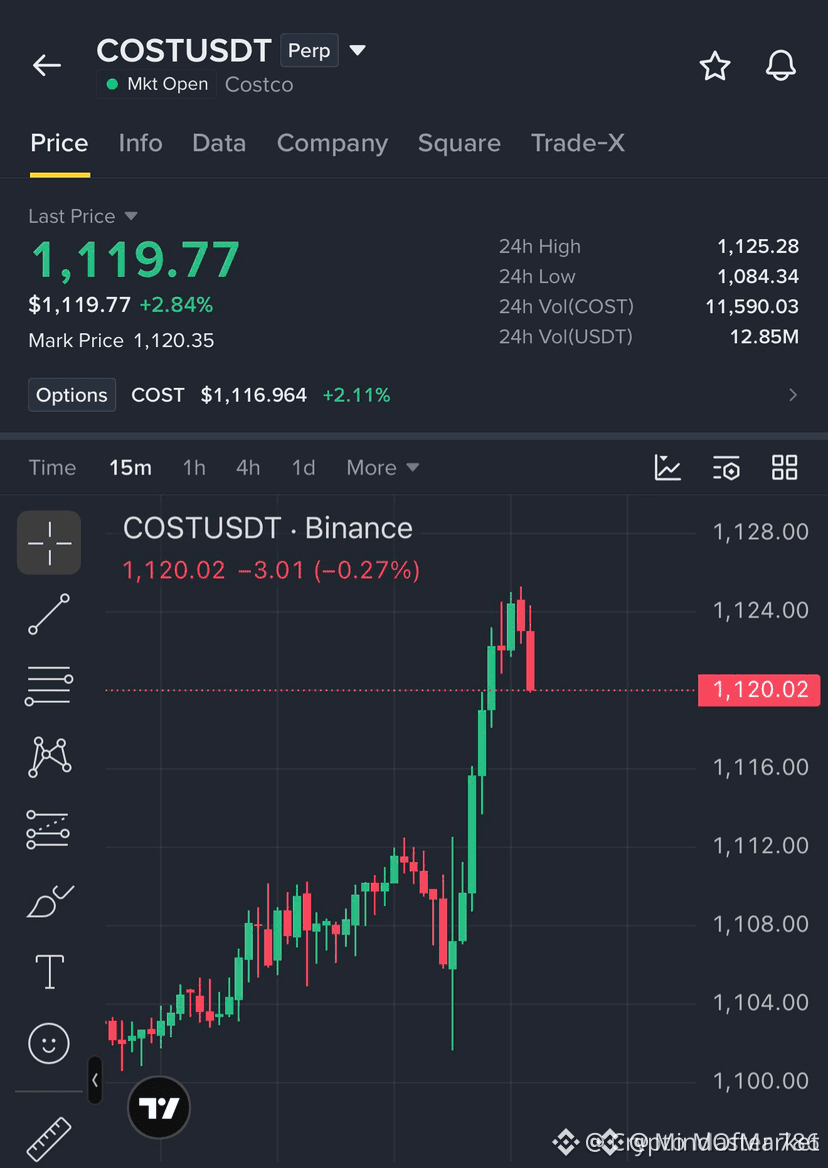
🚨 $COST HITS A HARD CEILING AFTER THE RALLY, FLIPPING BEARISH MOMENTUM! 📉
Target: $1,108 🚀
Stop Loss: $1,126 🛑
Buyers are running out of steam as parabolic momentum slams straight into a heavy distribution zone ⚡. Sellers are stepping in with aggressive order flow, punishing late longs trying to chase the extension.
The structural shift is glaring on the intraday charts as volume dries up on every minor bounce attempt 📊. Smart money is clearly positioning for a corrective pullback into lower liquidity pockets 🦈.
💬 Are you fading this exhaustion rally right now or waiting for a confirmed breakdown? 👇
⚠️ Not financial advice. Always manage your risk. 🛡️
🏷️ #COST #ShortSetup #Trading #MarketRejection
📉 🦈
🚨 $COST HITS A HARD CEILING AFTER THE RALLY, FLIPPING BEARISH MOMENTUM! 📉
Target: $1,108 🚀
Stop Loss: $1,126 🛑
Buyers are running out of steam as parabolic momentum slams straight into a heavy distribution zone ⚡. Sellers are stepping in with aggressive order flow, punishing late longs trying to chase the extension.
The structural shift is glaring on the intraday charts as volume dries up on every minor bounce attempt 📊. Smart money is clearly positioning for a corrective pullback into lower liquidity pockets 🦈.
💬 Are you fading this exhaustion rally right now or waiting for a confirmed breakdown? 👇
⚠️ Not financial advice. Always manage your risk. 🛡️
🏷️ #COST #ShortSetup #Trading #MarketRejection
📉 🦈
Target: $1,108 🚀
Stop Loss: $1,126 🛑
Buyers are running out of steam as parabolic momentum slams straight into a heavy distribution zone ⚡. Sellers are stepping in with aggressive order flow, punishing late longs trying to chase the extension.
The structural shift is glaring on the intraday charts as volume dries up on every minor bounce attempt 📊. Smart money is clearly positioning for a corrective pullback into lower liquidity pockets 🦈.
💬 Are you fading this exhaustion rally right now or waiting for a confirmed breakdown? 👇
⚠️ Not financial advice. Always manage your risk. 🛡️
🏷️ #COST #ShortSetup #Trading #MarketRejection
📉 🦈
5

·
--
$COST 4-hour bullish + daily bullish in the same direction; multi-timeframe confluence favors trading with the trend 🔥
════════════════════
🔴 $COST 4-hour bullish signal
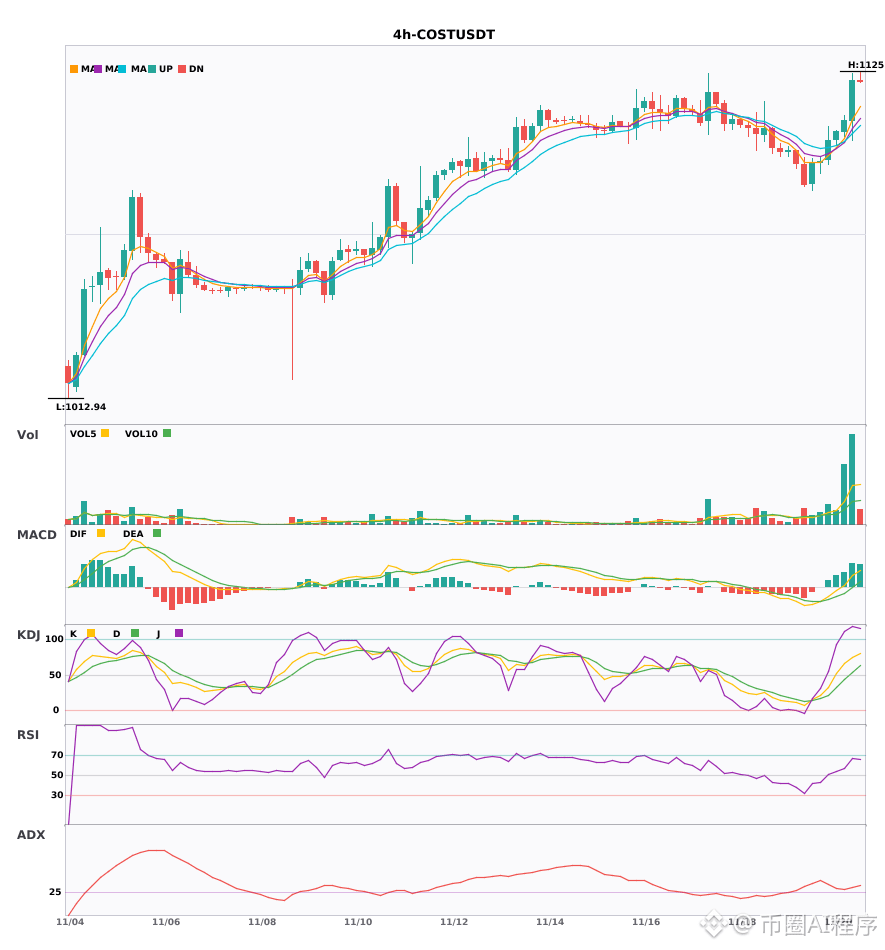
⚠️Technical analysis: Multi-timeframe confluence on the 4-hour and daily charts favors going long! The MACD histogram bars have continued to grow after the golden cross, the moving averages are in a bullish alignment and diverging upward, K has crossed above D without entering overbought territory, and trading volume has surged to 4 times its usual level. The trend is strong.
📢Market update: OpenAI has launched the GPT-Live-1.1 API, adding standby billing at $0.02 per minute (also supported by GPT-Live-1, but must be manually enabled for WebRTC sessions). Backend models and tools are billed separately.
════════════════════
🔔 Follow to get firsthand updates on market movements 🔔
#多周期共振 #COST
📌 When trading, pay attention to whether the candlestick pattern matches
$COST 4-hour bullish + daily bullish in the same direction; multi-timeframe confluence favors trading with the trend 🔥
════════════════════
🔴 $COST 4-hour bullish signal
⚠️Technical analysis: Multi-timeframe confluence on the 4-hour and daily charts favors going long! The MACD histogram bars have continued to grow after the golden cross, the moving averages are in a bullish alignment and diverging upward, K has crossed above D without entering overbought territory, and trading volume has surged to 4 times its usual level. The trend is strong.
📢Market update: OpenAI has launched the GPT-Live-1.1 API, adding standby billing at $0.02 per minute (also supported by GPT-Live-1, but must be manually enabled for WebRTC sessions). Backend models and tools are billed separately.
════════════════════
🔔 Follow to get firsthand updates on market movements 🔔
#多周期共振 #COST
📌 When trading, pay attention to whether the candlestick pattern matches
════════════════════
🔴 $COST 4-hour bullish signal
⚠️Technical analysis: Multi-timeframe confluence on the 4-hour and daily charts favors going long! The MACD histogram bars have continued to grow after the golden cross, the moving averages are in a bullish alignment and diverging upward, K has crossed above D without entering overbought territory, and trading volume has surged to 4 times its usual level. The trend is strong.
📢Market update: OpenAI has launched the GPT-Live-1.1 API, adding standby billing at $0.02 per minute (also supported by GPT-Live-1, but must be manually enabled for WebRTC sessions). Backend models and tools are billed separately.
════════════════════
🔔 Follow to get firsthand updates on market movements 🔔
#多周期共振 #COST
📌 When trading, pay attention to whether the candlestick pattern matches
10
$COST/$ELSA/$AIGENSYN 4-hour bullish confluence
📈 $COST | 4-hour bullish signal
━━━━━━━━━━━━━━━━━━
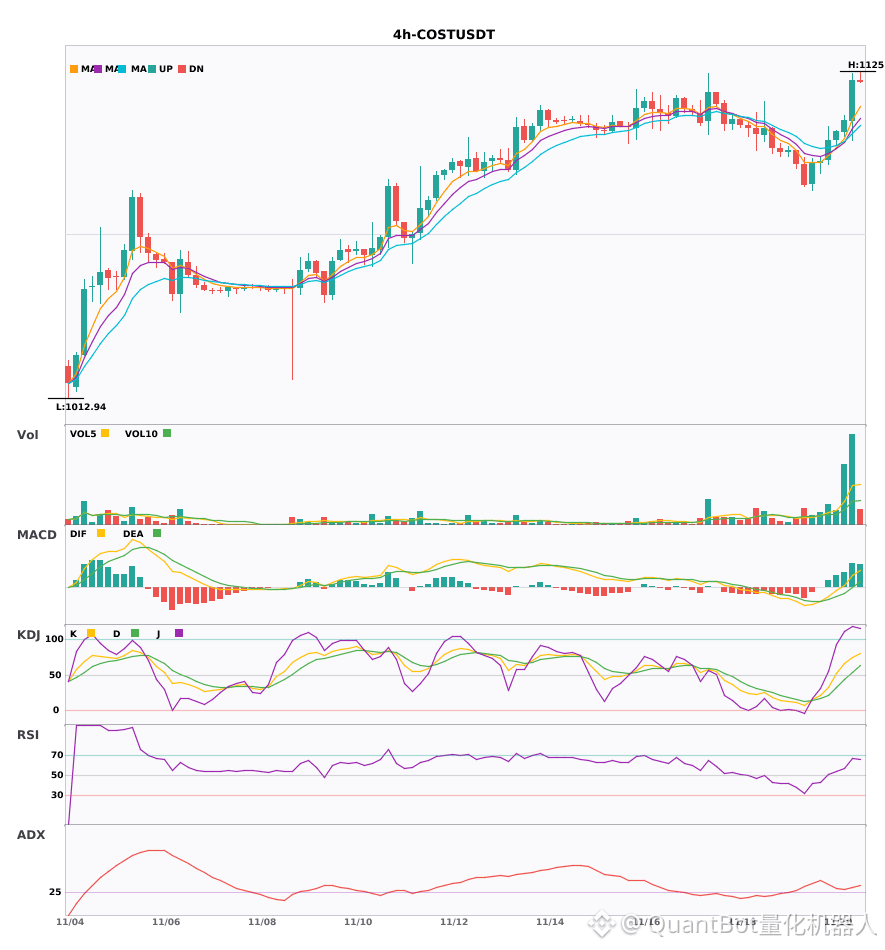
Technical analysis: ADX(34) shows a pronounced trend, MACD is bullish with strengthening momentum, EMA5>8>13 are in bullish alignment, KDJ is strong (K75.2/D54.0), and volume has surged to 4.0x.
Price change: 1.2400%
📌 Market update: OpenAI has integrated GPT-Live-1.1 into its API and introduced a $0.02-per-minute standby billing option (also available for GPT-Live-1, requiring developers to enable it in WebRTC sessions). Backend models and tools are charged separately.
📈 $ELSA | 4-hour bullish signal
━━━━━━━━━━━━━━━━━━
Technical analysis: ADX(33) indicates a pronounced trend | MACD DIF crosses above zero, turning bullish | EMA5 golden cross above EMA8, indicating a short-term bullish outlook | Volume expands to 6.0x
Price change: 12.2800%
📈 $AIGENSYN | 4-hour bullish signal
━━━━━━━━━━━━━━━━━━
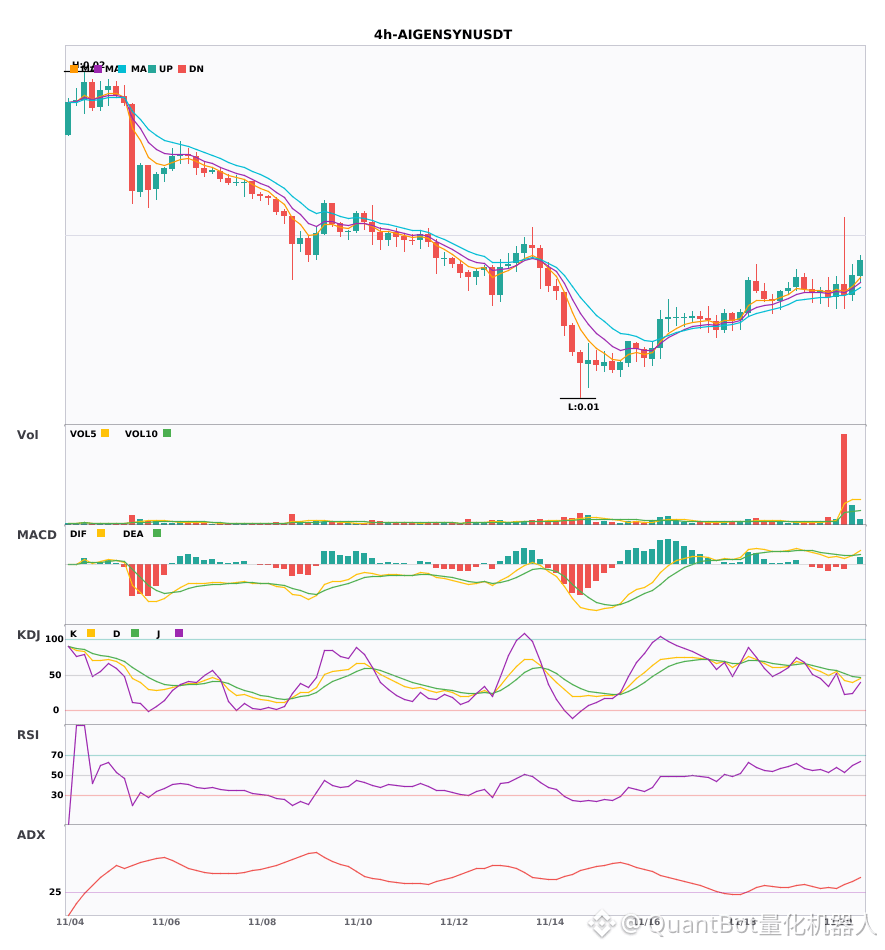
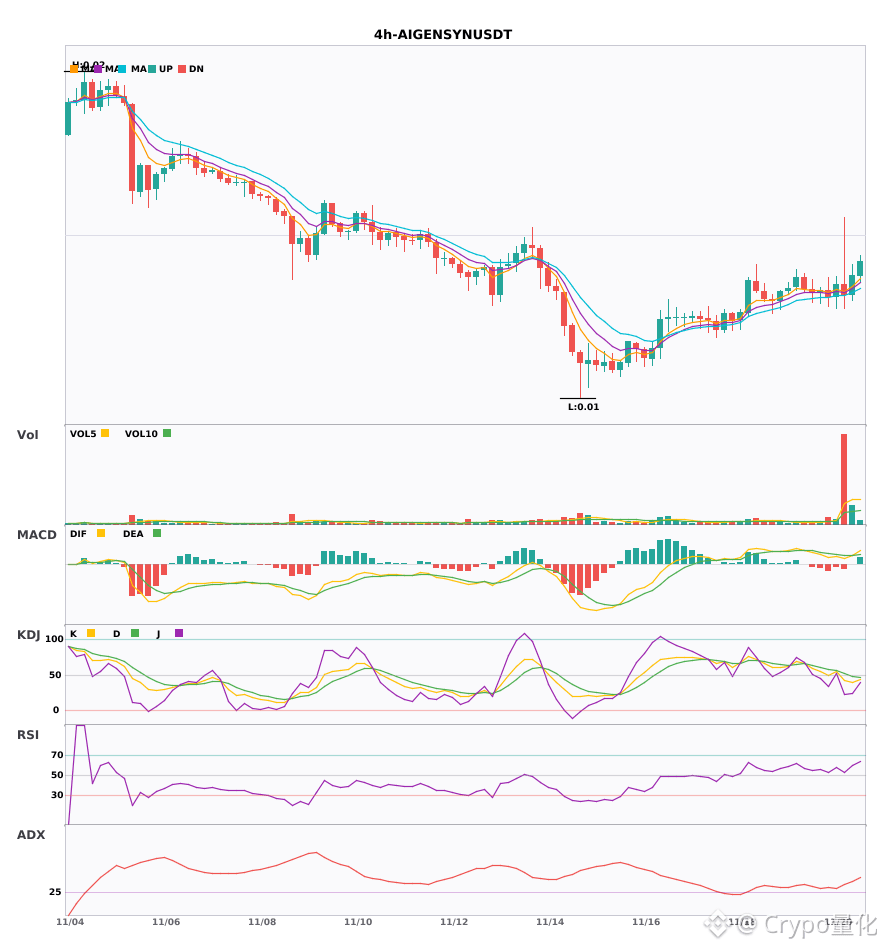
Technical analysis: ADX(40) indicates a strong trend | MACD bullish crossover above zero with momentum building | EMA5/8/13 in bullish alignment | KDJ is relatively weak (K40/D47.7) | Volume expands to 7.4x
Price change: 2.2900%
━━━━━━━━━━━━━━━━━━
#技术分析 #COST #ELSA #AIGENSYN
📌 The above is for reference only and does not constitute investment advice
$COST /$ELSA /$AIGENSYN 4-hour bullish confluence
📈 $COST | 4-hour bullish signal
━━━━━━━━━━━━━━━━━━
Technical analysis: ADX(34) shows a pronounced trend, MACD is bullish with strengthening momentum, EMA5>8>13 are in bullish alignment, KDJ is strong (K75.2/D54.0), and volume has surged to 4.0x.
Price change: 1.2400%
📌 Market update: OpenAI has integrated GPT-Live-1.1 into its API and introduced a $0.02-per-minute standby billing option (also available for GPT-Live-1, requiring developers to enable it in WebRTC sessions). Backend models and tools are charged separately.
📈 $ELSA | 4-hour bullish signal
━━━━━━━━━━━━━━━━━━
Technical analysis: ADX(33) indicates a pronounced trend | MACD DIF crosses above zero, turning bullish | EMA5 golden cross above EMA8, indicating a short-term bullish outlook | Volume expands to 6.0x
Price change: 12.2800%
📈 $AIGENSYN | 4-hour bullish signal
━━━━━━━━━━━━━━━━━━
Technical analysis: ADX(40) indicates a strong trend | MACD bullish crossover above zero with momentum building | EMA5/8/13 in bullish alignment | KDJ is relatively weak (K40/D47.7) | Volume expands to 7.4x
Price change: 2.2900%
━━━━━━━━━━━━━━━━━━
#技术分析 #COST #ELSA #AIGENSYN
📌 The above is for reference only and does not constitute investment advice
📈 $COST | 4-hour bullish signal
━━━━━━━━━━━━━━━━━━
Technical analysis: ADX(34) shows a pronounced trend, MACD is bullish with strengthening momentum, EMA5>8>13 are in bullish alignment, KDJ is strong (K75.2/D54.0), and volume has surged to 4.0x.
Price change: 1.2400%
📌 Market update: OpenAI has integrated GPT-Live-1.1 into its API and introduced a $0.02-per-minute standby billing option (also available for GPT-Live-1, requiring developers to enable it in WebRTC sessions). Backend models and tools are charged separately.
📈 $ELSA | 4-hour bullish signal
━━━━━━━━━━━━━━━━━━
Technical analysis: ADX(33) indicates a pronounced trend | MACD DIF crosses above zero, turning bullish | EMA5 golden cross above EMA8, indicating a short-term bullish outlook | Volume expands to 6.0x
Price change: 12.2800%
📈 $AIGENSYN | 4-hour bullish signal
━━━━━━━━━━━━━━━━━━
Technical analysis: ADX(40) indicates a strong trend | MACD bullish crossover above zero with momentum building | EMA5/8/13 in bullish alignment | KDJ is relatively weak (K40/D47.7) | Volume expands to 7.4x
Price change: 2.2900%
━━━━━━━━━━━━━━━━━━
#技术分析 #COST #ELSA #AIGENSYN
📌 The above is for reference only and does not constitute investment advice
26
·
--
4-hour bullish signals for three coins at once: $COST $ELSA $AIGENSYN🔥
════════════════════
🔴 $COST 4-hour bullish signal
⚠️Technical analysis: The trend is clear. After the MACD golden cross, trading volume increased. The moving averages are aligned bullishly and diverging upward. K has crossed above D on the KDJ without entering overbought territory. Trading volume is up 4x, favoring the bulls.
📢Market update: OpenAI launched the GPT-Live-1.1 API, adding a $0.02-per-minute standby option. This also applies to GPT-Live-1, and developers must enable it manually for WebRTC sessions. Backend models and tools are billed separately.
════════════════════
🔴 $ELSA 4-hour bullish signal
⚠️Technical analysis: ADX at 33 indicates a very clear trend. The MACD golden cross came with rising volume, and DIF crossed above the zero line, turning bullish. EMA5 has just crossed above EMA8, forming a bullish alignment. Trading volume surged 6x.
════════════════════
🔴 $AIGENSYN 4-hour bullish signal
⚠️Technical analysis: ADX is strengthening, and the trend is clear. The MACD formed a golden cross above zero with rising volume, and the moving averages have just formed a bullish alignment, diverging upward. However, KDJ is weak, with K below D, though fortunately it is not overbought. Trading volume surged more than 7x.
════════════════════
🔔 Follow to get first-hand updates on market movements 🔔
#技术分析 #COST #ELSA #AIGENSYN
📌 When trading, pay attention to whether the candlestick pattern meets expectations
4-hour bullish signals for three coins at once: $COST $ELSA $AIGENSYN 🔥
════════════════════
🔴 $COST 4-hour bullish signal
⚠️Technical analysis: The trend is clear. After the MACD golden cross, trading volume increased. The moving averages are aligned bullishly and diverging upward. K has crossed above D on the KDJ without entering overbought territory. Trading volume is up 4x, favoring the bulls.
📢Market update: OpenAI launched the GPT-Live-1.1 API, adding a $0.02-per-minute standby option. This also applies to GPT-Live-1, and developers must enable it manually for WebRTC sessions. Backend models and tools are billed separately.
════════════════════
🔴 $ELSA 4-hour bullish signal
⚠️Technical analysis: ADX at 33 indicates a very clear trend. The MACD golden cross came with rising volume, and DIF crossed above the zero line, turning bullish. EMA5 has just crossed above EMA8, forming a bullish alignment. Trading volume surged 6x.
════════════════════
🔴 $AIGENSYN 4-hour bullish signal
⚠️Technical analysis: ADX is strengthening, and the trend is clear. The MACD formed a golden cross above zero with rising volume, and the moving averages have just formed a bullish alignment, diverging upward. However, KDJ is weak, with K below D, though fortunately it is not overbought. Trading volume surged more than 7x.
════════════════════
🔔 Follow to get first-hand updates on market movements 🔔
#技术分析 #COST #ELSA #AIGENSYN
📌 When trading, pay attention to whether the candlestick pattern meets expectations
════════════════════
🔴 $COST 4-hour bullish signal
⚠️Technical analysis: The trend is clear. After the MACD golden cross, trading volume increased. The moving averages are aligned bullishly and diverging upward. K has crossed above D on the KDJ without entering overbought territory. Trading volume is up 4x, favoring the bulls.
📢Market update: OpenAI launched the GPT-Live-1.1 API, adding a $0.02-per-minute standby option. This also applies to GPT-Live-1, and developers must enable it manually for WebRTC sessions. Backend models and tools are billed separately.
════════════════════
🔴 $ELSA 4-hour bullish signal
⚠️Technical analysis: ADX at 33 indicates a very clear trend. The MACD golden cross came with rising volume, and DIF crossed above the zero line, turning bullish. EMA5 has just crossed above EMA8, forming a bullish alignment. Trading volume surged 6x.
════════════════════
🔴 $AIGENSYN 4-hour bullish signal
⚠️Technical analysis: ADX is strengthening, and the trend is clear. The MACD formed a golden cross above zero with rising volume, and the moving averages have just formed a bullish alignment, diverging upward. However, KDJ is weak, with K below D, though fortunately it is not overbought. Trading volume surged more than 7x.
════════════════════
🔔 Follow to get first-hand updates on market movements 🔔
#技术分析 #COST #ELSA #AIGENSYN
📌 When trading, pay attention to whether the candlestick pattern meets expectations
24

·
--
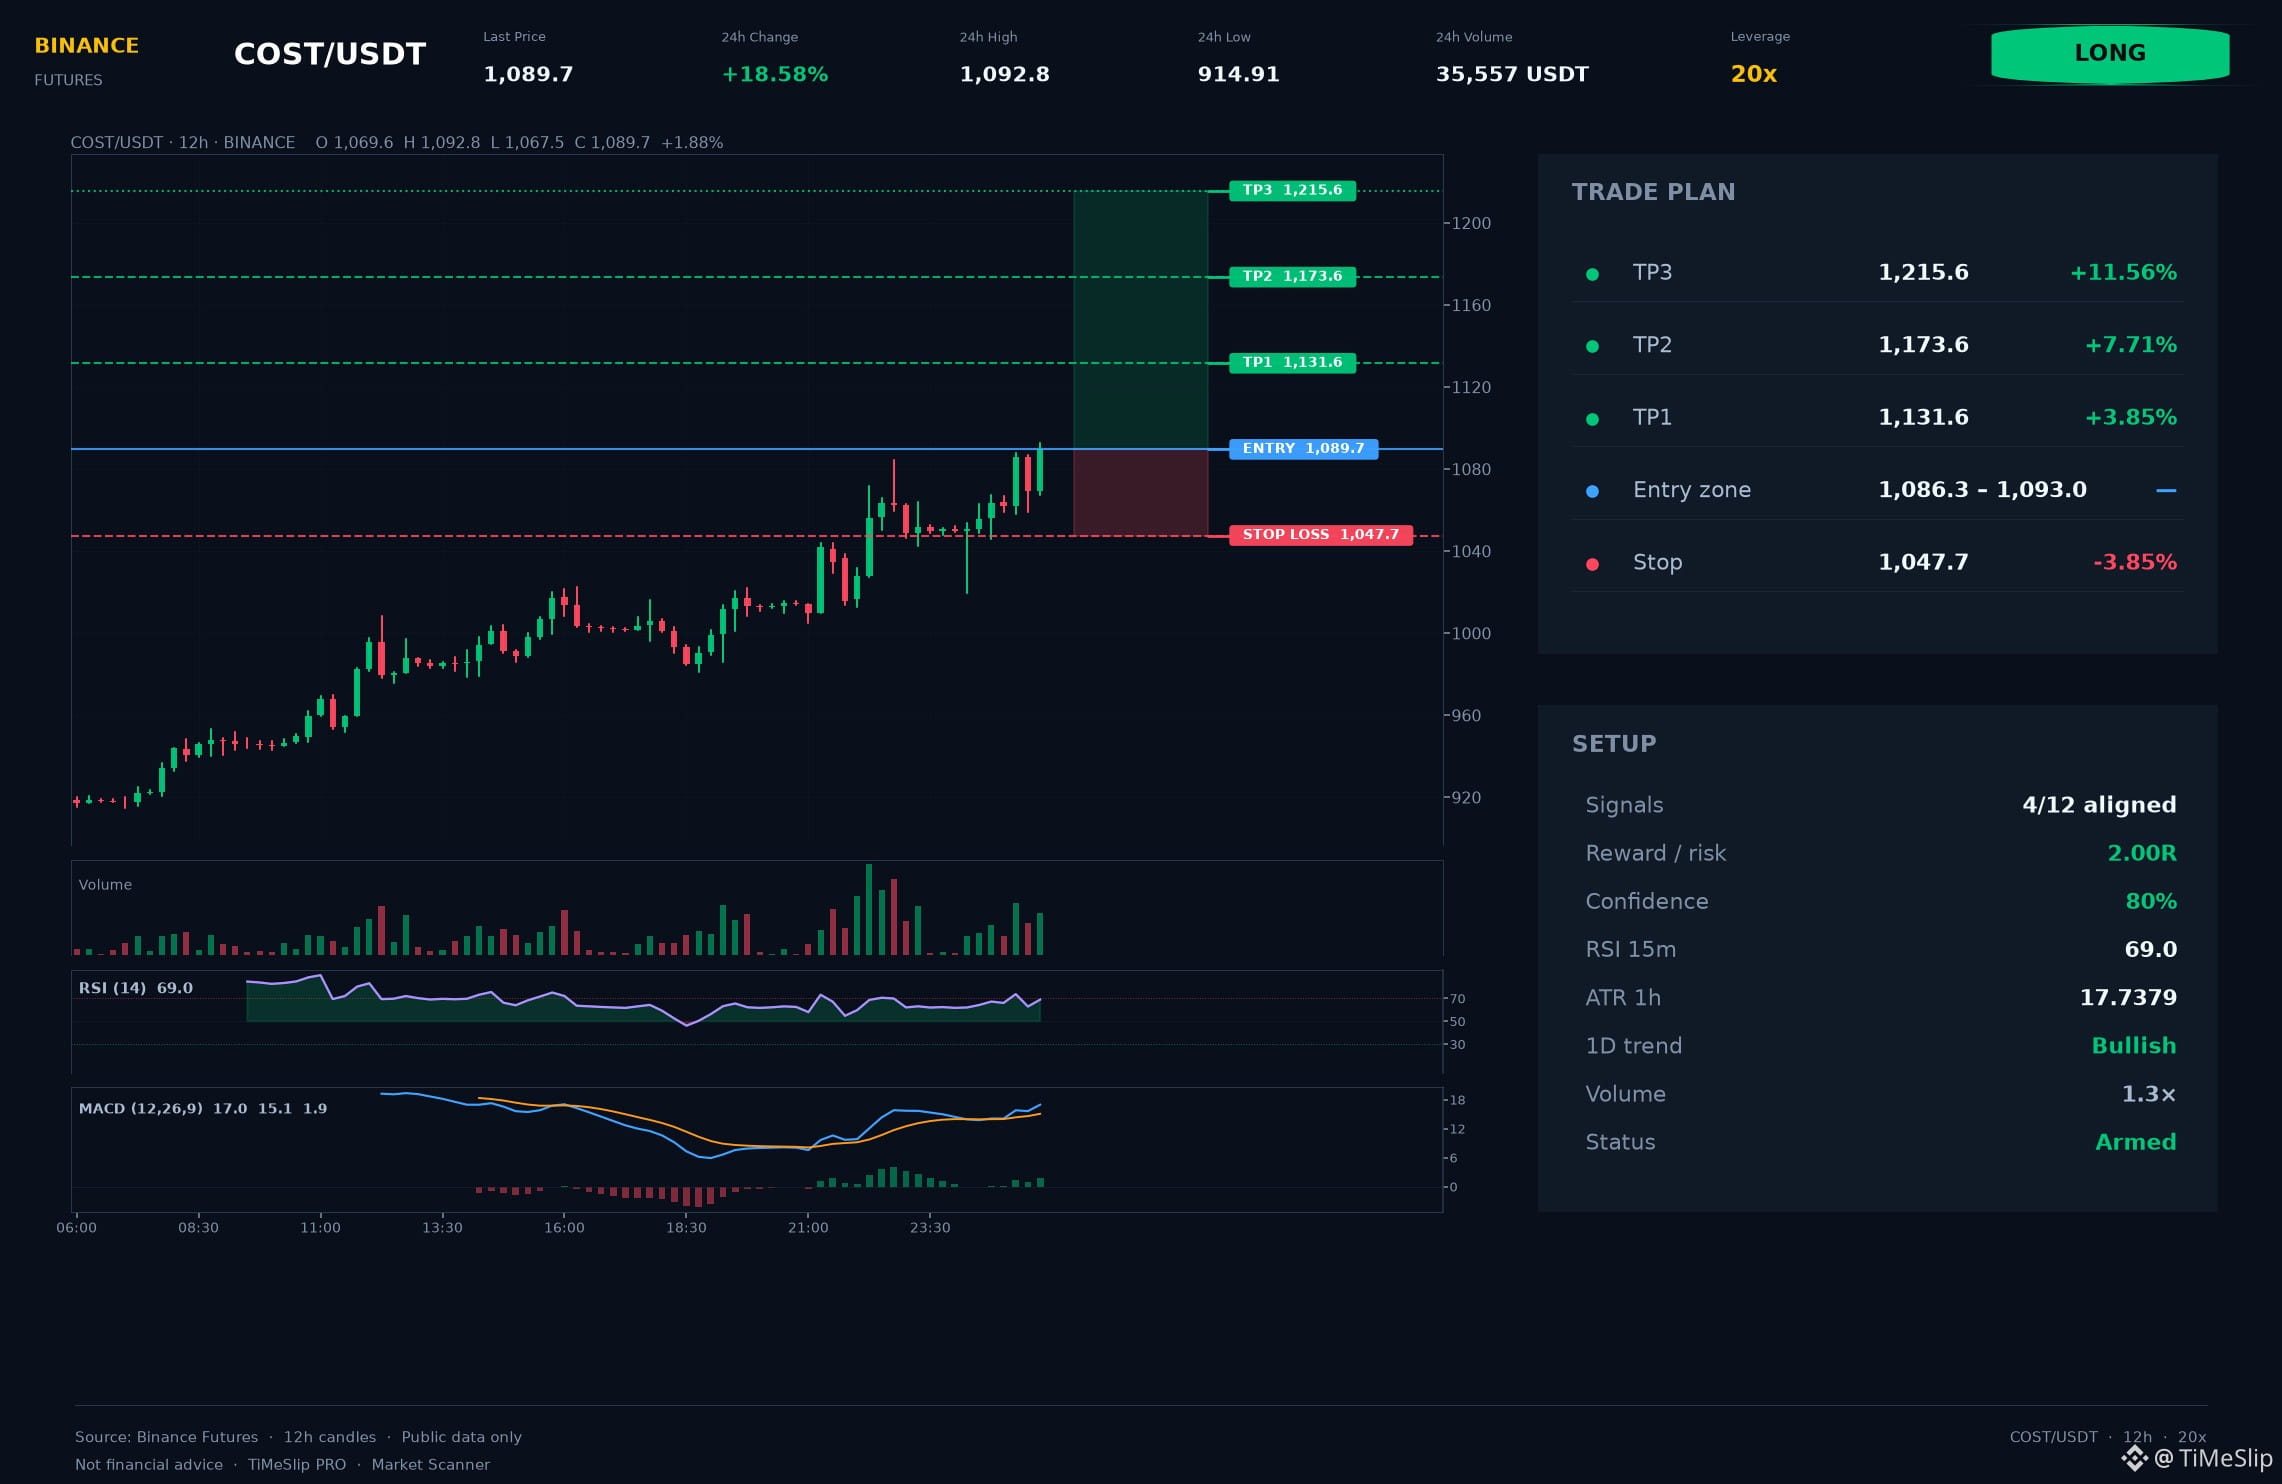
$COST 🟢 (Long Position)
Entry: 1089.66
Stop Loss: 1047.68
• Take Profit 1: 1131.64
• Take Profit 2: 1173.62
• Take Profit 3: 1215.60
🎯 Golden Rule: After reaching TP1, move the stop loss to breakeven to protect your capital.
COST buyers have a technical opportunity. Assess the trade based on whether key levels hold, rather than on your initial reaction.
Pattern quality: 80/100. Please manage your position strictly. ⚡ Moderate risk (3.85%): Please stay disciplined.
📚 Order Flow: Order book imbalance -18.8%; aggressive buying 53.1%. Current chart: direction unclear.
Price broke above the key level of 1084.40, with the retest confirmed by a closing candle. Stop-loss risk: 3.85%. Timeframe confluence: 4h, 8h, 1d, 1w. ATR(14): 17.738.
Volume is within the normal range (1.3×).
🔔 Subscribe to stay on top of key moves in the crypto market!
For educational and informational purposes only. The author is not responsible for trading results.
#COST #COSTNews $COST 👈 Click to trade
$COST 🟢 (Long Position)
Entry: 1089.66
Stop Loss: 1047.68
• Take Profit 1: 1131.64
• Take Profit 2: 1173.62
• Take Profit 3: 1215.60
🎯 Golden Rule: After reaching TP1, move the stop loss to breakeven to protect your capital.
COST buyers have a technical opportunity. Assess the trade based on whether key levels hold, rather than on your initial reaction.
Pattern quality: 80/100. Please manage your position strictly. ⚡ Moderate risk (3.85%): Please stay disciplined.
📚 Order Flow: Order book imbalance -18.8%; aggressive buying 53.1%. Current chart: direction unclear.
Price broke above the key level of 1084.40, with the retest confirmed by a closing candle. Stop-loss risk: 3.85%. Timeframe confluence: 4h, 8h, 1d, 1w. ATR(14): 17.738.
Volume is within the normal range (1.3×).
🔔 Subscribe to stay on top of key moves in the crypto market!
For educational and informational purposes only. The author is not responsible for trading results.
#COST #COSTNews $COST 👈 Click to trade
Entry: 1089.66
Stop Loss: 1047.68
• Take Profit 1: 1131.64
• Take Profit 2: 1173.62
• Take Profit 3: 1215.60
🎯 Golden Rule: After reaching TP1, move the stop loss to breakeven to protect your capital.
COST buyers have a technical opportunity. Assess the trade based on whether key levels hold, rather than on your initial reaction.
Pattern quality: 80/100. Please manage your position strictly. ⚡ Moderate risk (3.85%): Please stay disciplined.
📚 Order Flow: Order book imbalance -18.8%; aggressive buying 53.1%. Current chart: direction unclear.
Price broke above the key level of 1084.40, with the retest confirmed by a closing candle. Stop-loss risk: 3.85%. Timeframe confluence: 4h, 8h, 1d, 1w. ATR(14): 17.738.
Volume is within the normal range (1.3×).
🔔 Subscribe to stay on top of key moves in the crypto market!
For educational and informational purposes only. The author is not responsible for trading results.
#COST #COSTNews $COST 👈 Click to trade
45
·
--
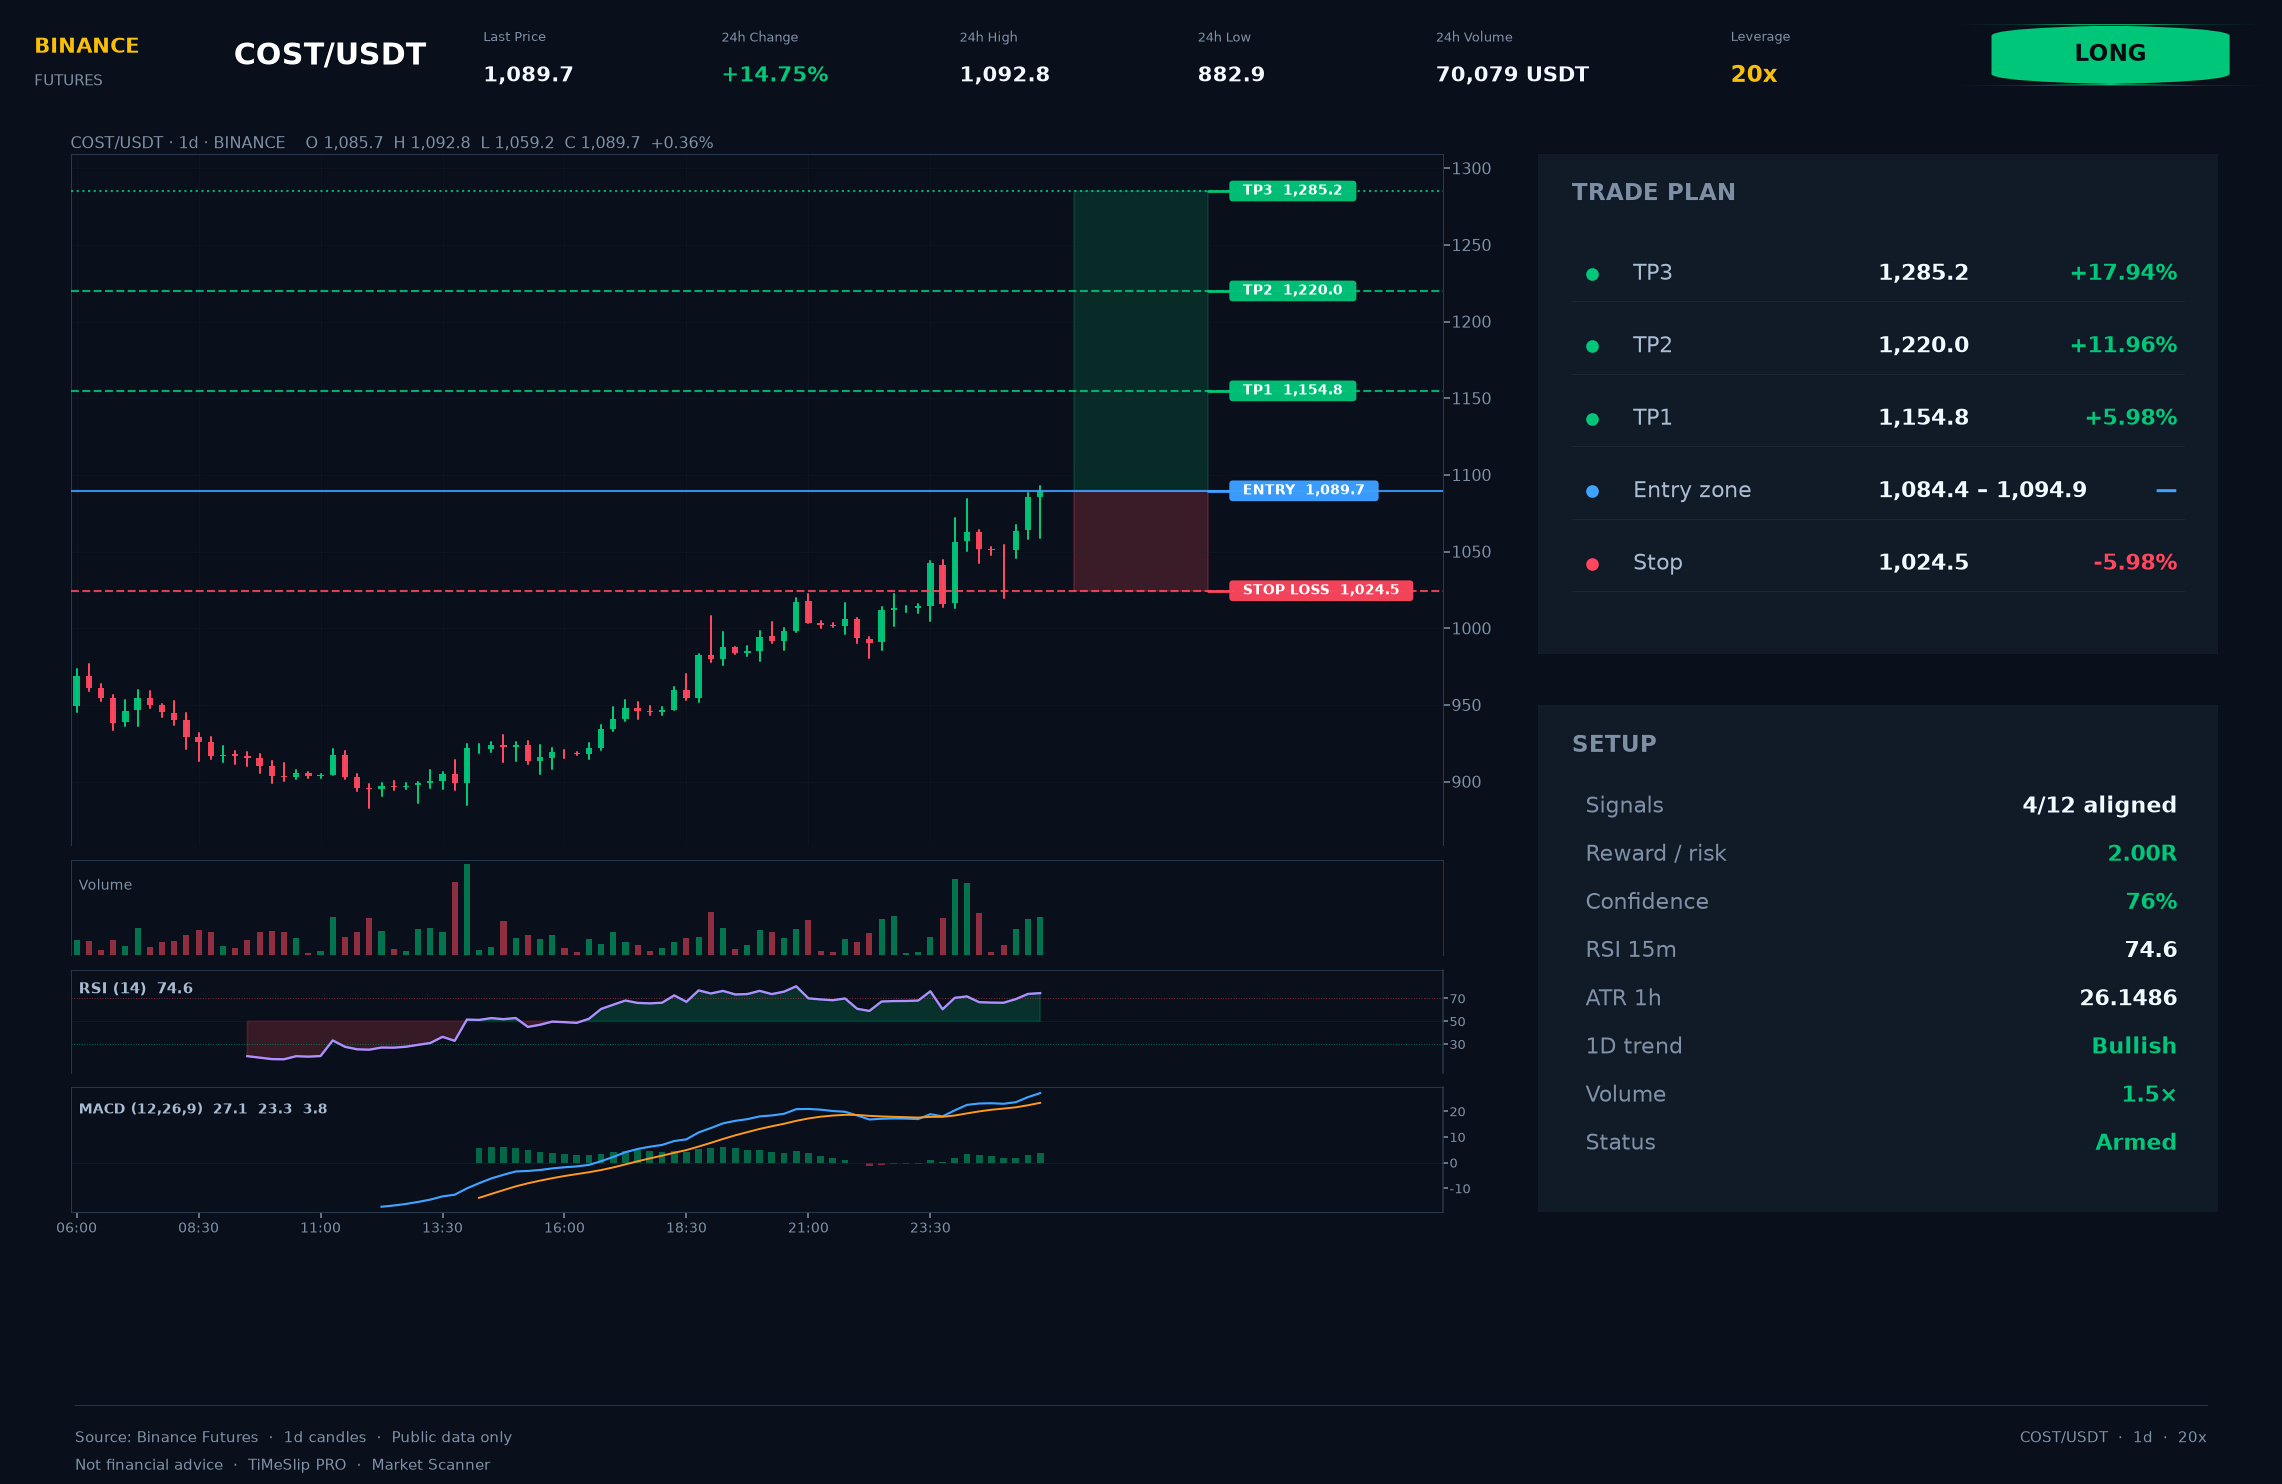
$COST 🟢 (BUY)
ENTRY: 1089.66
STOP: 1024.50
• TP1: 1154.82
• TP2: 1219.99
• TP3: 1285.15
🎯 Golden rule: take TP1 and then move the stop to break-even to protect your capital.
On COST (1d), I see a cautious long: after the retest, the level must hold for the continuation.
The price broke the key level at 1084.40, with a confirmed retest on the closed candle. Risk to stop: 5.98%. TF alignment: 4h, 8h, 12h, 1w. ATR(14): 26.149.
Volume slightly above normal (1.5×).
Technical setup rating — 76/100. This is a structure/risk calculation, not a guarantee of profit. ⚠️ High risk to stop (5.98%): reduce your position size.
📚 Order Flow: order book imbalance -18.8%; aggressive buying 53.1%. Based on these data, the flow is mixed and has no clear direction.
🚀 Join the trader community — more actionable ideas ahead!
No strategy guarantees 100% profit. Manage your margin and position size.
#COST #COSTNews $COST 👈 Tap to trade
$COST 🟢 (BUY)
ENTRY: 1089.66
STOP: 1024.50
• TP1: 1154.82
• TP2: 1219.99
• TP3: 1285.15
🎯 Golden rule: take TP1 and then move the stop to break-even to protect your capital.
On COST (1d), I see a cautious long: after the retest, the level must hold for the continuation.
The price broke the key level at 1084.40, with a confirmed retest on the closed candle. Risk to stop: 5.98%. TF alignment: 4h, 8h, 12h, 1w. ATR(14): 26.149.
Volume slightly above normal (1.5×).
Technical setup rating — 76/100. This is a structure/risk calculation, not a guarantee of profit. ⚠️ High risk to stop (5.98%): reduce your position size.
📚 Order Flow: order book imbalance -18.8%; aggressive buying 53.1%. Based on these data, the flow is mixed and has no clear direction.
🚀 Join the trader community — more actionable ideas ahead!
No strategy guarantees 100% profit. Manage your margin and position size.
#COST #COSTNews $COST 👈 Tap to trade
ENTRY: 1089.66
STOP: 1024.50
• TP1: 1154.82
• TP2: 1219.99
• TP3: 1285.15
🎯 Golden rule: take TP1 and then move the stop to break-even to protect your capital.
On COST (1d), I see a cautious long: after the retest, the level must hold for the continuation.
The price broke the key level at 1084.40, with a confirmed retest on the closed candle. Risk to stop: 5.98%. TF alignment: 4h, 8h, 12h, 1w. ATR(14): 26.149.
Volume slightly above normal (1.5×).
Technical setup rating — 76/100. This is a structure/risk calculation, not a guarantee of profit. ⚠️ High risk to stop (5.98%): reduce your position size.
📚 Order Flow: order book imbalance -18.8%; aggressive buying 53.1%. Based on these data, the flow is mixed and has no clear direction.
🚀 Join the trader community — more actionable ideas ahead!
No strategy guarantees 100% profit. Manage your margin and position size.
#COST #COSTNews $COST 👈 Tap to trade
62

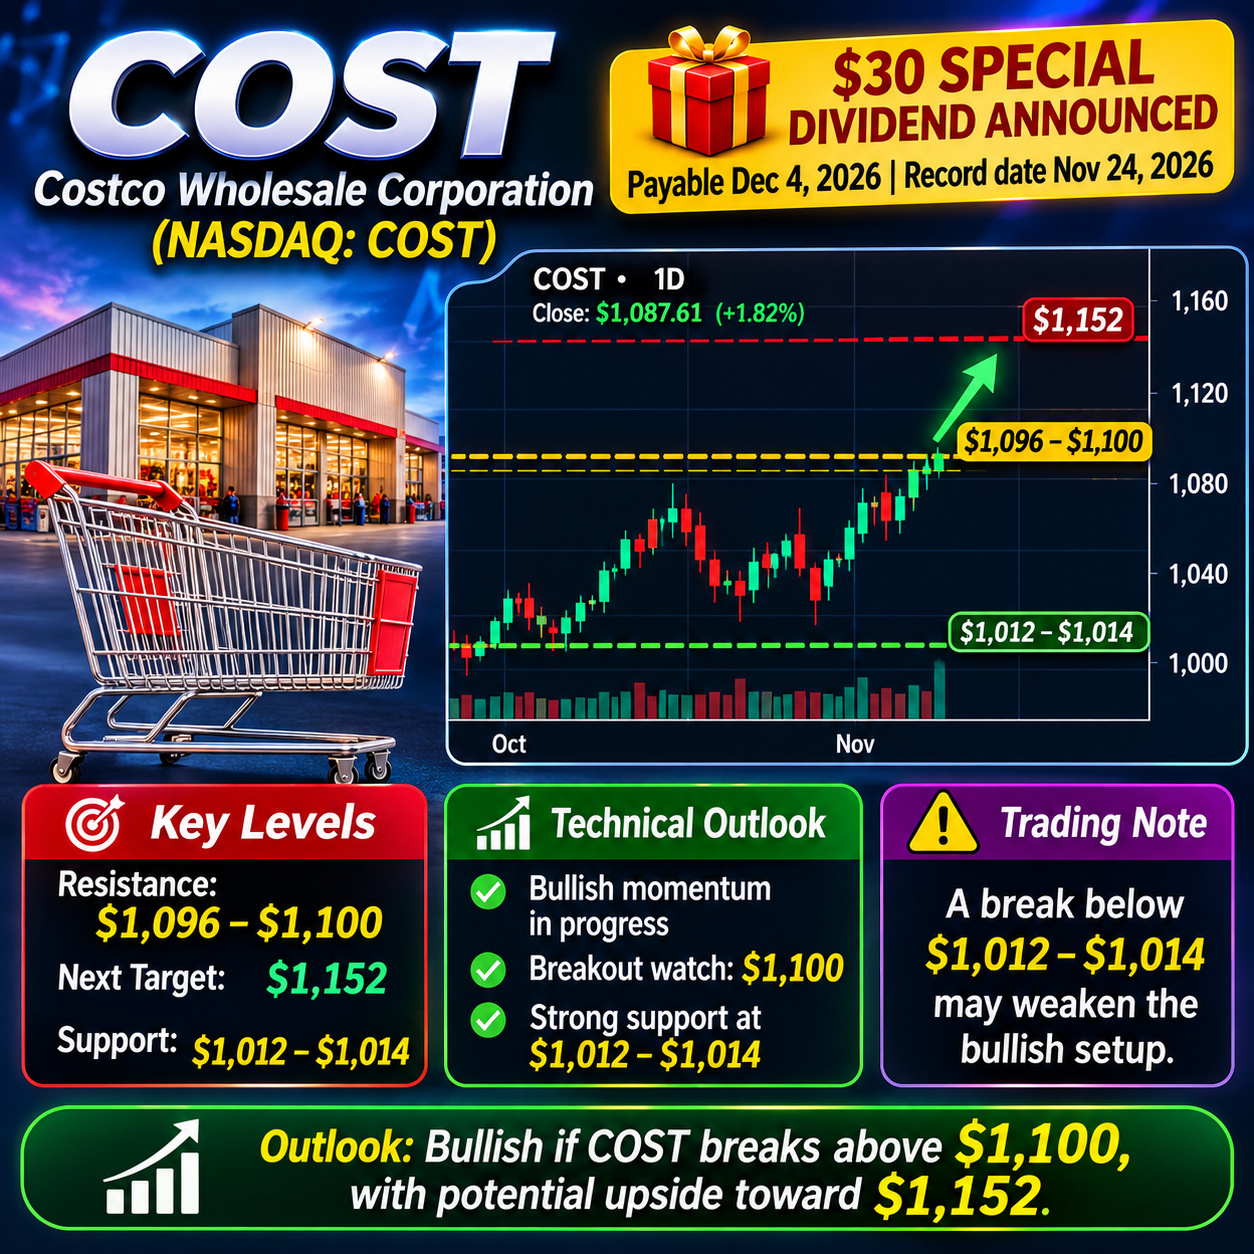
🚀 $COST (Costco) – Bullish Momentum Building!
Costco shares are showing positive momentum, approaching the $1,100 resistance zone. A successful breakout could push the stock toward $1,152.
💰 Major Catalyst: Costco announced a $30 special dividend per share, payable December 4, 2026.
📊 Trading Strategy: Watch for a confirmed breakout above $1,100. Monitor support around $1,012–$1,014 and manage risk carefully.
🔥 Can COST reach $1,152 next?
#COST #stockmarketnews #AnthropicRejectsIPODelayValuationinQuestion
🚀 $COST (Costco) – Bullish Momentum Building!
Costco shares are showing positive momentum, approaching the $1,100 resistance zone. A successful breakout could push the stock toward $1,152.
💰 Major Catalyst: Costco announced a $30 special dividend per share, payable December 4, 2026.
📊 Trading Strategy: Watch for a confirmed breakout above $1,100. Monitor support around $1,012–$1,014 and manage risk carefully.
🔥 Can COST reach $1,152 next?
#COST #stockmarketnews #AnthropicRejectsIPODelayValuationinQuestion
Costco shares are showing positive momentum, approaching the $1,100 resistance zone. A successful breakout could push the stock toward $1,152.
💰 Major Catalyst: Costco announced a $30 special dividend per share, payable December 4, 2026.
📊 Trading Strategy: Watch for a confirmed breakout above $1,100. Monitor support around $1,012–$1,014 and manage risk carefully.
🔥 Can COST reach $1,152 next?
#COST #stockmarketnews #AnthropicRejectsIPODelayValuationinQuestion
149
·
--
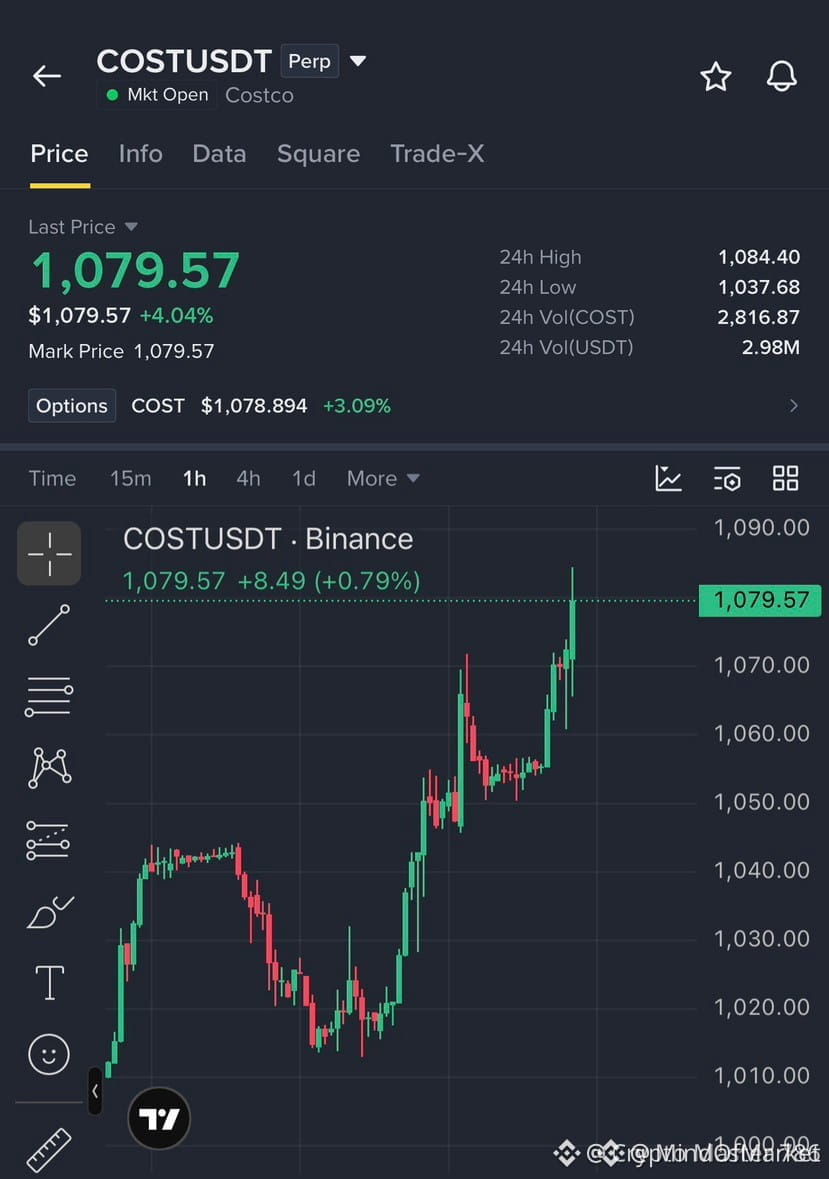
🚀 $COST BREAKS $1,070, EYES $1,100 BULL RUN! 📈
Entry: 1,075 ⚡
Target: 1,100 🚀
Stop Loss: 1,065 ⚠️
The market absorbed the $1,070 barrier cleanly, confirming a bullish order block that held three consecutive tests. 📊 Volume on the 4‑hour chart surged past the 20‑period average, indicating smart‑money accumulation.
With price now flirting with the $1,084 resistance cluster, a decisive close above it would trigger the next liquidity pool around $1,100. 🦈 Keep an eye on the $1,065 floor as the stop‑loss; a break below would suggest a swift liquidity hunt.
💬 Are you positioning for the $1,100 target or waiting for the next confirmation? 👇
⚠️ Not financial advice. Always manage your risk. 🛡️
🏷️ #COST #LongSetup #Breakout #Crypto
🔥 💎
🚀 $COST BREAKS $1,070, EYES $1,100 BULL RUN! 📈
Entry: 1,075 ⚡
Target: 1,100 🚀
Stop Loss: 1,065 ⚠️
The market absorbed the $1,070 barrier cleanly, confirming a bullish order block that held three consecutive tests. 📊 Volume on the 4‑hour chart surged past the 20‑period average, indicating smart‑money accumulation.
With price now flirting with the $1,084 resistance cluster, a decisive close above it would trigger the next liquidity pool around $1,100. 🦈 Keep an eye on the $1,065 floor as the stop‑loss; a break below would suggest a swift liquidity hunt.
💬 Are you positioning for the $1,100 target or waiting for the next confirmation? 👇
⚠️ Not financial advice. Always manage your risk. 🛡️
🏷️ #COST #LongSetup #Breakout #Crypto
🔥 💎
Entry: 1,075 ⚡
Target: 1,100 🚀
Stop Loss: 1,065 ⚠️
The market absorbed the $1,070 barrier cleanly, confirming a bullish order block that held three consecutive tests. 📊 Volume on the 4‑hour chart surged past the 20‑period average, indicating smart‑money accumulation.
With price now flirting with the $1,084 resistance cluster, a decisive close above it would trigger the next liquidity pool around $1,100. 🦈 Keep an eye on the $1,065 floor as the stop‑loss; a break below would suggest a swift liquidity hunt.
💬 Are you positioning for the $1,100 target or waiting for the next confirmation? 👇
⚠️ Not financial advice. Always manage your risk. 🛡️
🏷️ #COST #LongSetup #Breakout #Crypto
🔥 💎
5

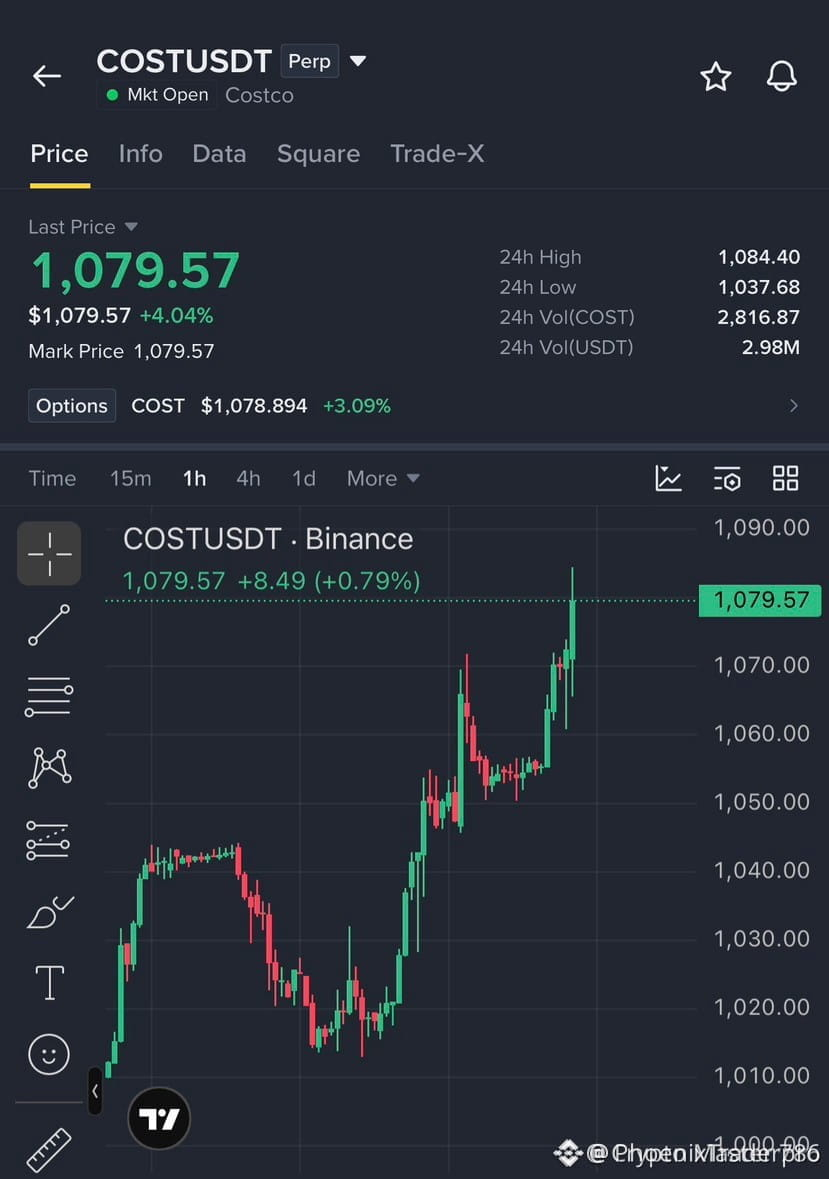
🚀 $COST BREAKS $1,070, AIMING FOR $1,100 RALLY! 📈
Entry: $1,075‑$1,080 ⚡
Target: $1,085 / $1,095 / $1,100 🚀
Stop Loss: $1,065 ⚠️
Smart money is flipping the script as $COST punches through the $1,070 ceiling, swallowing the sell wall with aggressive buying. 📊 The order flow shows a clean sweep of liquidity, and the next barrier at $1,084 is trembling.
If the breakout holds, the price trajectory points straight to the $1,100 milestone, a classic upside thrust that mirrors last month’s surge. 🦈 Keep eyes on volume spikes and the bullish divergence on the 4‑hour RSI.
💬 Are you loading your bids into the $1,075‑$1,080 entry band or waiting for the next liquidity test? 👇
⚠️ Not financial advice. Always manage your risk. 🛡️
🏷️ #COST #LongSetup #Breakout #Momentum
🔥 💎
🚀 $COST BREAKS $1,070, AIMING FOR $1,100 RALLY! 📈
Entry: $1,075‑$1,080 ⚡
Target: $1,085 / $1,095 / $1,100 🚀
Stop Loss: $1,065 ⚠️
Smart money is flipping the script as $COST punches through the $1,070 ceiling, swallowing the sell wall with aggressive buying. 📊 The order flow shows a clean sweep of liquidity, and the next barrier at $1,084 is trembling.
If the breakout holds, the price trajectory points straight to the $1,100 milestone, a classic upside thrust that mirrors last month’s surge. 🦈 Keep eyes on volume spikes and the bullish divergence on the 4‑hour RSI.
💬 Are you loading your bids into the $1,075‑$1,080 entry band or waiting for the next liquidity test? 👇
⚠️ Not financial advice. Always manage your risk. 🛡️
🏷️ #COST #LongSetup #Breakout #Momentum
🔥 💎
Entry: $1,075‑$1,080 ⚡
Target: $1,085 / $1,095 / $1,100 🚀
Stop Loss: $1,065 ⚠️
Smart money is flipping the script as $COST punches through the $1,070 ceiling, swallowing the sell wall with aggressive buying. 📊 The order flow shows a clean sweep of liquidity, and the next barrier at $1,084 is trembling.
If the breakout holds, the price trajectory points straight to the $1,100 milestone, a classic upside thrust that mirrors last month’s surge. 🦈 Keep eyes on volume spikes and the bullish divergence on the 4‑hour RSI.
💬 Are you loading your bids into the $1,075‑$1,080 entry band or waiting for the next liquidity test? 👇
⚠️ Not financial advice. Always manage your risk. 🛡️
🏷️ #COST #LongSetup #Breakout #Momentum
🔥 💎
26

·
--
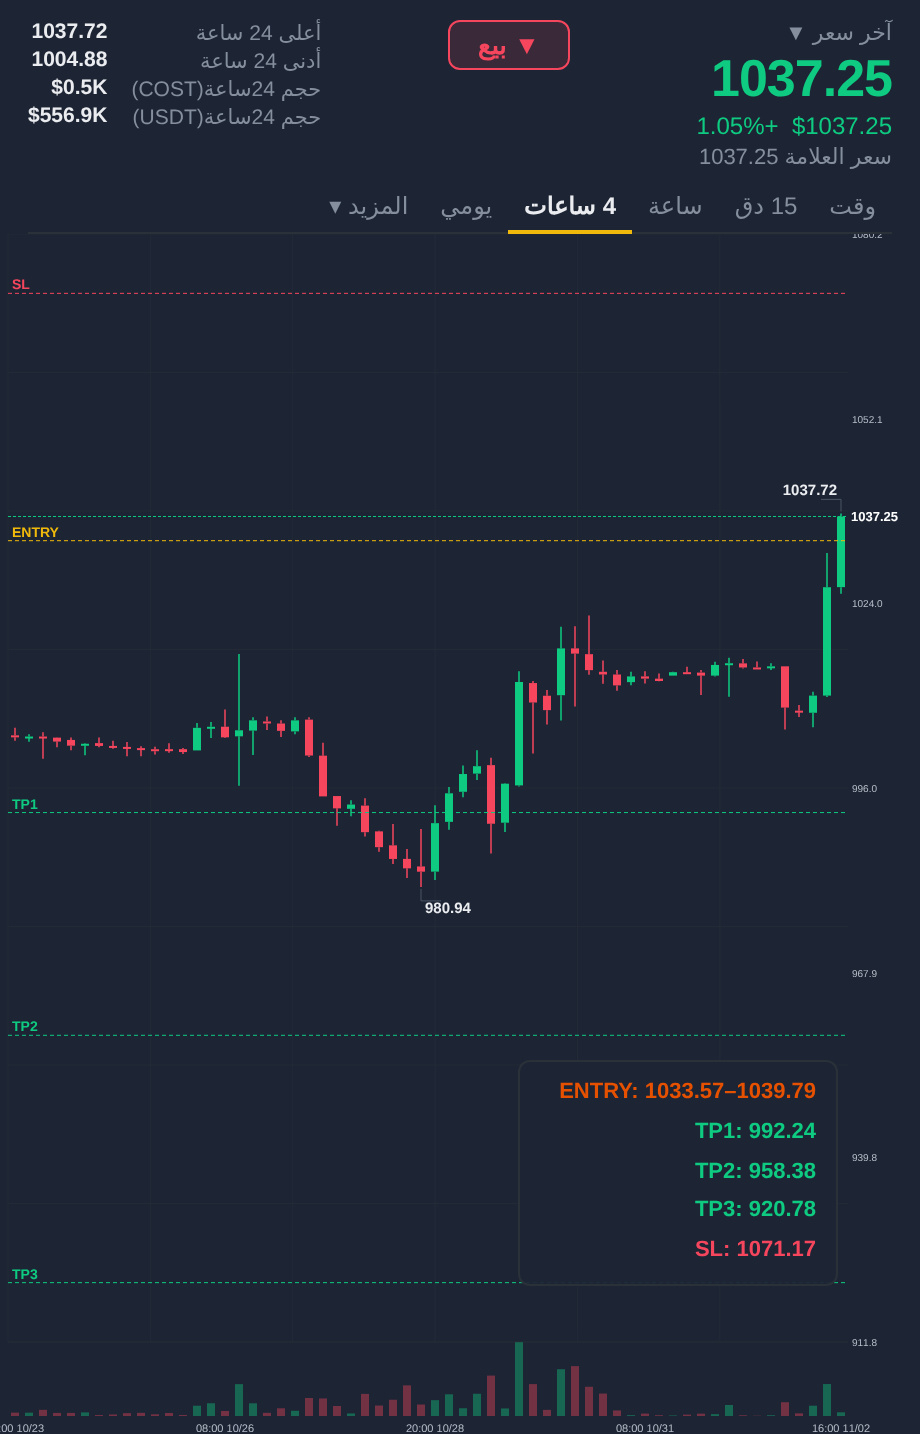
I just opened a quick sell trade on $COST
Entry: Short $1,034 – $1,040
First target: $992.24
Second: $958.38
Final: $920.78
Stop loss above $1,071
RSI 82
#COST #SI #DACITYCOIN
Trade $COST now
I just opened a quick sell trade on $COST
Entry: Short $1,034 – $1,040
First target: $992.24
Second: $958.38
Final: $920.78
Stop loss above $1,071
RSI 82
#COST #SI #DACITYCOIN
Trade $COST now
Entry: Short $1,034 – $1,040
First target: $992.24
Second: $958.38
Final: $920.78
Stop loss above $1,071
RSI 82
#COST #SI #DACITYCOIN
Trade $COST now
132

·
--
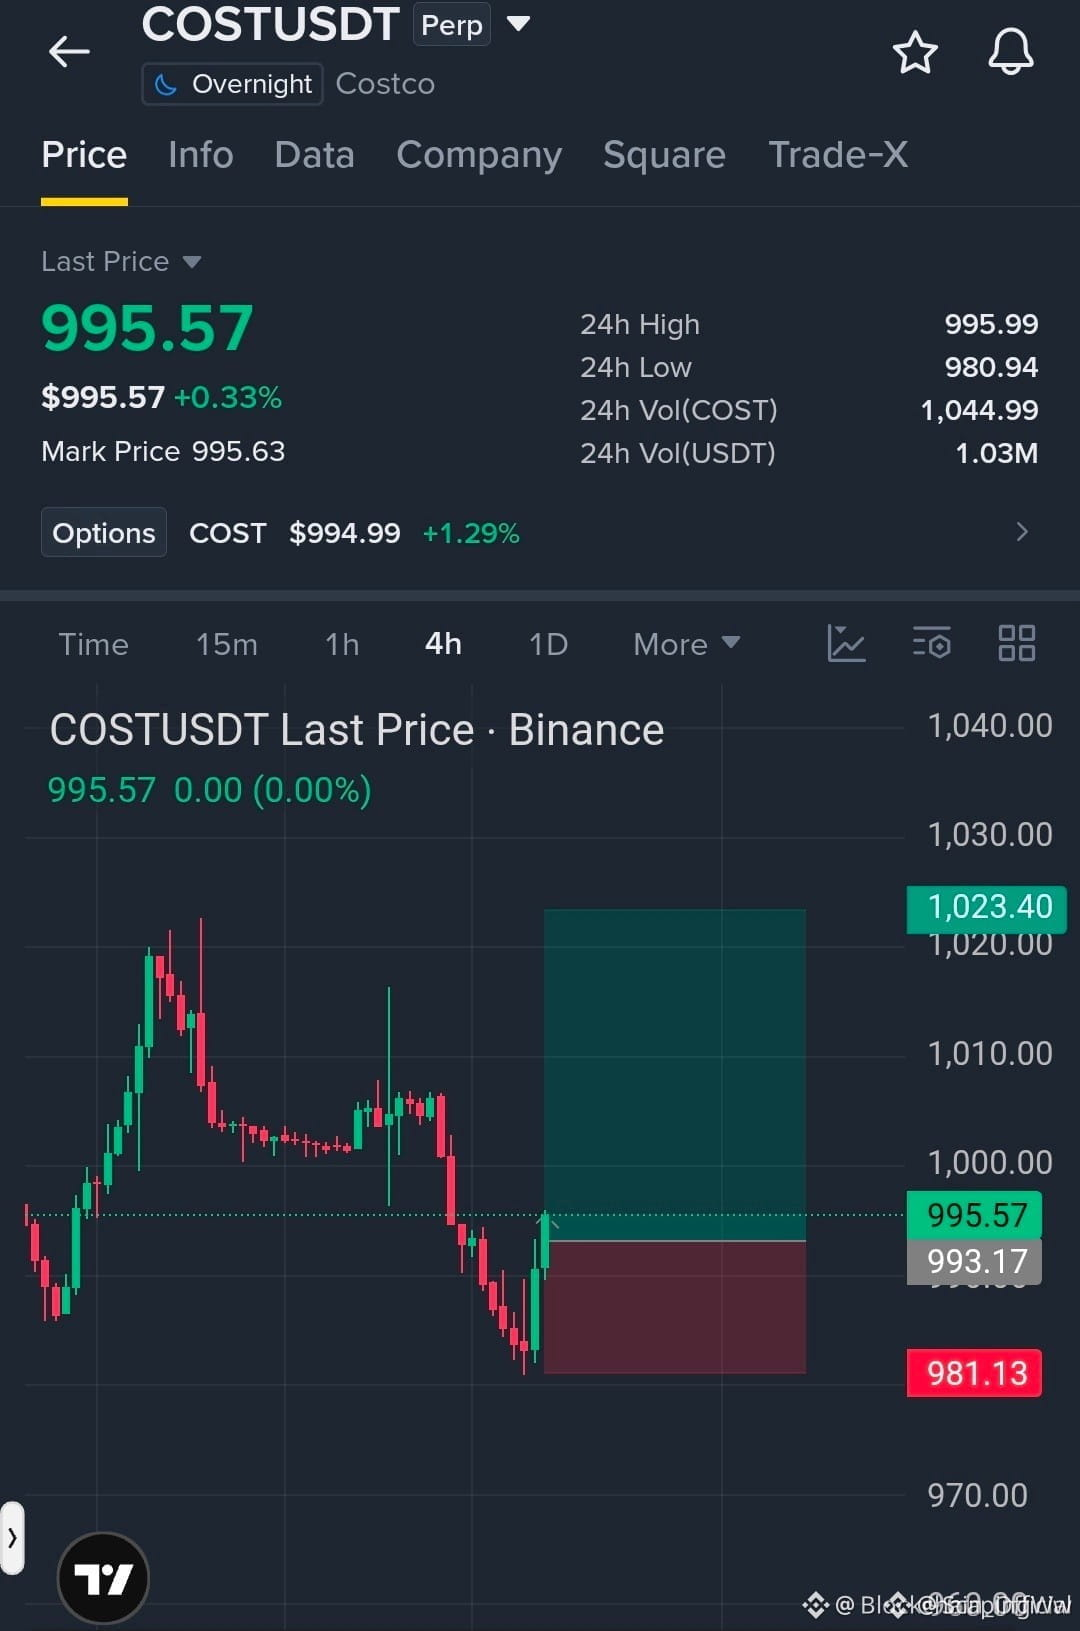
🚀 $COST BULLISH REBOUND TARGETING $1,000 BREAKOUT! 📈
Entry: 993‑996 ⚡
Target: 1,005 🚀
Stop Loss: 981 ⚠️
📊 The $981 support block just held firm, and smart‑money 🦈 is loading bids right up to the $996‑$1,000 corridor. Volume spikes on the 4‑hour chart signal buyers are flipping the script, and the RSI is clawing back from oversold territory, hinting at fresh upside momentum. ⚡
If the price cracks $1,000, the next resistance towers at $1,015 and $1,023, offering layered profit zones. Keep an eye on any sudden sell‑off that could force a retest of $981 – that’s where the risk lives. 💬 Will you ride the rally or wait for a cleaner breakout? 👇
⚠️ Not financial advice. Always manage your risk. 🛡️
🏷️ #COST #LongSetup #Breakout #Momentum #Trading
🔥 💎
🚀 $COST BULLISH REBOUND TARGETING $1,000 BREAKOUT! 📈
Entry: 993‑996 ⚡
Target: 1,005 🚀
Stop Loss: 981 ⚠️
📊 The $981 support block just held firm, and smart‑money 🦈 is loading bids right up to the $996‑$1,000 corridor. Volume spikes on the 4‑hour chart signal buyers are flipping the script, and the RSI is clawing back from oversold territory, hinting at fresh upside momentum. ⚡
If the price cracks $1,000, the next resistance towers at $1,015 and $1,023, offering layered profit zones. Keep an eye on any sudden sell‑off that could force a retest of $981 – that’s where the risk lives. 💬 Will you ride the rally or wait for a cleaner breakout? 👇
⚠️ Not financial advice. Always manage your risk. 🛡️
🏷️ #COST #LongSetup #Breakout #Momentum #Trading
🔥 💎
Entry: 993‑996 ⚡
Target: 1,005 🚀
Stop Loss: 981 ⚠️
📊 The $981 support block just held firm, and smart‑money 🦈 is loading bids right up to the $996‑$1,000 corridor. Volume spikes on the 4‑hour chart signal buyers are flipping the script, and the RSI is clawing back from oversold territory, hinting at fresh upside momentum. ⚡
If the price cracks $1,000, the next resistance towers at $1,015 and $1,023, offering layered profit zones. Keep an eye on any sudden sell‑off that could force a retest of $981 – that’s where the risk lives. 💬 Will you ride the rally or wait for a cleaner breakout? 👇
⚠️ Not financial advice. Always manage your risk. 🛡️
🏷️ #COST #LongSetup #Breakout #Momentum #Trading
🔥 💎
13

·
--
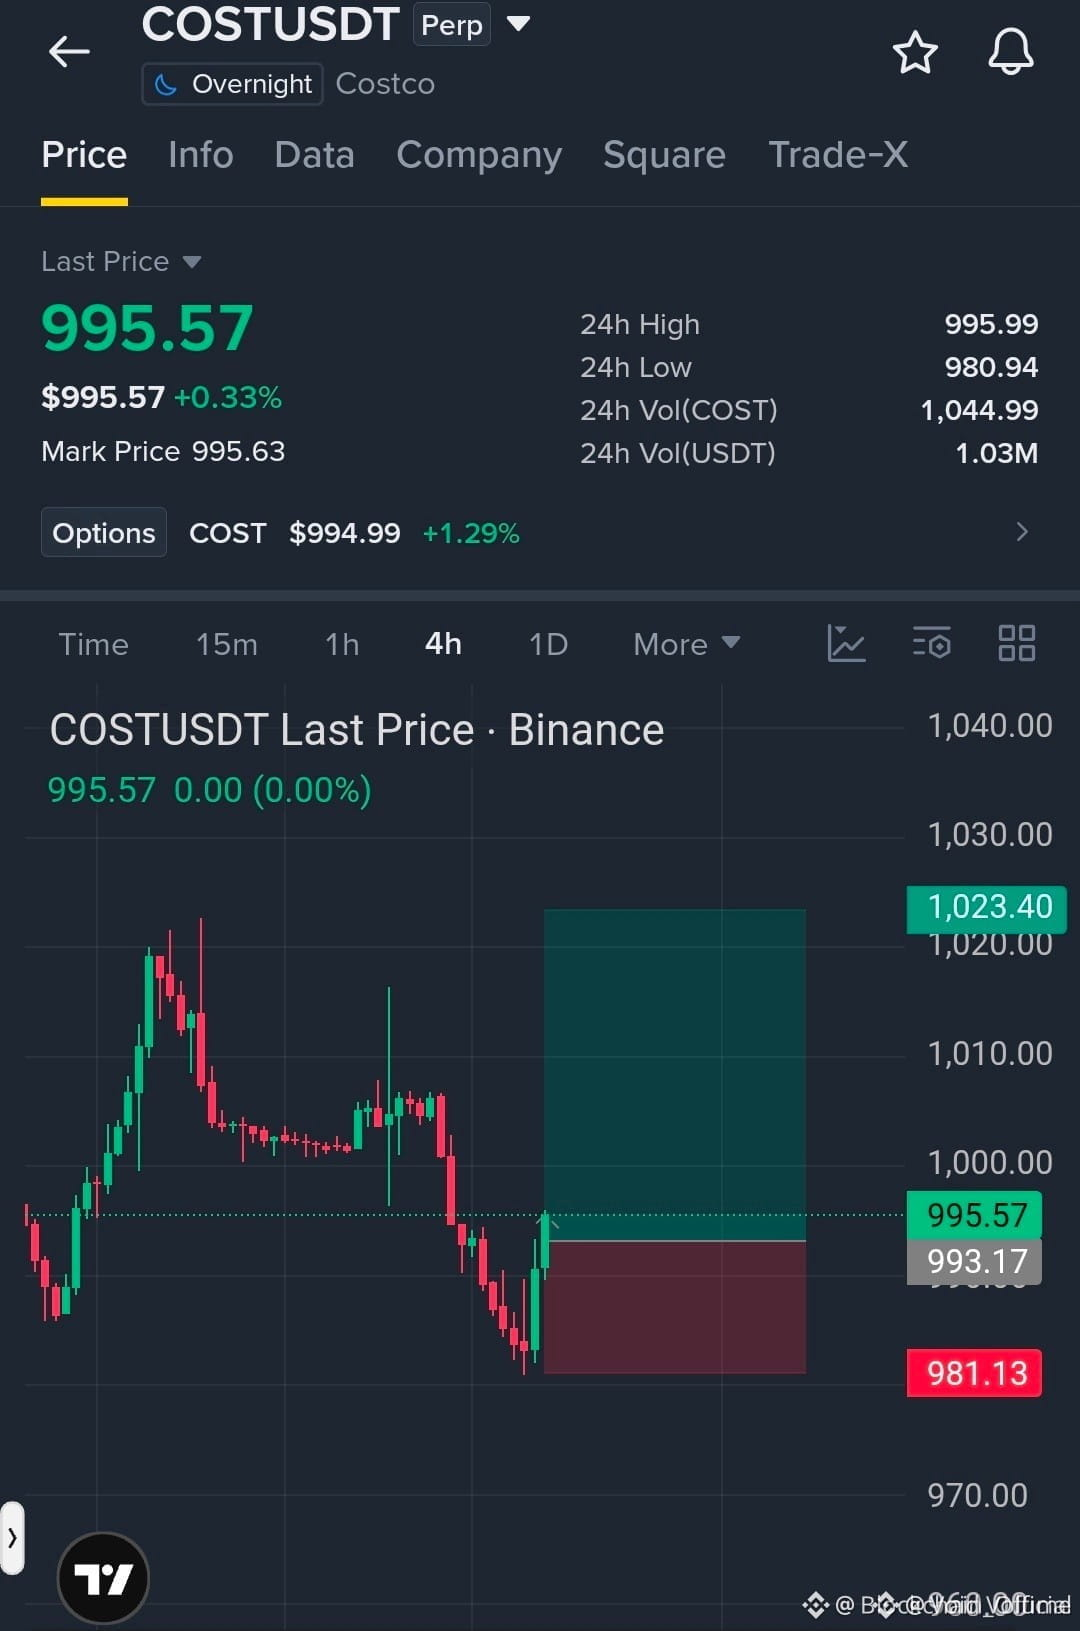
🚀 $COST REBOUNDING TOWARD $1,000 BREAKOUT ALERT! 🟢
Entry: 993‑996 ⚡
Target: 1,005 🚀
Stop Loss: 981 ⚠️
📊 The $981 demand zone has acted as a resilient order block, swallowing sell pressure three times this week. 🦈 Smart‑money liquidity is now shifting to the $1,000 threshold, and every bullish candle is adding volume weight to the upside. 💡 If buyers hold the line, the next leg to $1,015 becomes a realistic extension, but a breach below $981 would re‑trigger the liquidity hunt.
💬 Do you see the $1,000 level as the new pivot for $COST , or are you waiting for a tighter retest? 👇
⚠️ Not financial advice. Always manage your risk. 🛡️
🏷️ #COST #LongSetup #Bullish #SmartMoney #Crypto
🔥 💎
🚀 $COST REBOUNDING TOWARD $1,000 BREAKOUT ALERT! 🟢
Entry: 993‑996 ⚡
Target: 1,005 🚀
Stop Loss: 981 ⚠️
📊 The $981 demand zone has acted as a resilient order block, swallowing sell pressure three times this week. 🦈 Smart‑money liquidity is now shifting to the $1,000 threshold, and every bullish candle is adding volume weight to the upside. 💡 If buyers hold the line, the next leg to $1,015 becomes a realistic extension, but a breach below $981 would re‑trigger the liquidity hunt.
💬 Do you see the $1,000 level as the new pivot for $COST , or are you waiting for a tighter retest? 👇
⚠️ Not financial advice. Always manage your risk. 🛡️
🏷️ #COST #LongSetup #Bullish #SmartMoney #Crypto
🔥 💎
Entry: 993‑996 ⚡
Target: 1,005 🚀
Stop Loss: 981 ⚠️
📊 The $981 demand zone has acted as a resilient order block, swallowing sell pressure three times this week. 🦈 Smart‑money liquidity is now shifting to the $1,000 threshold, and every bullish candle is adding volume weight to the upside. 💡 If buyers hold the line, the next leg to $1,015 becomes a realistic extension, but a breach below $981 would re‑trigger the liquidity hunt.
💬 Do you see the $1,000 level as the new pivot for $COST , or are you waiting for a tighter retest? 👇
⚠️ Not financial advice. Always manage your risk. 🛡️
🏷️ #COST #LongSetup #Bullish #SmartMoney #Crypto
🔥 💎
1

$COST SHORT
🏁Entry: 1000.81
🎯Take 1: 999.39884678 (+0.14%)
🎯Take 2: 997.68769357 (+0.31%)
🎯Take 3: 995.12096374 (+0.57%)
❌Stop-loss: 1003.67672983 (-0.29%)
From numbers to scenario: each take serves as a separate stage of the trade. I’m considering a possible move downward, without promising a direct move.
⚠️ This is not financial advice. Trade at your own risk. DYOR.
#COST #ZECUSDT #BANK 📈
$COST
$COST SHORT
🏁Entry: 1000.81
🎯Take 1: 999.39884678 (+0.14%)
🎯Take 2: 997.68769357 (+0.31%)
🎯Take 3: 995.12096374 (+0.57%)
❌Stop-loss: 1003.67672983 (-0.29%)
From numbers to scenario: each take serves as a separate stage of the trade. I’m considering a possible move downward, without promising a direct move.
⚠️ This is not financial advice. Trade at your own risk. DYOR.
#COST #ZECUSDT #BANK 📈
$COST
🏁Entry: 1000.81
🎯Take 1: 999.39884678 (+0.14%)
🎯Take 2: 997.68769357 (+0.31%)
🎯Take 3: 995.12096374 (+0.57%)
❌Stop-loss: 1003.67672983 (-0.29%)
From numbers to scenario: each take serves as a separate stage of the trade. I’m considering a possible move downward, without promising a direct move.
⚠️ This is not financial advice. Trade at your own risk. DYOR.
#COST #ZECUSDT #BANK 📈
$COST
10

·
--
Bullish
$COST is trading near 983.68 and showing +0.11% light bullish momentum.
Long idea:
EP: 980–987
TP1: 995
TP2: 1,010
SL: 970
Buyers are trying to hold the price near this zone, but momentum is still mild. A clean push above 995 can open room for more upside.
What’s your target for $COST ?
#COST #Crypto #trading
$COST is trading near 983.68 and showing +0.11% light bullish momentum.
Long idea:
EP: 980–987
TP1: 995
TP2: 1,010
SL: 970
Buyers are trying to hold the price near this zone, but momentum is still mild. A clean push above 995 can open room for more upside.
What’s your target for $COST ?
#COST #Crypto #trading
Long idea:
EP: 980–987
TP1: 995
TP2: 1,010
SL: 970
Buyers are trying to hold the price near this zone, but momentum is still mild. A clean push above 995 can open room for more upside.
What’s your target for $COST ?
#COST #Crypto #trading
3
153

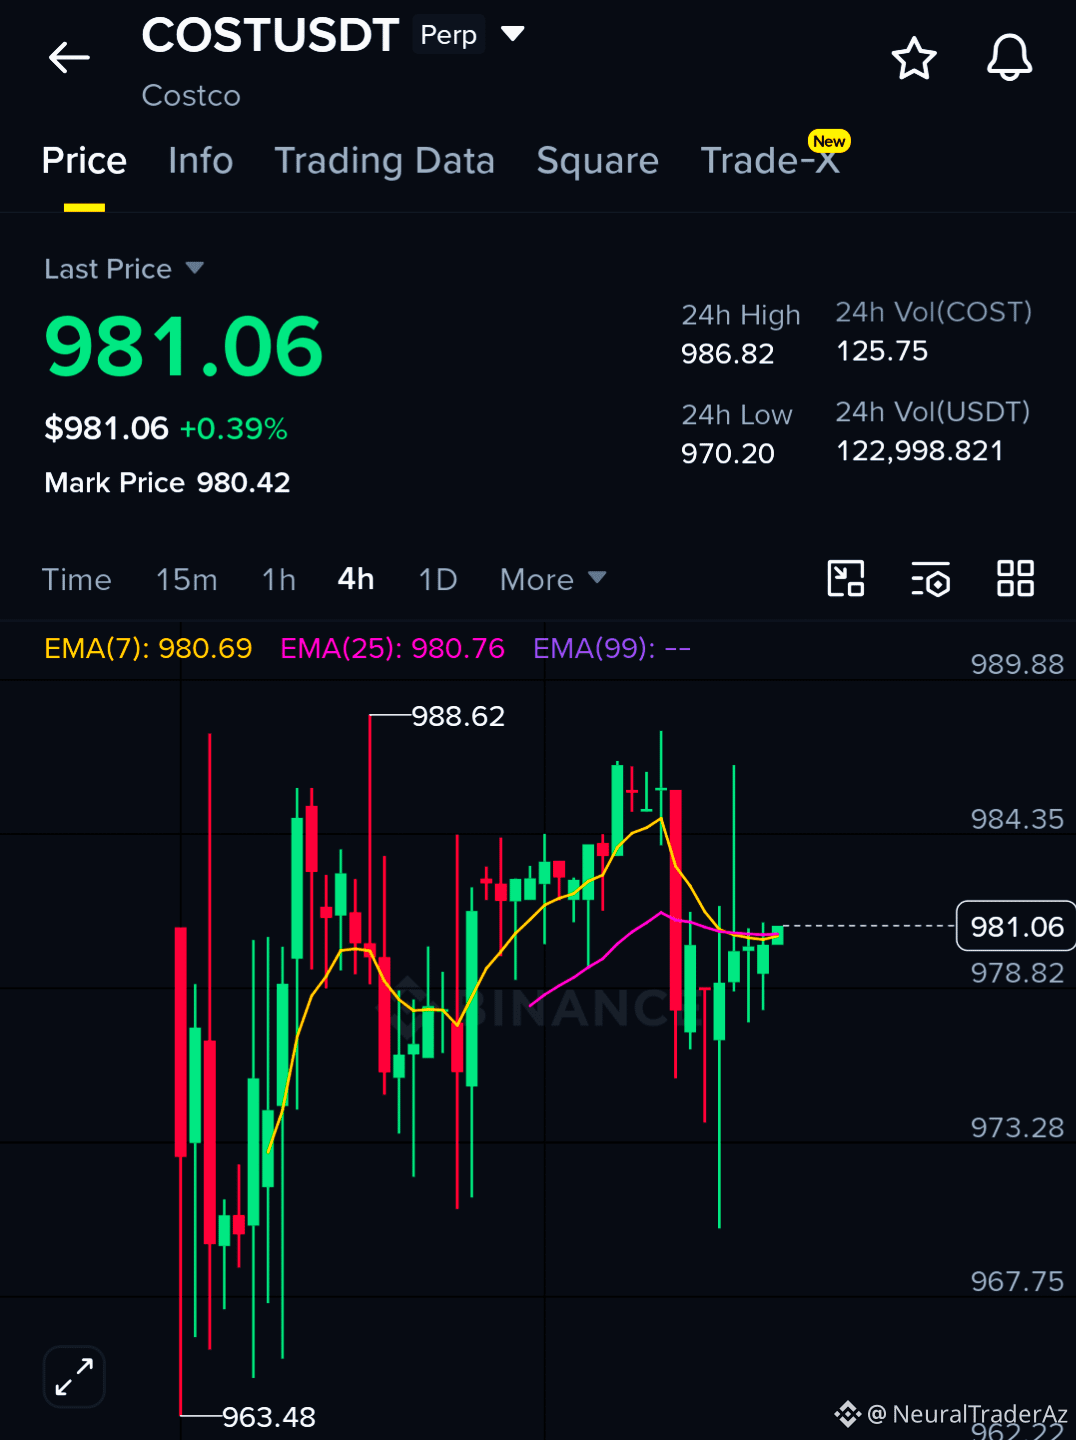
$COST Long Setup – Clean Technical Structure With Defined Levels
Entry: Market Price (Current Zone)
Target: 988.23 / 997.45 / 1,020
Stop Loss: 970
The structure here is straightforward. Price is holding above a local demand zone, and the setup targets a sweep of recent highs with a tight invalidation level. The 970 stop loss sits just below a logical structural low, giving the trade a clean risk boundary. The upside targets scale into areas where liquidity is likely resting, with 1,020 being the key psychological extension.
Keeping the risk-reward profile favorable here. The defined invalidation point keeps the downside exposure contained while allowing room for the move to develop. Watching for volume confirmation as price approaches the first target zone.
Not financial advice. Manage your risk.
#COST #LongSetup #TradingSignals #Crypto
📊
$COST Long Setup – Clean Technical Structure With Defined Levels
Entry: Market Price (Current Zone)
Target: 988.23 / 997.45 / 1,020
Stop Loss: 970
The structure here is straightforward. Price is holding above a local demand zone, and the setup targets a sweep of recent highs with a tight invalidation level. The 970 stop loss sits just below a logical structural low, giving the trade a clean risk boundary. The upside targets scale into areas where liquidity is likely resting, with 1,020 being the key psychological extension.
Keeping the risk-reward profile favorable here. The defined invalidation point keeps the downside exposure contained while allowing room for the move to develop. Watching for volume confirmation as price approaches the first target zone.
Not financial advice. Manage your risk.
#COST #LongSetup #TradingSignals #Crypto
📊
Entry: Market Price (Current Zone)
Target: 988.23 / 997.45 / 1,020
Stop Loss: 970
The structure here is straightforward. Price is holding above a local demand zone, and the setup targets a sweep of recent highs with a tight invalidation level. The 970 stop loss sits just below a logical structural low, giving the trade a clean risk boundary. The upside targets scale into areas where liquidity is likely resting, with 1,020 being the key psychological extension.
Keeping the risk-reward profile favorable here. The defined invalidation point keeps the downside exposure contained while allowing room for the move to develop. Watching for volume confirmation as price approaches the first target zone.
Not financial advice. Manage your risk.
#COST #LongSetup #TradingSignals #Crypto
📊
43

Log in to explore more content
Join global crypto users on Binance Square
⚡️ Get latest and useful information about crypto.
💬 Trusted by the world’s largest crypto exchange.
👍 Discover real insights from verified creators.
Email / Phone number
Trending Topics
1
#CanBTCReboundAfterFallingBelow60K?
157,514 views
698 Discussing
2
#GlobalStocksFaceLongestLosingStreakSince2023
64,311 views
613 Discussing
3
#AnthropicPlungesTowardIPOPriceonDay2
25,416 views
273 Discussing
4
#BNBDropsBelow540USDTWith8.46%DailyDecline
1,897 views
47 Discussing
5
#BitMineFaces$10.1BUnrealizedETHLoss
0 views
1 Discussing
6
#StrategyReports$35BNetReserves
2 views
1 Discussing
7
#MorganStanleyEndsAnthropicStockSupportAfterOneDay
973 views
34 Discussing
8
#CryptoBilisAttackerMoves25000ETHToTornadoCash
1,384 views
37 Discussing
9
#FirstRealTimeDividendPaidInDigitalDollars
156 views
9 Discussing
10
#GaoTengBitcoinETFListsOnHKEX
40,658 views
411 Discussing