
#bearish
bearish
10.1M views
112,818 Discussing
Hot
Latest


·
--
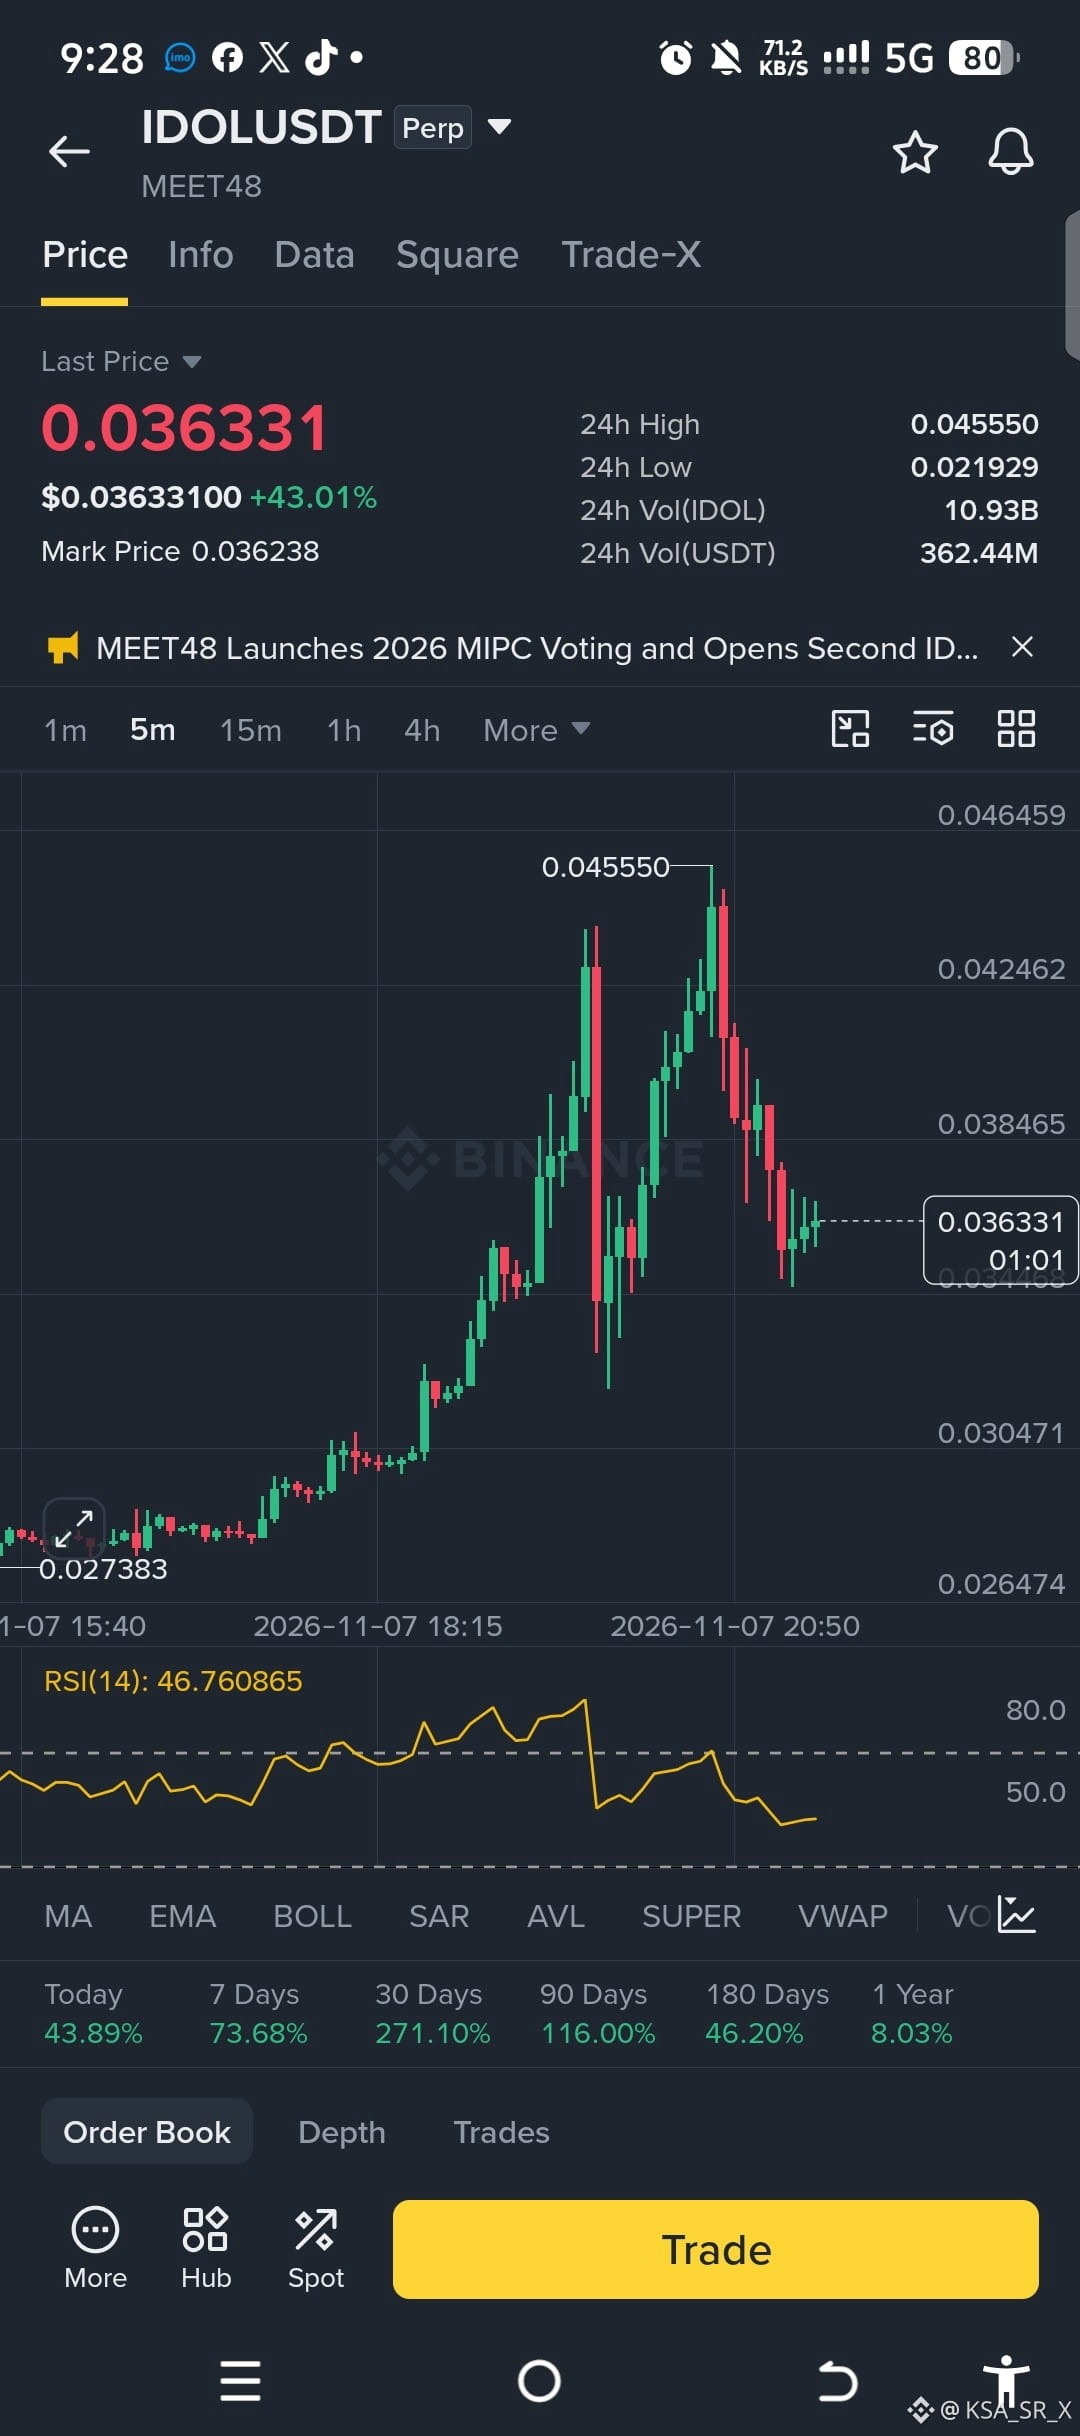
$IDOL 🚨🐻 BEARS ARE WAKING UP! THE MARKET IS SHOWING WARNING SIGNS! 📉
Big green candles can attract buyers, but smart traders know that a massive pump can also become the perfect setup for a sharp correction.
⚠️ Heavy rejection from the recent high
📉 Buying momentum is weakening
🐻 Sellers are starting to take control
🎯 A deeper pullback could be next!
Remember: Don't chase the pump. Don't ignore the risk.
💰 Protect your capital. 🛑 Use Stop Loss. ⚡ Avoid excessive leverage.
The biggest opportunity sometimes comes when everyone else is too greedy to see the danger!
Are you ready for a bearish move? 👀
#Crypto #bearish #MarketCorrection #Trading
$IDOL 🚨🐻 BEARS ARE WAKING UP! THE MARKET IS SHOWING WARNING SIGNS! 📉
Big green candles can attract buyers, but smart traders know that a massive pump can also become the perfect setup for a sharp correction.
⚠️ Heavy rejection from the recent high
📉 Buying momentum is weakening
🐻 Sellers are starting to take control
🎯 A deeper pullback could be next!
Remember: Don't chase the pump. Don't ignore the risk.
💰 Protect your capital. 🛑 Use Stop Loss. ⚡ Avoid excessive leverage.
The biggest opportunity sometimes comes when everyone else is too greedy to see the danger!
Are you ready for a bearish move? 👀
#Crypto #bearish #MarketCorrection #Trading
Big green candles can attract buyers, but smart traders know that a massive pump can also become the perfect setup for a sharp correction.
⚠️ Heavy rejection from the recent high
📉 Buying momentum is weakening
🐻 Sellers are starting to take control
🎯 A deeper pullback could be next!
Remember: Don't chase the pump. Don't ignore the risk.
💰 Protect your capital. 🛑 Use Stop Loss. ⚡ Avoid excessive leverage.
The biggest opportunity sometimes comes when everyone else is too greedy to see the danger!
Are you ready for a bearish move? 👀
#Crypto #bearish #MarketCorrection #Trading
2
898

·
--
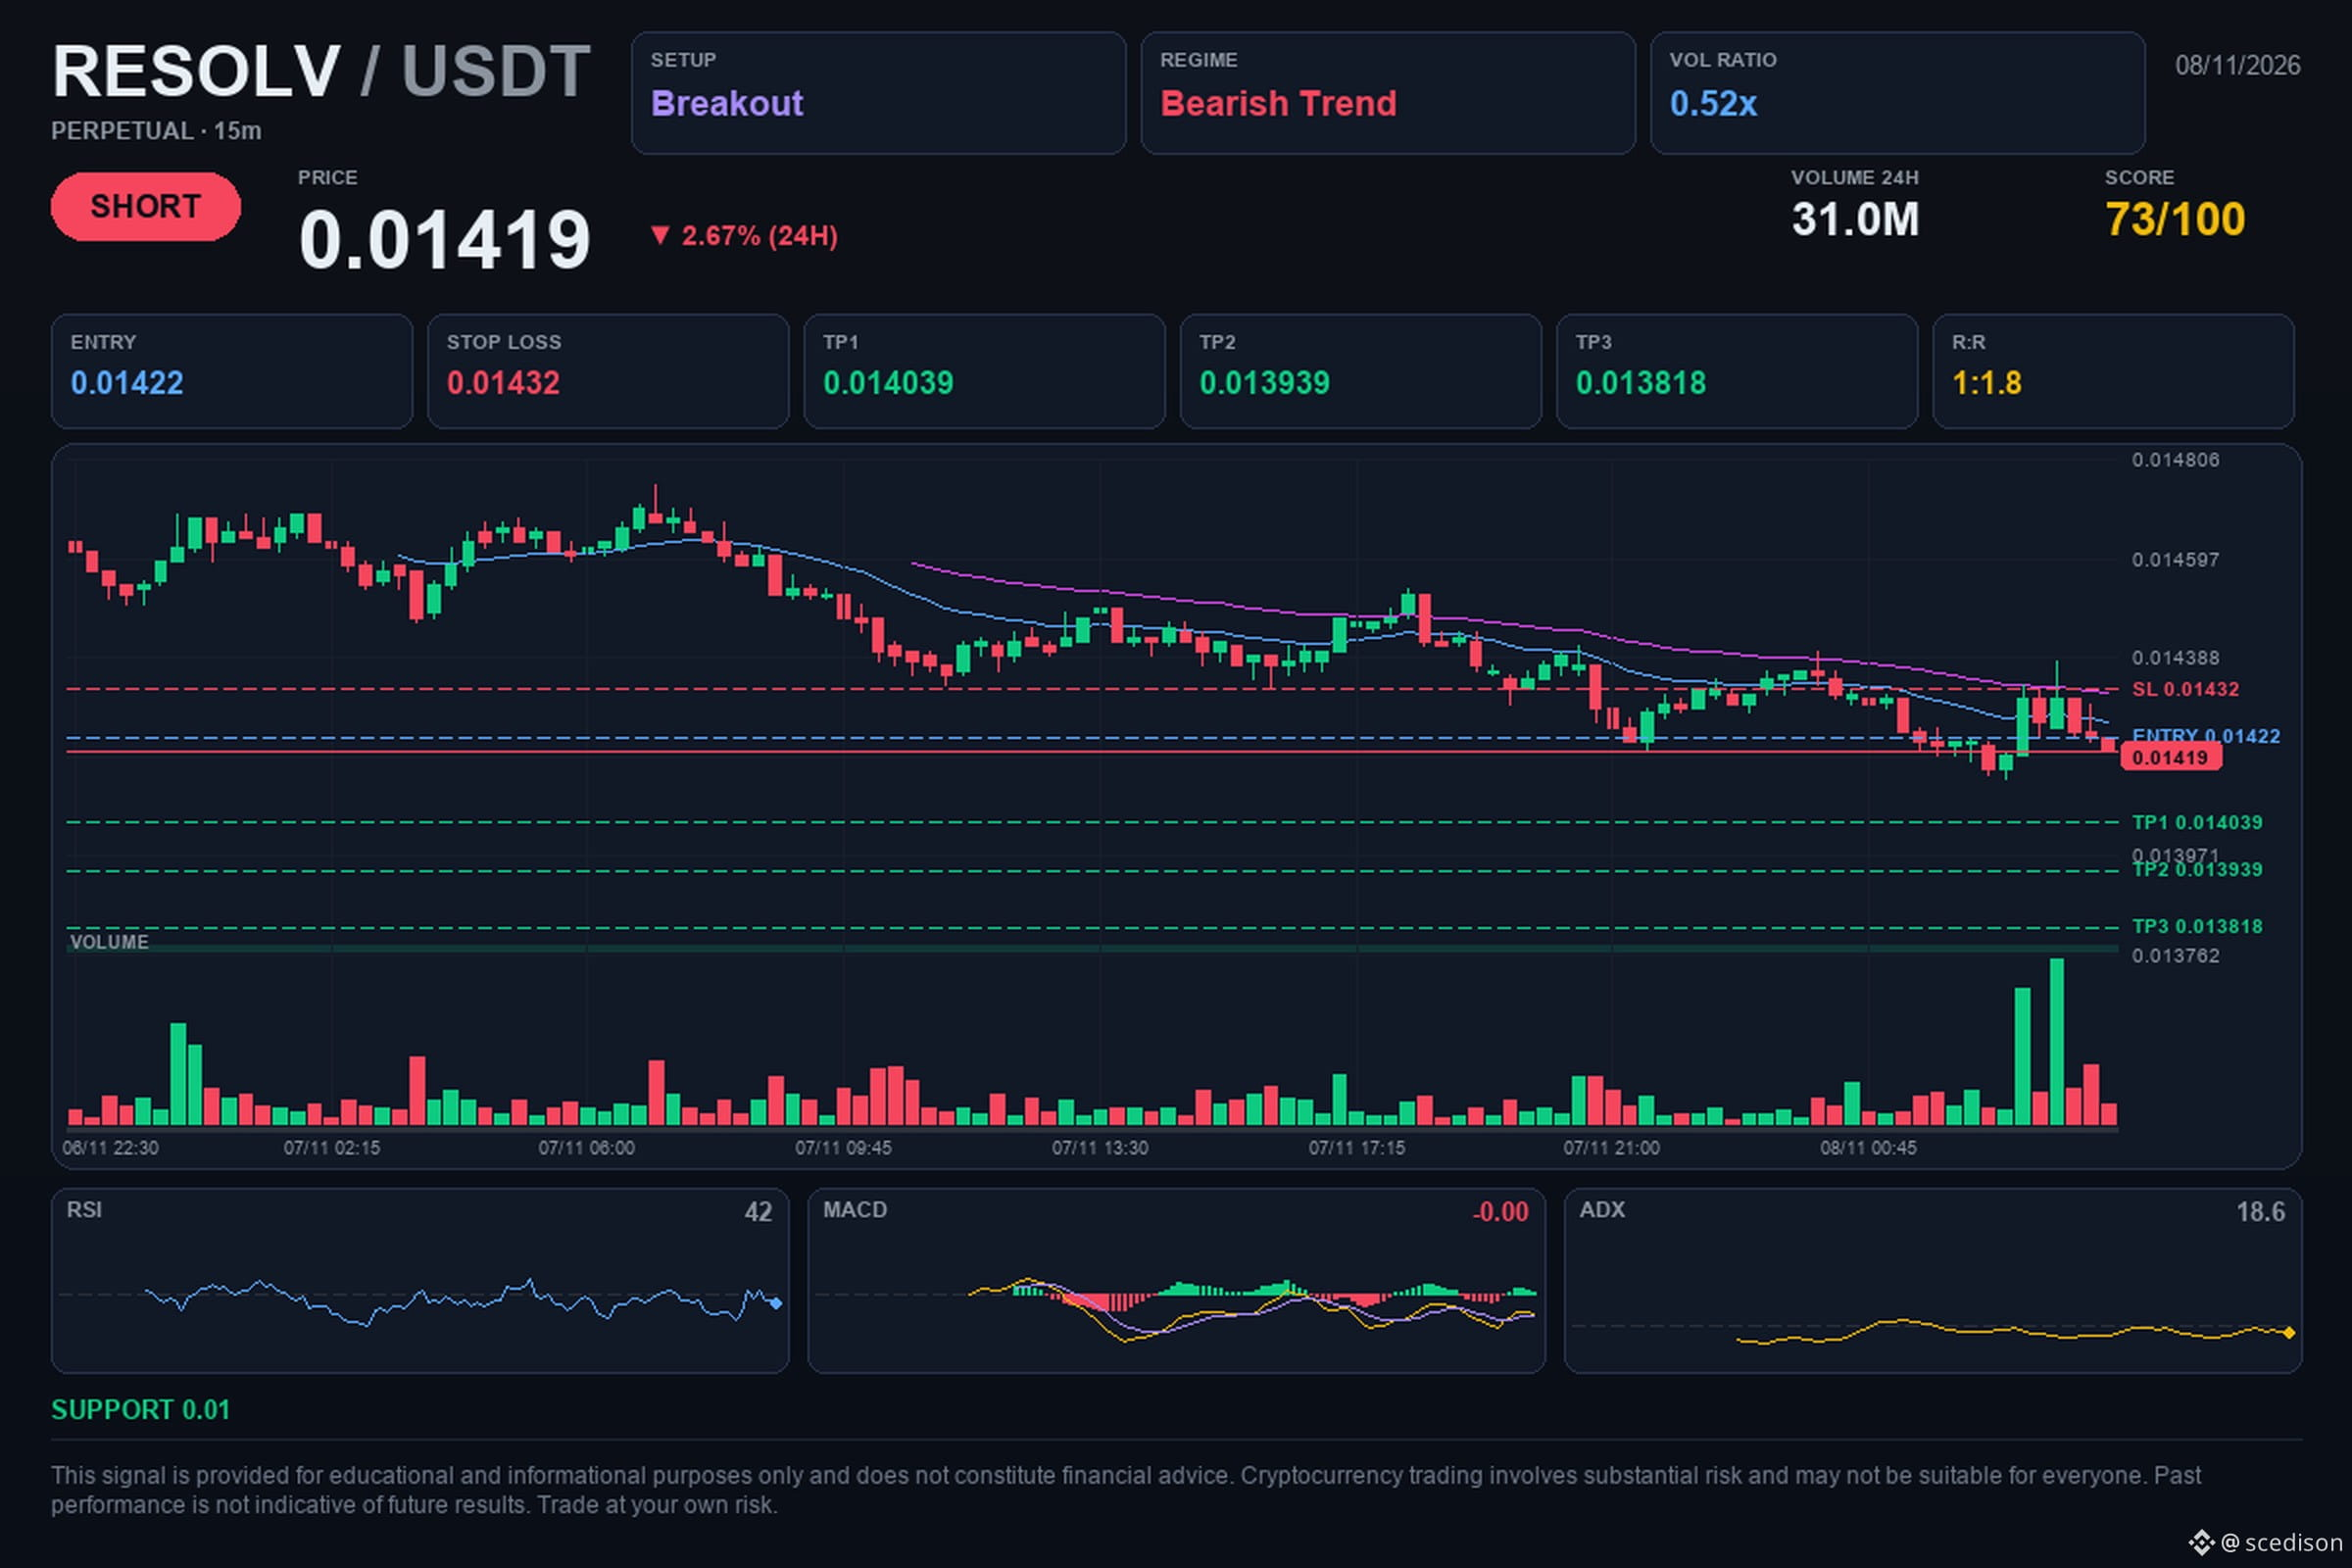
📢 $RESOLV / USDT | 🔴 SHORT | ⭐ 74%
🎯 Target: $0.0140391. Will it reach it?
🎯 Trade levels:
🔴 Entry: $0.01422
🛑 Stop Loss: $0.01432
🏁 TP1: $0.014039
🏁 TP2: $0.013939
🏁 TP3: $0.013818
📈 Analysis:
The market structure shows a clear downtrend with lower lows, confirmed across multiple timeframes. A bearish break of key levels is observed, accompanied by a significant increase in trading volume, suggesting strong selling pressure. Current momentum remains under the sellers’ control, supported by a technical setup that favors continuation of the move toward the stated target.
⚖️ Risk/Reward: 1:1.8
⏱️ Timeframe: 15M
💭 A breakout occurs when the price moves forcefully through a support or resistance level, indicating a possible continuation of the trend in that direction.
#crypto #RESOLV #trading #Bearish
💡 This analysis is for educational purposes and does not constitute financial advice. Do your own research and make your decisions carefully.
📢 $RESOLV / USDT | 🔴 SHORT | ⭐ 74%
🎯 Target: $0.0140391. Will it reach it?
🎯 Trade levels:
🔴 Entry: $0.01422
🛑 Stop Loss: $0.01432
🏁 TP1: $0.014039
🏁 TP2: $0.013939
🏁 TP3: $0.013818
📈 Analysis:
The market structure shows a clear downtrend with lower lows, confirmed across multiple timeframes. A bearish break of key levels is observed, accompanied by a significant increase in trading volume, suggesting strong selling pressure. Current momentum remains under the sellers’ control, supported by a technical setup that favors continuation of the move toward the stated target.
⚖️ Risk/Reward: 1:1.8
⏱️ Timeframe: 15M
💭 A breakout occurs when the price moves forcefully through a support or resistance level, indicating a possible continuation of the trend in that direction.
#crypto #RESOLV #trading #Bearish
💡 This analysis is for educational purposes and does not constitute financial advice. Do your own research and make your decisions carefully.
🎯 Target: $0.0140391. Will it reach it?
🎯 Trade levels:
🔴 Entry: $0.01422
🛑 Stop Loss: $0.01432
🏁 TP1: $0.014039
🏁 TP2: $0.013939
🏁 TP3: $0.013818
📈 Analysis:
The market structure shows a clear downtrend with lower lows, confirmed across multiple timeframes. A bearish break of key levels is observed, accompanied by a significant increase in trading volume, suggesting strong selling pressure. Current momentum remains under the sellers’ control, supported by a technical setup that favors continuation of the move toward the stated target.
⚖️ Risk/Reward: 1:1.8
⏱️ Timeframe: 15M
💭 A breakout occurs when the price moves forcefully through a support or resistance level, indicating a possible continuation of the trend in that direction.
#crypto #RESOLV #trading #Bearish
💡 This analysis is for educational purposes and does not constitute financial advice. Do your own research and make your decisions carefully.
11
·
--
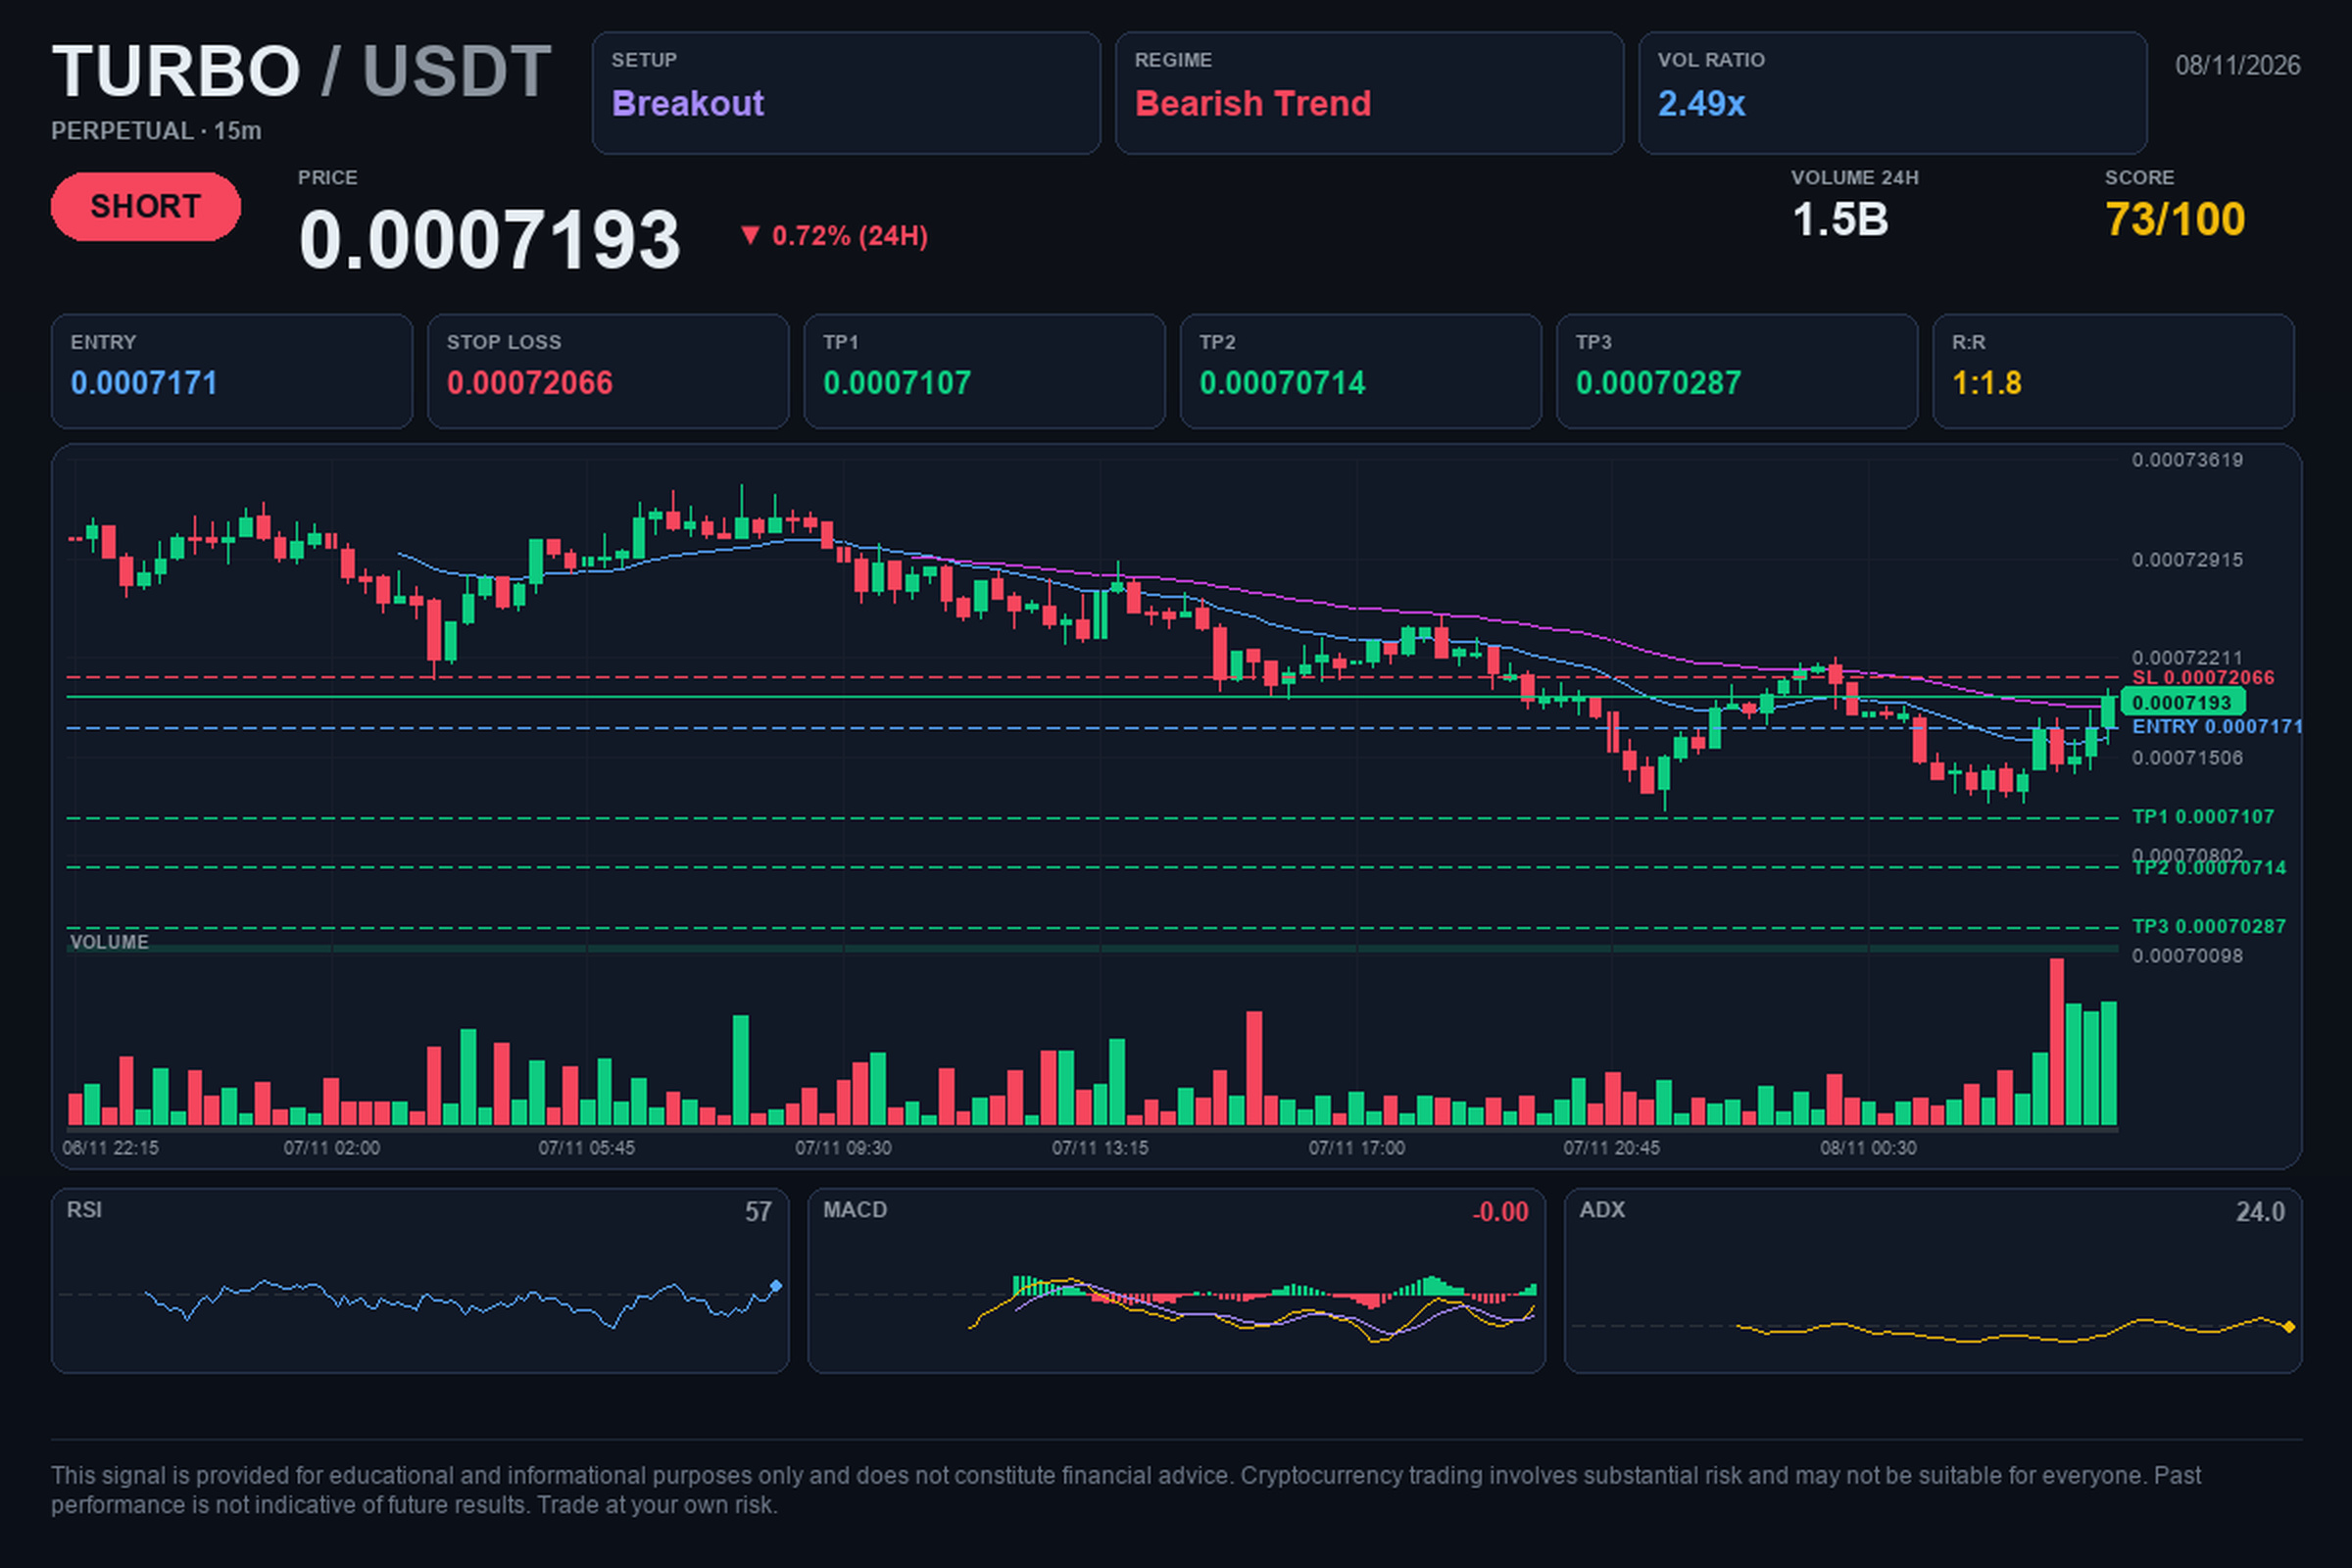
📢 $TURBO / USDT | 🔴 SHORT | ⭐ 74%
🎯 Target: $0.0007107. Will it reach it?
🎯 Trading levels:
🔴 Entry: $0.0007171
🛑 Stop Loss: $0.00072066
🏁 TP1: $0.0007107
🏁 TP2: $0.00070714
🏁 TP3: $0.00070287
📈 Analysis:
The market structure shows a confirmed downtrend across multiple timeframes, supported by the formation of lower highs. Trading volume has increased significantly, exceeding the average, which reinforces the current selling pressure. Additionally, momentum remains under the sellers’ control, as reflected by the bearish MACD indicator setup.
⚖️ Risk/Reward: 1:1.8
⏱️ Timeframe: 15M
💭 Relative volume measures how much more an asset is being traded compared with its usual average; a high value often indicates greater interest in the current move.
#crypto #TURBO #trading #Bearish
💡 This analysis is for educational purposes and does not constitute financial advice. Do your own research and make your decisions calmly.
📢 $TURBO / USDT | 🔴 SHORT | ⭐ 74%
🎯 Target: $0.0007107. Will it reach it?
🎯 Trading levels:
🔴 Entry: $0.0007171
🛑 Stop Loss: $0.00072066
🏁 TP1: $0.0007107
🏁 TP2: $0.00070714
🏁 TP3: $0.00070287
📈 Analysis:
The market structure shows a confirmed downtrend across multiple timeframes, supported by the formation of lower highs. Trading volume has increased significantly, exceeding the average, which reinforces the current selling pressure. Additionally, momentum remains under the sellers’ control, as reflected by the bearish MACD indicator setup.
⚖️ Risk/Reward: 1:1.8
⏱️ Timeframe: 15M
💭 Relative volume measures how much more an asset is being traded compared with its usual average; a high value often indicates greater interest in the current move.
#crypto #TURBO #trading #Bearish
💡 This analysis is for educational purposes and does not constitute financial advice. Do your own research and make your decisions calmly.
🎯 Target: $0.0007107. Will it reach it?
🎯 Trading levels:
🔴 Entry: $0.0007171
🛑 Stop Loss: $0.00072066
🏁 TP1: $0.0007107
🏁 TP2: $0.00070714
🏁 TP3: $0.00070287
📈 Analysis:
The market structure shows a confirmed downtrend across multiple timeframes, supported by the formation of lower highs. Trading volume has increased significantly, exceeding the average, which reinforces the current selling pressure. Additionally, momentum remains under the sellers’ control, as reflected by the bearish MACD indicator setup.
⚖️ Risk/Reward: 1:1.8
⏱️ Timeframe: 15M
💭 Relative volume measures how much more an asset is being traded compared with its usual average; a high value often indicates greater interest in the current move.
#crypto #TURBO #trading #Bearish
💡 This analysis is for educational purposes and does not constitute financial advice. Do your own research and make your decisions calmly.
8

·
--
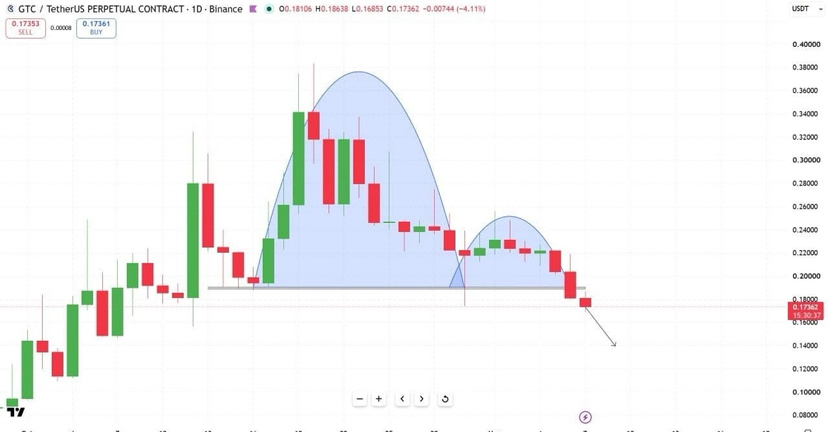
� Coin $GTC is showing clear signs of weakness after the recent crash!
After breaking below its previous trading range, the way is now open for further declines 📉
Buyers are struggling to defend the price, while bearish momentum continues to strengthen.
⚠️ Even a slight rebound could just be a trap for buyers before another sharp downward move.
If demand continues to weaken, we may see new price lows.
🔴 It seems $GTC may be on the verge of a major price correction!
Stay alert—the market has no mercy for those who rush in! 👀
#GTC #Crypto #Bearish #Altcoins
{future}(GTCUSDT)
� Coin $GTC is showing clear signs of weakness after the recent crash!
After breaking below its previous trading range, the way is now open for further declines 📉
Buyers are struggling to defend the price, while bearish momentum continues to strengthen.
⚠️ Even a slight rebound could just be a trap for buyers before another sharp downward move.
If demand continues to weaken, we may see new price lows.
🔴 It seems $GTC may be on the verge of a major price correction!
Stay alert—the market has no mercy for those who rush in! 👀
#GTC #Crypto #Bearish #Altcoins
After breaking below its previous trading range, the way is now open for further declines 📉
Buyers are struggling to defend the price, while bearish momentum continues to strengthen.
⚠️ Even a slight rebound could just be a trap for buyers before another sharp downward move.
If demand continues to weaken, we may see new price lows.
🔴 It seems $GTC may be on the verge of a major price correction!
Stay alert—the market has no mercy for those who rush in! 👀
#GTC #Crypto #Bearish #Altcoins
28
·
--
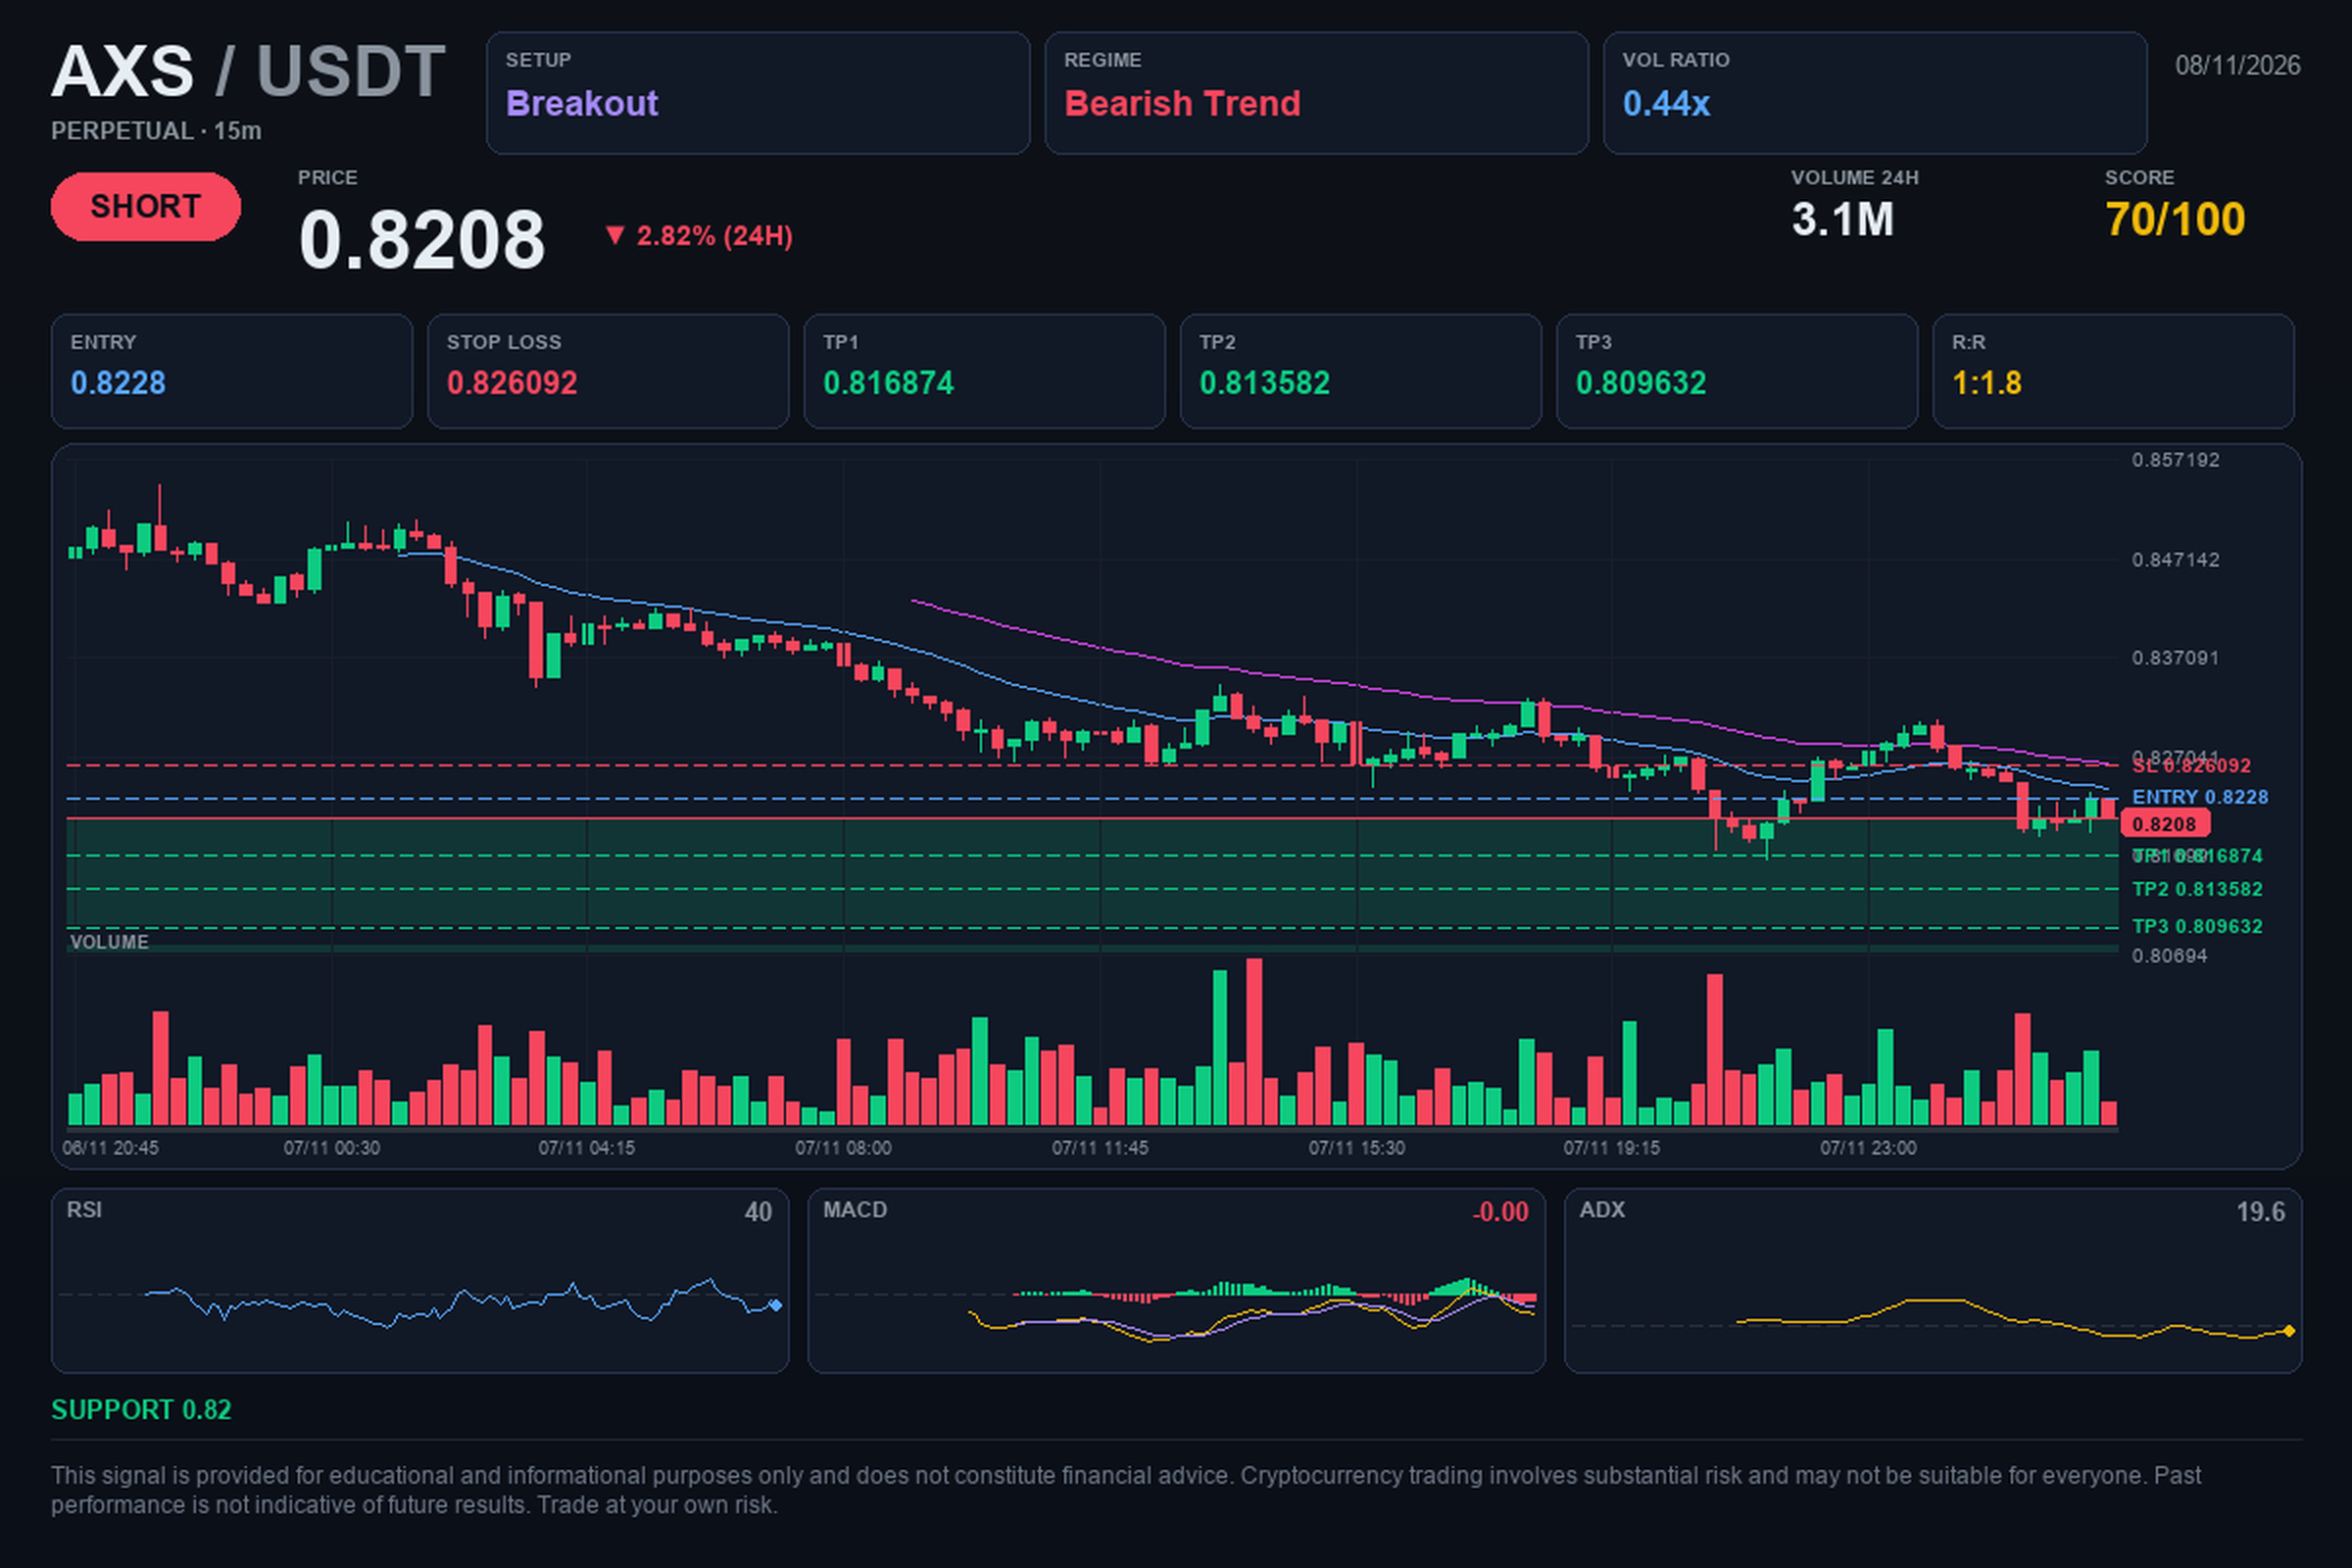
📢 $AXS / USDT | 🔴 SHORT | ⭐ 70%
🎯 Target: $0.81687443. Will it reach it?
🎯 Trade levels:
🔴 Entry: $0.8228
🛑 Stop Loss: $0.826092
🏁 TP1: $0.816874
🏁 TP2: $0.813582
🏁 TP3: $0.809632
📈 Analysis:
The asset shows a clear bearish structure, with lower lows confirmed across multiple timeframes. The recent break below support, accompanied by a 37% increase in volume, suggests greater selling pressure in the market. With open interest declining slightly, sellers remain in control of the current trend.
⚖️ Risk/Reward: 1:1.8
⏱️ Timeframe: 15M
💭 A breakout occurs when the price moves through a key support or resistance level, which often signals a strengthening of the current trend.
#crypto #AXS #trading #Bearish
💡 This analysis is for educational purposes and does not constitute financial advice. Do your own research and make your decision calmly.
📢 $AXS / USDT | 🔴 SHORT | ⭐ 70%
🎯 Target: $0.81687443. Will it reach it?
🎯 Trade levels:
🔴 Entry: $0.8228
🛑 Stop Loss: $0.826092
🏁 TP1: $0.816874
🏁 TP2: $0.813582
🏁 TP3: $0.809632
📈 Analysis:
The asset shows a clear bearish structure, with lower lows confirmed across multiple timeframes. The recent break below support, accompanied by a 37% increase in volume, suggests greater selling pressure in the market. With open interest declining slightly, sellers remain in control of the current trend.
⚖️ Risk/Reward: 1:1.8
⏱️ Timeframe: 15M
💭 A breakout occurs when the price moves through a key support or resistance level, which often signals a strengthening of the current trend.
#crypto #AXS #trading #Bearish
💡 This analysis is for educational purposes and does not constitute financial advice. Do your own research and make your decision calmly.
🎯 Target: $0.81687443. Will it reach it?
🎯 Trade levels:
🔴 Entry: $0.8228
🛑 Stop Loss: $0.826092
🏁 TP1: $0.816874
🏁 TP2: $0.813582
🏁 TP3: $0.809632
📈 Analysis:
The asset shows a clear bearish structure, with lower lows confirmed across multiple timeframes. The recent break below support, accompanied by a 37% increase in volume, suggests greater selling pressure in the market. With open interest declining slightly, sellers remain in control of the current trend.
⚖️ Risk/Reward: 1:1.8
⏱️ Timeframe: 15M
💭 A breakout occurs when the price moves through a key support or resistance level, which often signals a strengthening of the current trend.
#crypto #AXS #trading #Bearish
💡 This analysis is for educational purposes and does not constitute financial advice. Do your own research and make your decision calmly.
15
·
--
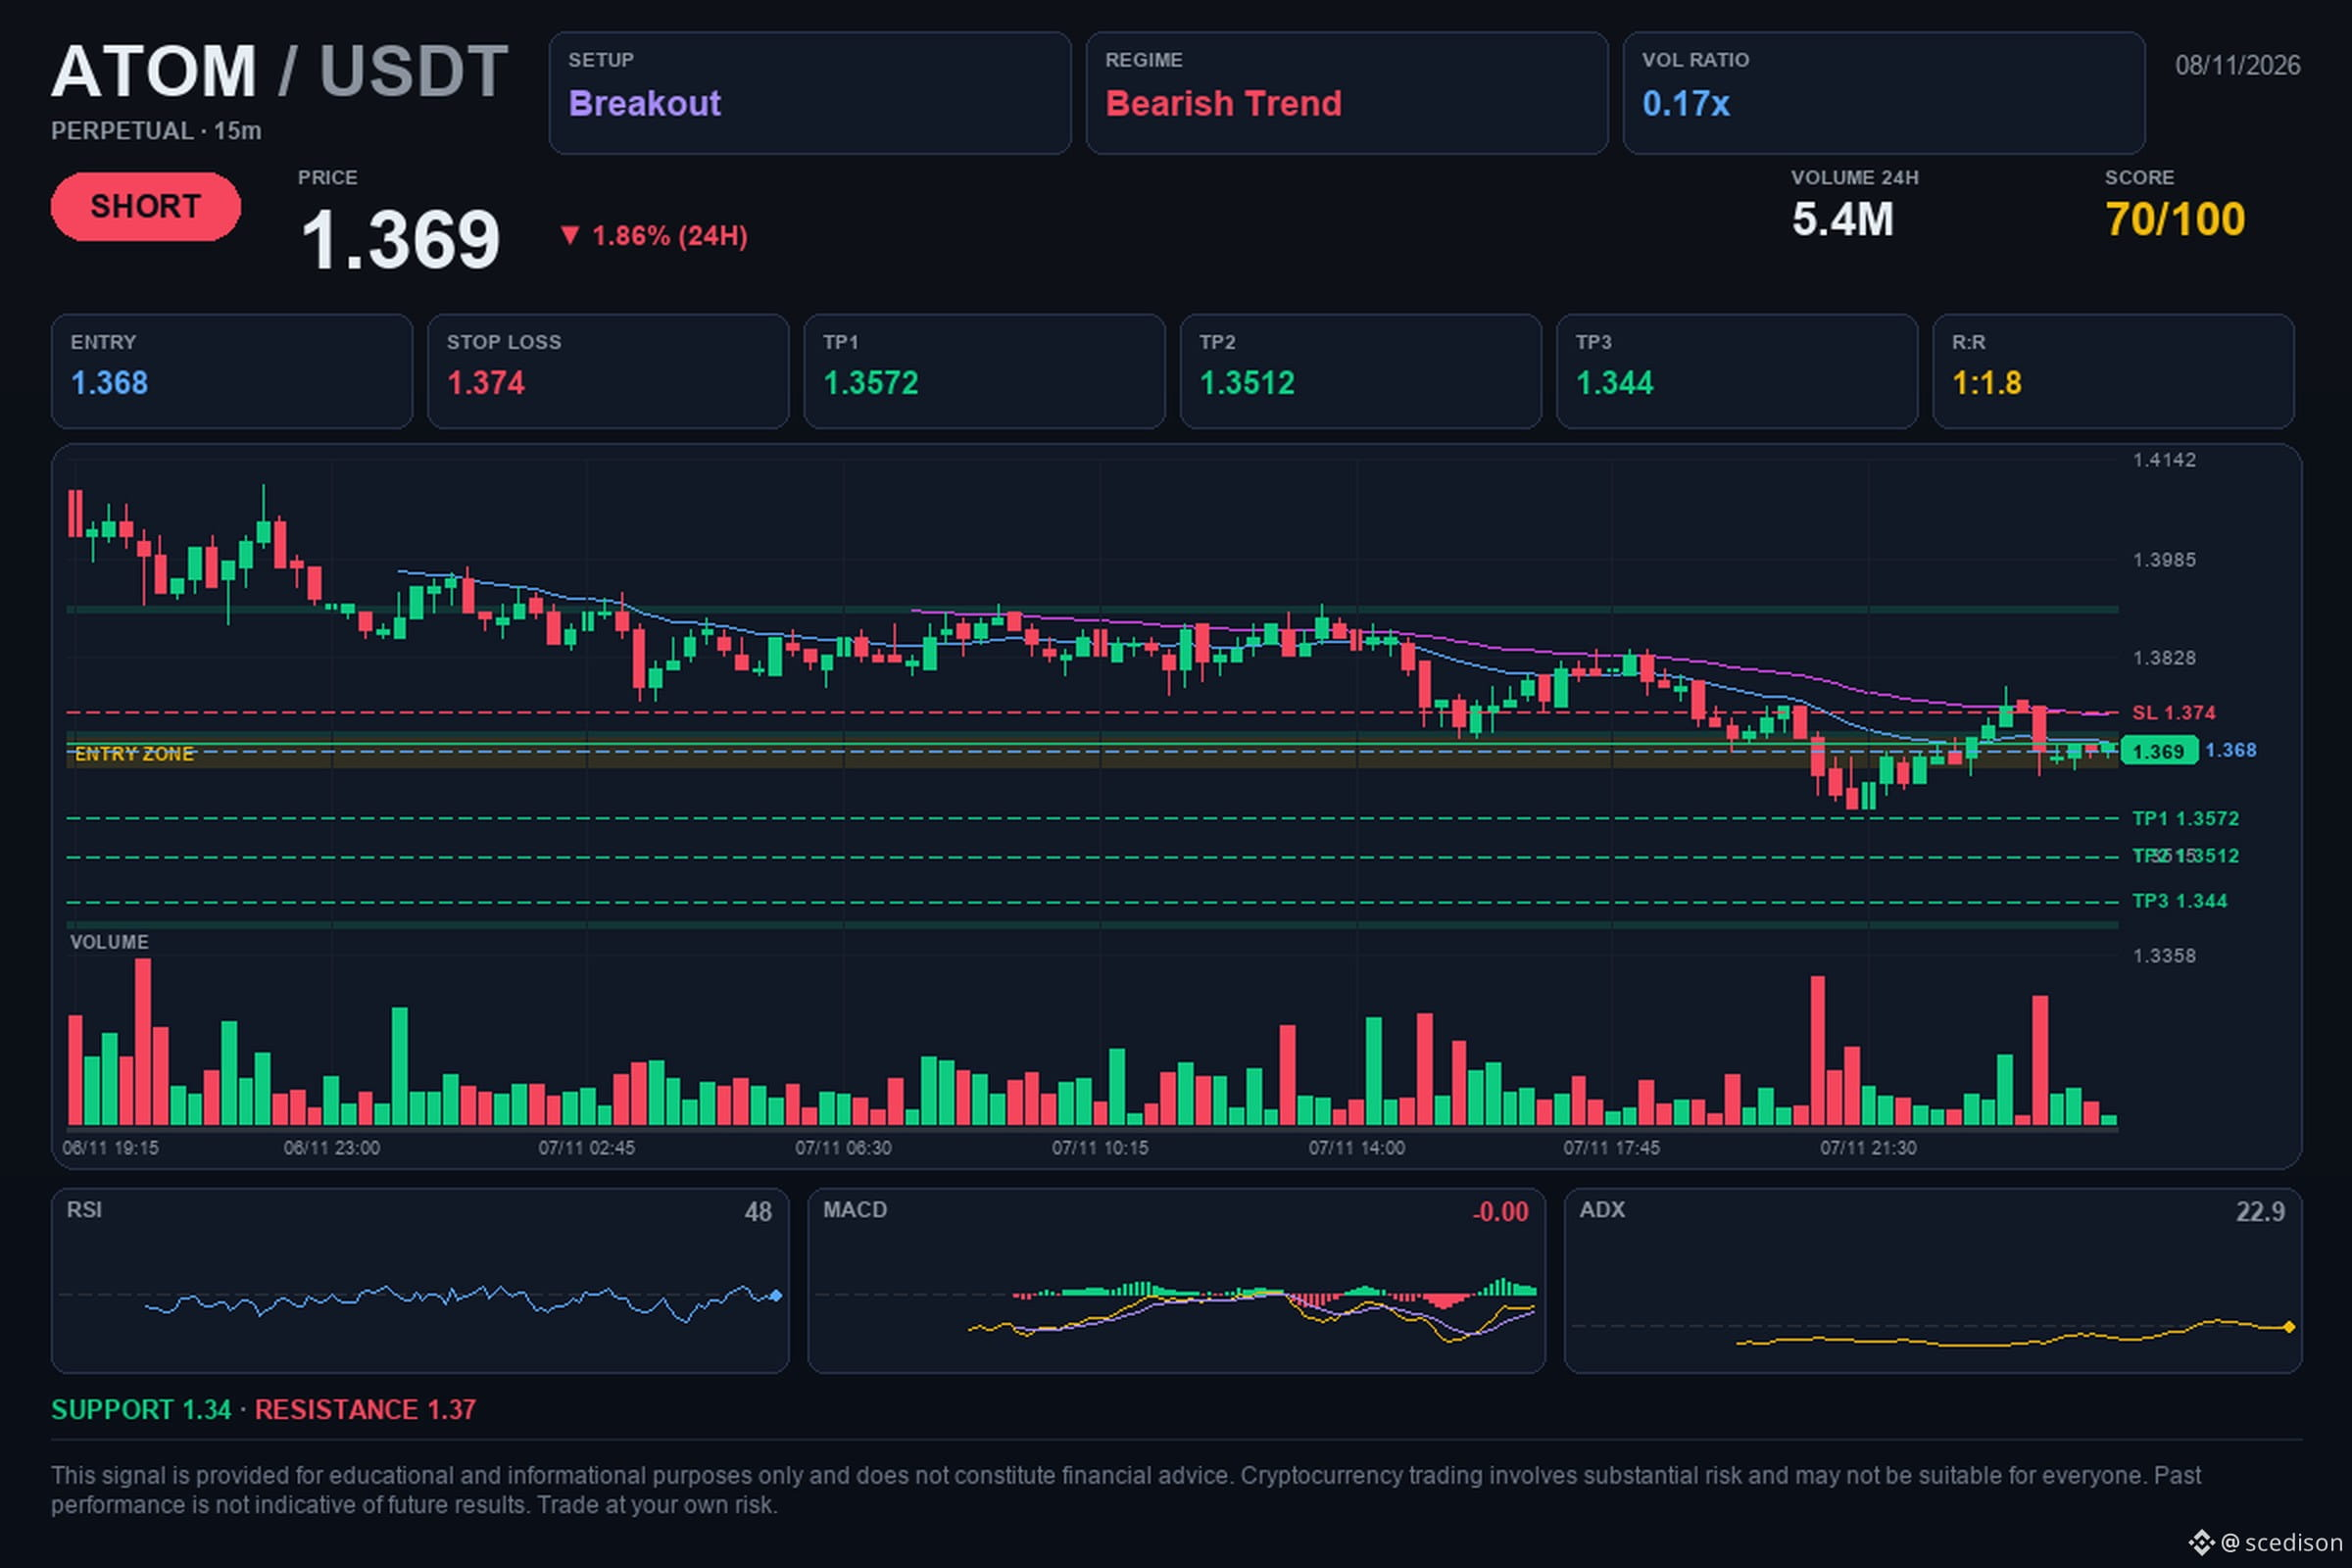
📢 $ATOM / USDT | 🔴 SHORT | ⭐ 70%
🎯 Target: $1.35721247. Will it reach it?
🎯 Trading levels:
🔴 Entry: $1.368
🛑 Stop Loss: $1.374
🏁 TP1: $1.3572
🏁 TP2: $1.3512
🏁 TP3: $1.344
📈 Analysis:
The asset shows a clear bearish structure, with lower lows on the 4-hour timeframes, confirming a prevailing downtrend. A support breakdown is observed, accompanied by a 41.5% increase in relative volume, suggesting greater selling pressure in the market. The combination of this breakdown and weakness in the technical structure reinforces the current bearish outlook.
⚖️ Risk/Reward: 1:1.8
⏱️ Timeframe: 15M
#crypto #ATOM #trading #Bearish
💡 This analysis is for educational purposes and does not constitute financial advice. Do your own research and make your decision calmly.
📢 $ATOM / USDT | 🔴 SHORT | ⭐ 70%
🎯 Target: $1.35721247. Will it reach it?
🎯 Trading levels:
🔴 Entry: $1.368
🛑 Stop Loss: $1.374
🏁 TP1: $1.3572
🏁 TP2: $1.3512
🏁 TP3: $1.344
📈 Analysis:
The asset shows a clear bearish structure, with lower lows on the 4-hour timeframes, confirming a prevailing downtrend. A support breakdown is observed, accompanied by a 41.5% increase in relative volume, suggesting greater selling pressure in the market. The combination of this breakdown and weakness in the technical structure reinforces the current bearish outlook.
⚖️ Risk/Reward: 1:1.8
⏱️ Timeframe: 15M
#crypto #ATOM #trading #Bearish
💡 This analysis is for educational purposes and does not constitute financial advice. Do your own research and make your decision calmly.
🎯 Target: $1.35721247. Will it reach it?
🎯 Trading levels:
🔴 Entry: $1.368
🛑 Stop Loss: $1.374
🏁 TP1: $1.3572
🏁 TP2: $1.3512
🏁 TP3: $1.344
📈 Analysis:
The asset shows a clear bearish structure, with lower lows on the 4-hour timeframes, confirming a prevailing downtrend. A support breakdown is observed, accompanied by a 41.5% increase in relative volume, suggesting greater selling pressure in the market. The combination of this breakdown and weakness in the technical structure reinforces the current bearish outlook.
⚖️ Risk/Reward: 1:1.8
⏱️ Timeframe: 15M
#crypto #ATOM #trading #Bearish
💡 This analysis is for educational purposes and does not constitute financial advice. Do your own research and make your decision calmly.
38
·
--
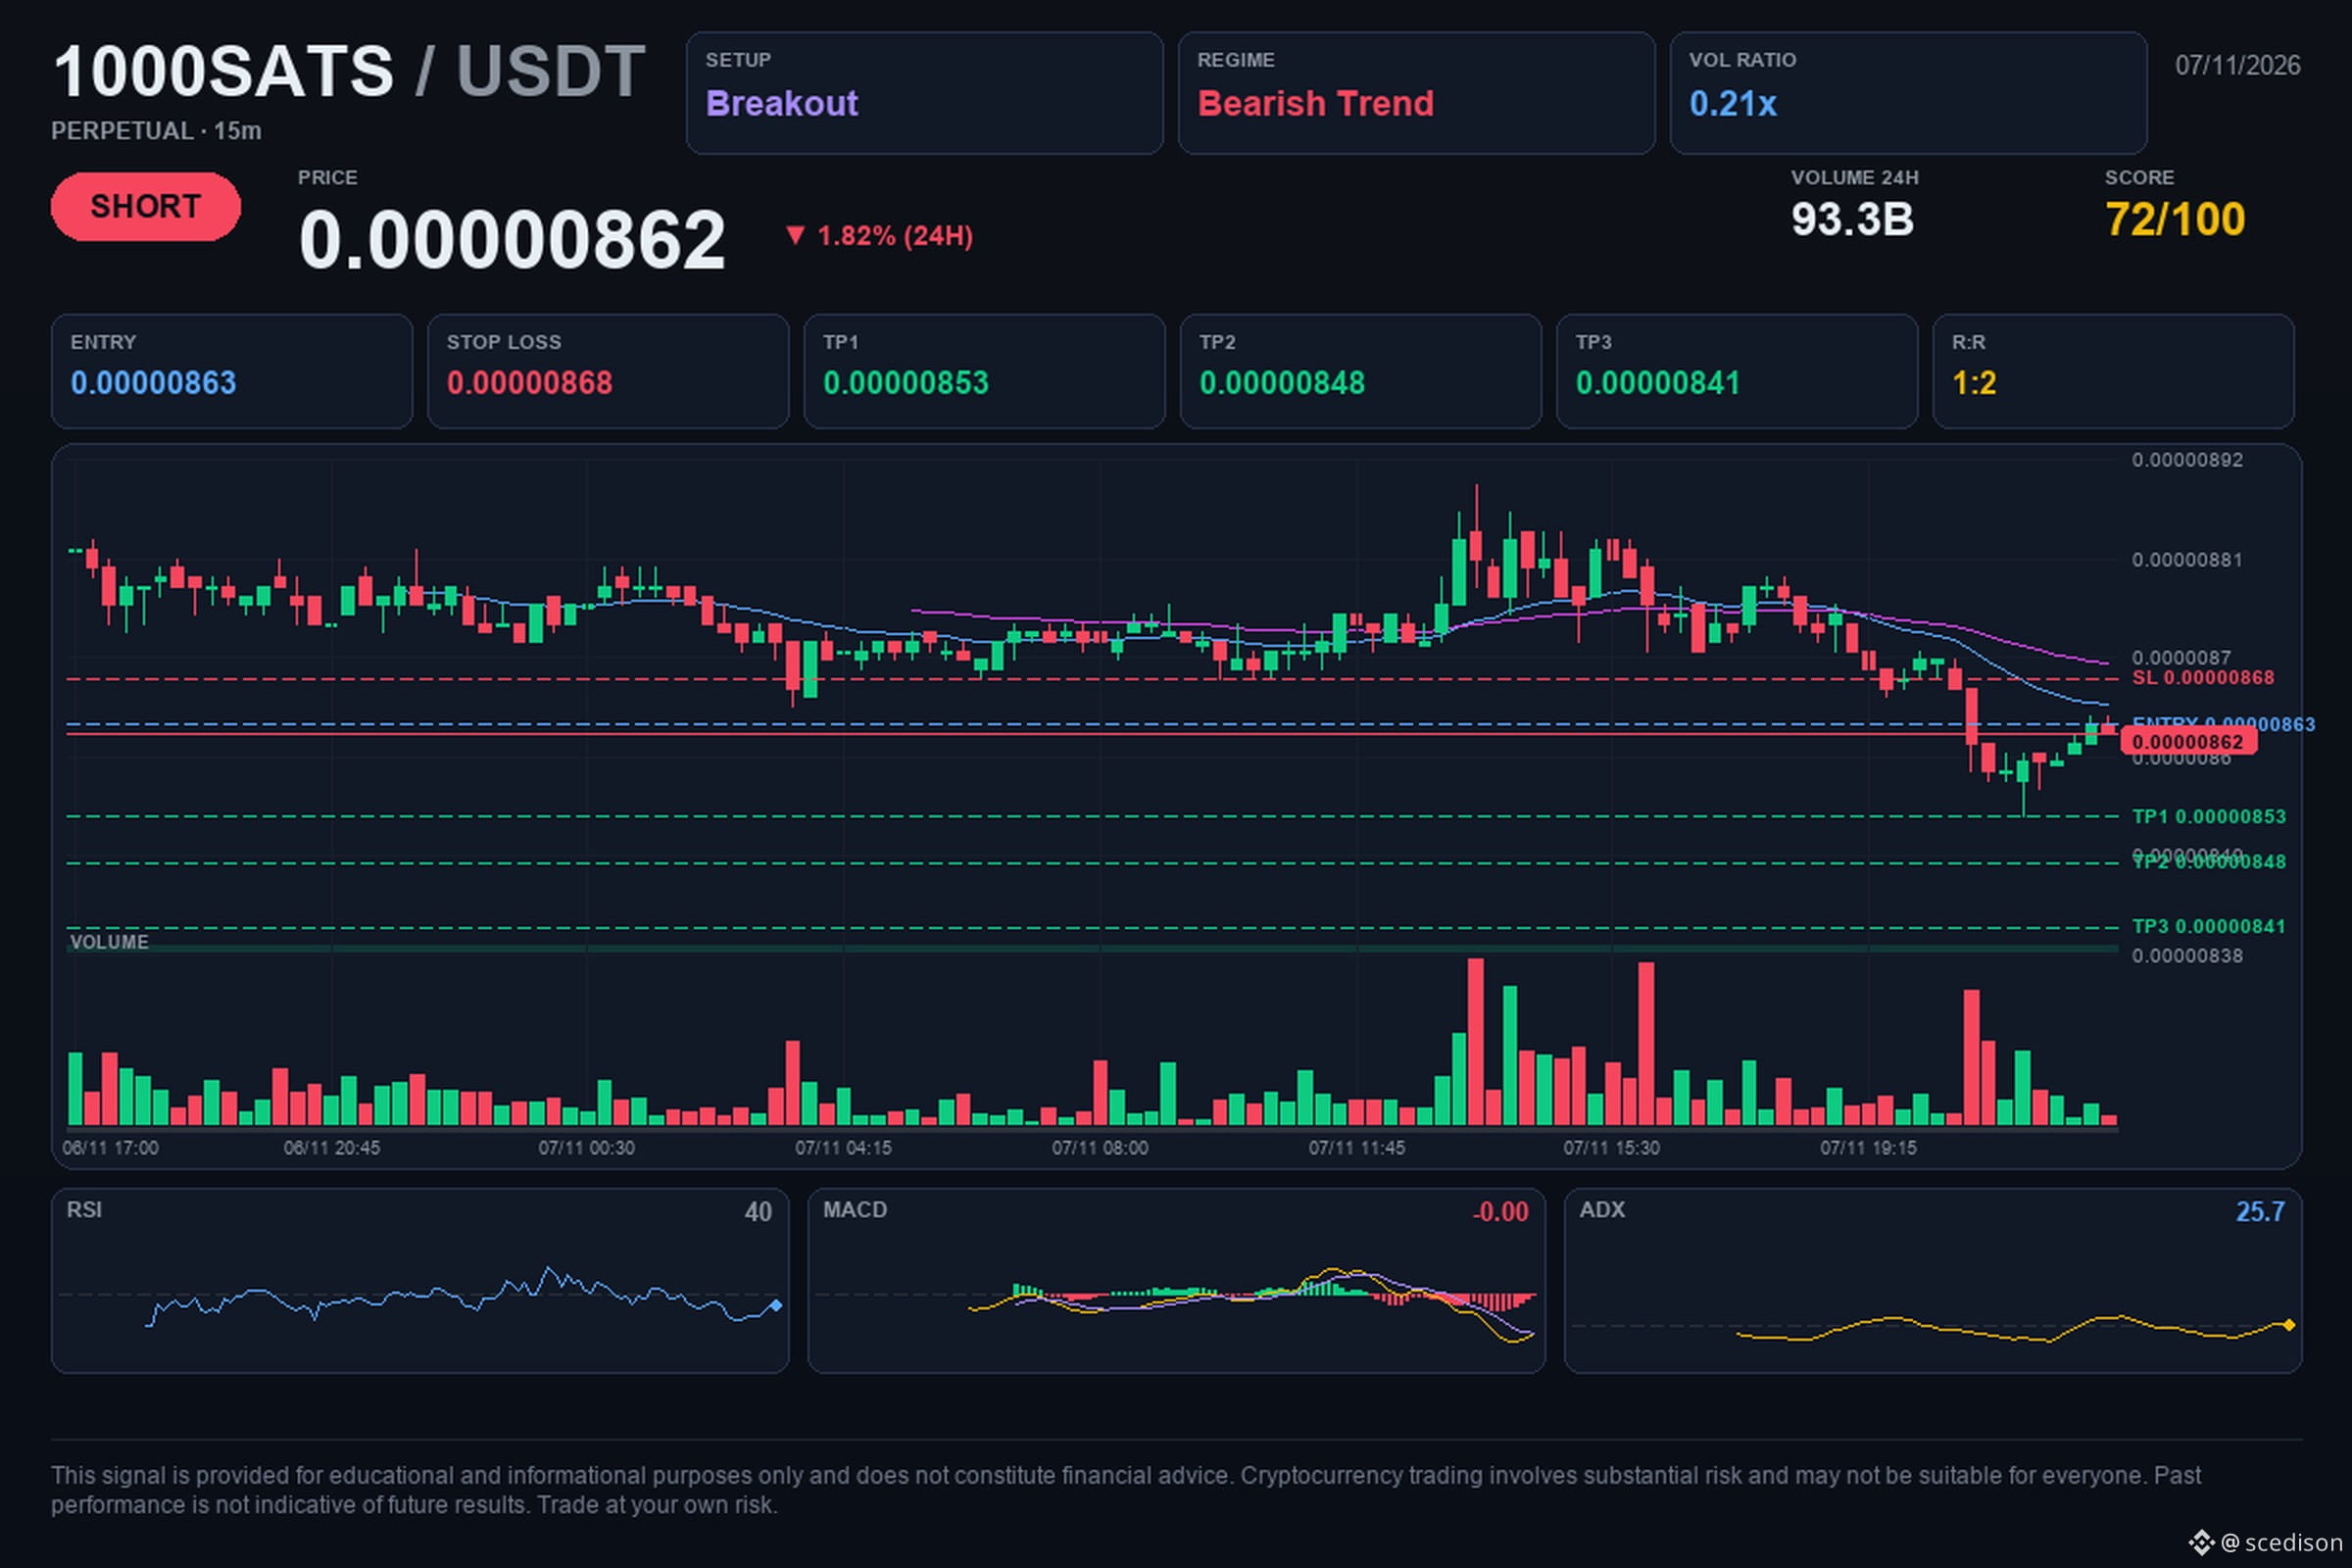
📢 $1000SATS / USDT | 🔴 SHORT | ⭐ 73%
🎯 Target: $8.53e-06. Will it get there?
🎯 Trade levels:
🔴 Entry: $0.00000863
🛑 Stop Loss: $0.00000868
🏁 TP1: $0.00000853
🏁 TP2: $0.00000848
🏁 TP3: $0.00000841
📈 Analysis:
The asset shows a clear bearish structure, with lower lows and lower highs across multiple timeframes, reflecting constant selling pressure. Trading volume has increased 58.2% above its average, suggesting renewed interest in breaking key levels. With the MACD momentum indicator confirming a bearish trend, sellers remain in control of the current movement.
⚖️ Risk/Reward: 1:1.8
⏱️ Timeframe: 15M
💭 A bearish structure is identified when the price forms progressively lower highs and lows, indicating that sellers are stronger than buyers.
#crypto #1000SATS #trading #Bearish
💡 This analysis is for educational purposes and does not constitute financial advice. Do your own research and make your decision calmly.
📢 $1000SATS / USDT | 🔴 SHORT | ⭐ 73%
🎯 Target: $8.53e-06. Will it get there?
🎯 Trade levels:
🔴 Entry: $0.00000863
🛑 Stop Loss: $0.00000868
🏁 TP1: $0.00000853
🏁 TP2: $0.00000848
🏁 TP3: $0.00000841
📈 Analysis:
The asset shows a clear bearish structure, with lower lows and lower highs across multiple timeframes, reflecting constant selling pressure. Trading volume has increased 58.2% above its average, suggesting renewed interest in breaking key levels. With the MACD momentum indicator confirming a bearish trend, sellers remain in control of the current movement.
⚖️ Risk/Reward: 1:1.8
⏱️ Timeframe: 15M
💭 A bearish structure is identified when the price forms progressively lower highs and lows, indicating that sellers are stronger than buyers.
#crypto #1000SATS #trading #Bearish
💡 This analysis is for educational purposes and does not constitute financial advice. Do your own research and make your decision calmly.
🎯 Target: $8.53e-06. Will it get there?
🎯 Trade levels:
🔴 Entry: $0.00000863
🛑 Stop Loss: $0.00000868
🏁 TP1: $0.00000853
🏁 TP2: $0.00000848
🏁 TP3: $0.00000841
📈 Analysis:
The asset shows a clear bearish structure, with lower lows and lower highs across multiple timeframes, reflecting constant selling pressure. Trading volume has increased 58.2% above its average, suggesting renewed interest in breaking key levels. With the MACD momentum indicator confirming a bearish trend, sellers remain in control of the current movement.
⚖️ Risk/Reward: 1:1.8
⏱️ Timeframe: 15M
💭 A bearish structure is identified when the price forms progressively lower highs and lows, indicating that sellers are stronger than buyers.
#crypto #1000SATS #trading #Bearish
💡 This analysis is for educational purposes and does not constitute financial advice. Do your own research and make your decision calmly.
9
·
--
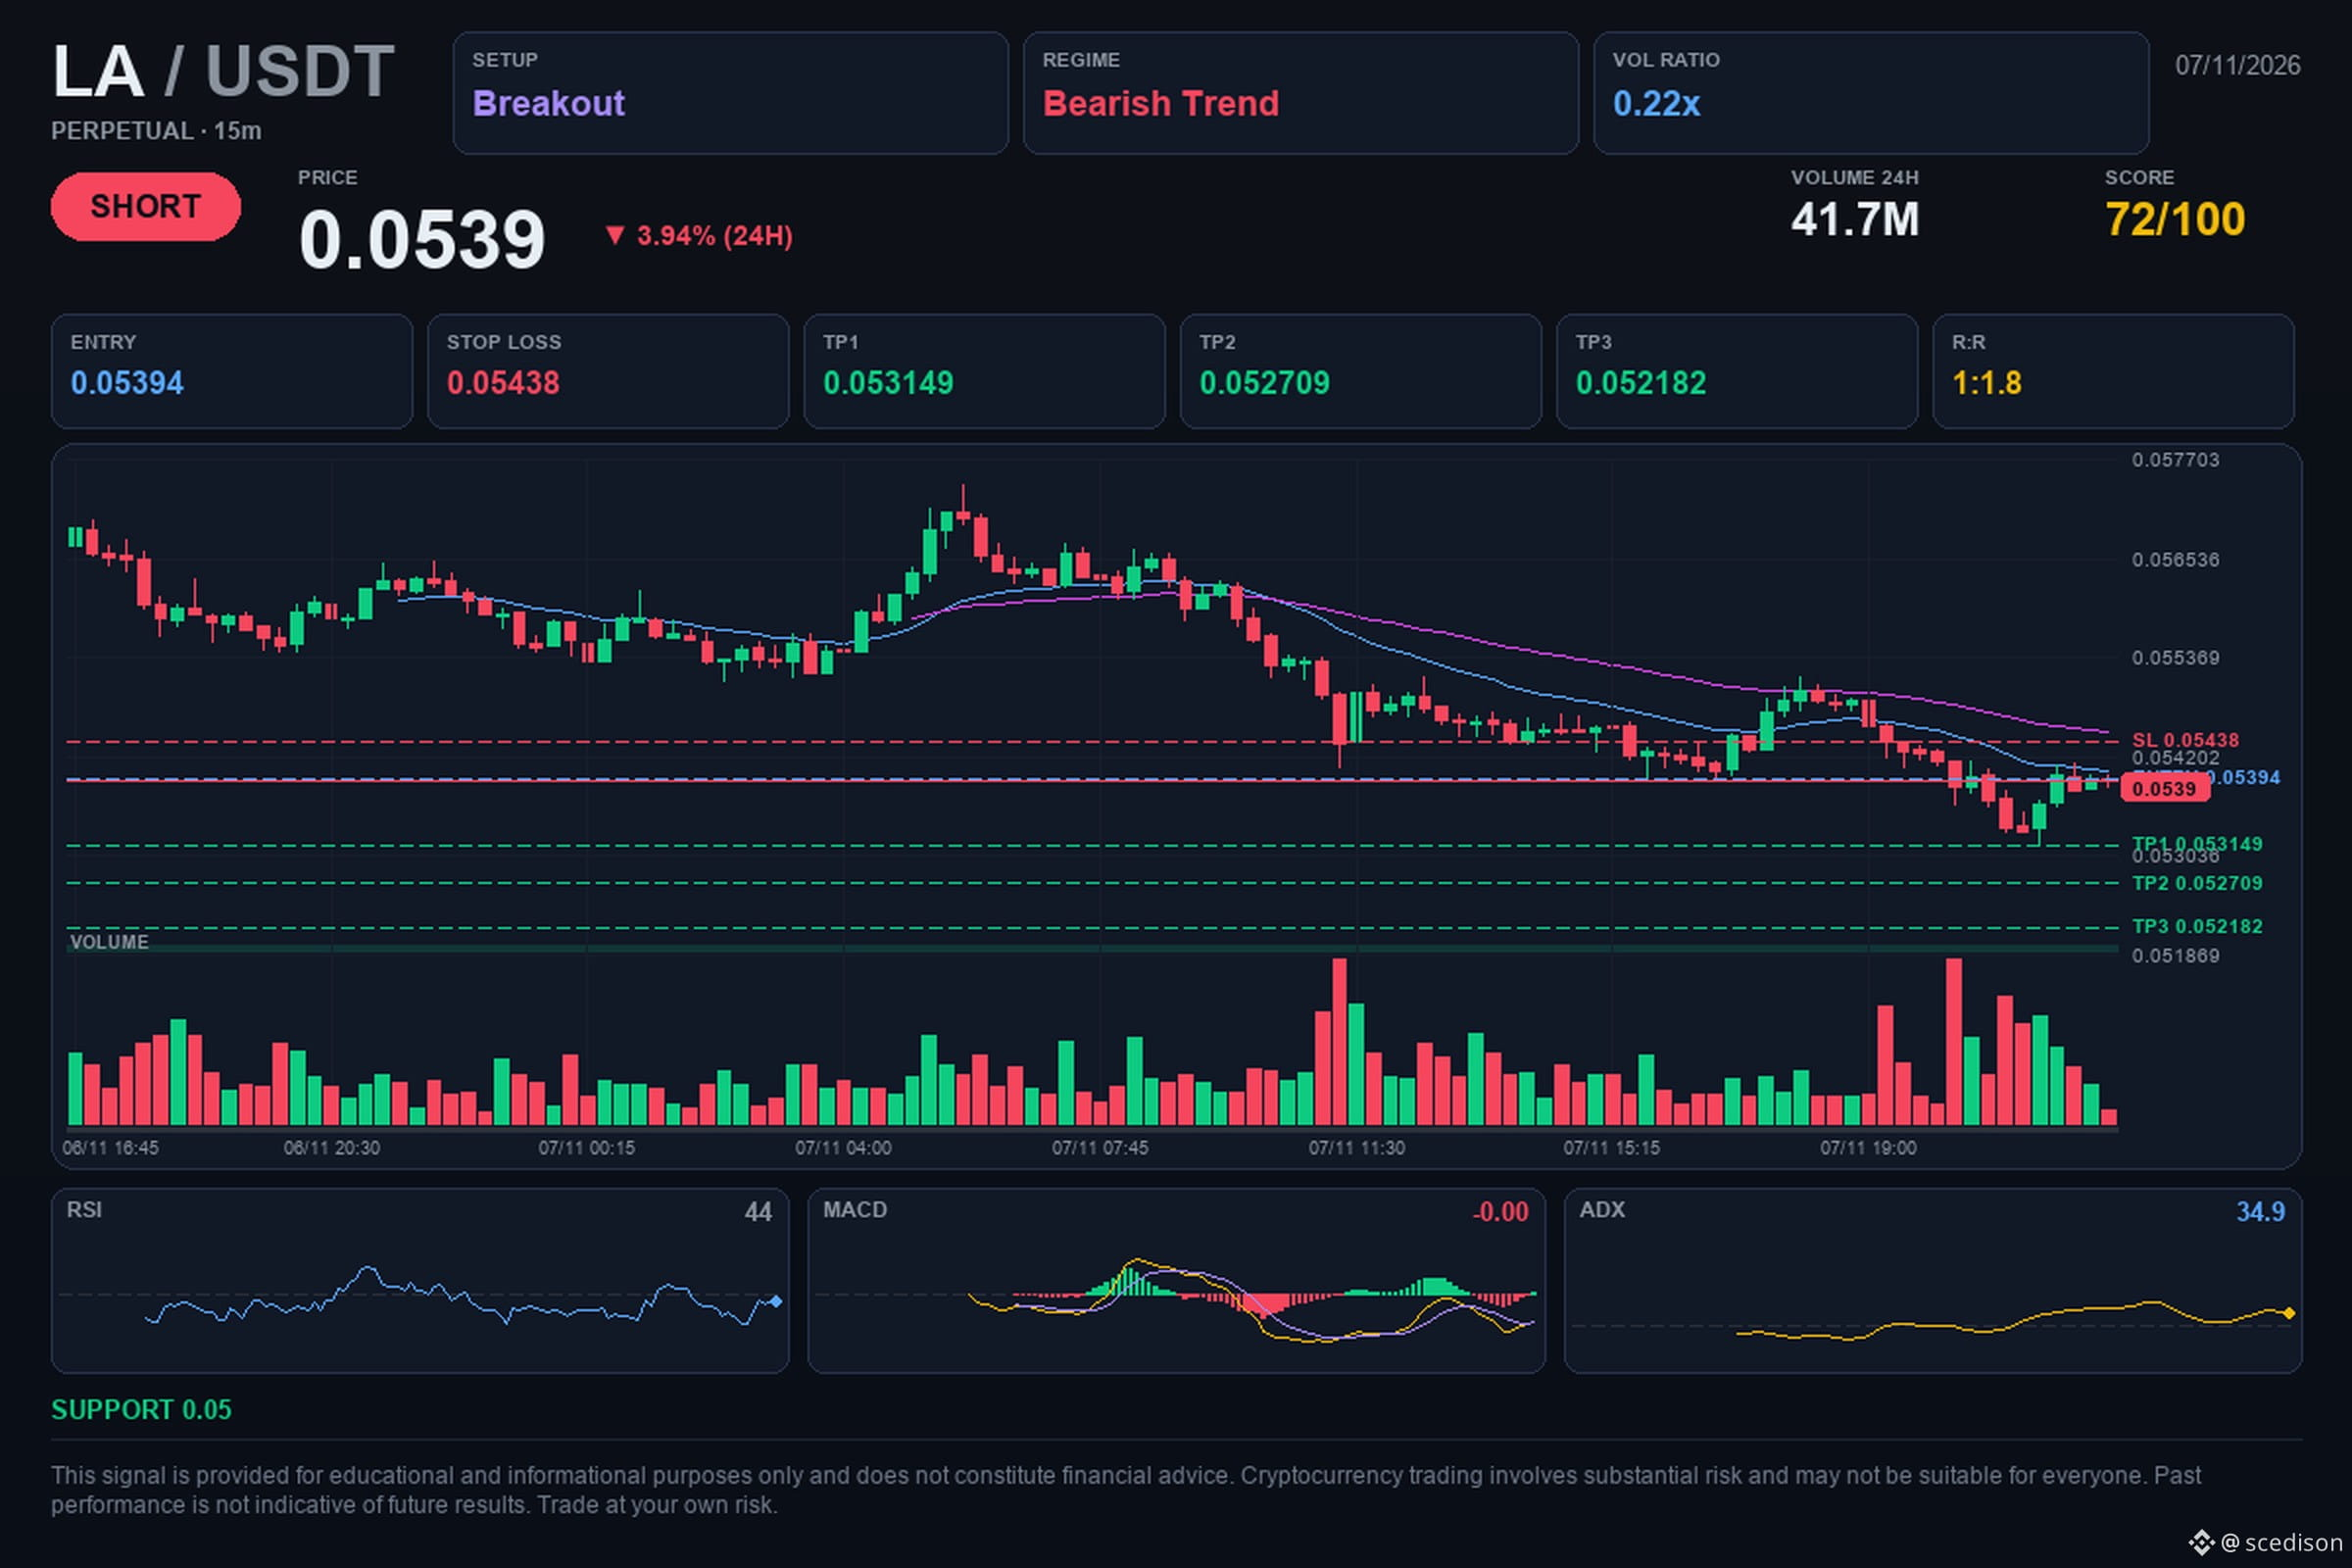
📢 $LA / USDT | 🔴 SHORT | ⭐ 73%
🎯 Target: $0.05314872. Will it get there?
🎯 Trading levels:
🔴 Entry: $0.05394
🛑 Stop Loss: $0.05438
🏁 TP1: $0.053149
🏁 TP2: $0.052709
🏁 TP3: $0.052182
📈 Analysis:
The asset shows a clear bearish structure with multiple confirmations across different timeframes. A break of key support levels is visible, accompanied by a significant increase in trading volume, suggesting greater selling pressure in the market. In addition, the momentum indicator confirms the current trend with a bearish setup, supporting the scenario of continued movement toward the stated target.
⚖️ Risk/Reward: 1:1.8
⏱️ Timeframe: 15M
💭 The elevated relative volume indicates that participant activity is higher than usual, which often accompanies breakouts in price structure.
#crypto #LA #trading #Bearish
💡 This analysis is for educational purposes and does not constitute financial advice. Do your own research and make your decision calmly.
📢 $LA / USDT | 🔴 SHORT | ⭐ 73%
🎯 Target: $0.05314872. Will it get there?
🎯 Trading levels:
🔴 Entry: $0.05394
🛑 Stop Loss: $0.05438
🏁 TP1: $0.053149
🏁 TP2: $0.052709
🏁 TP3: $0.052182
📈 Analysis:
The asset shows a clear bearish structure with multiple confirmations across different timeframes. A break of key support levels is visible, accompanied by a significant increase in trading volume, suggesting greater selling pressure in the market. In addition, the momentum indicator confirms the current trend with a bearish setup, supporting the scenario of continued movement toward the stated target.
⚖️ Risk/Reward: 1:1.8
⏱️ Timeframe: 15M
💭 The elevated relative volume indicates that participant activity is higher than usual, which often accompanies breakouts in price structure.
#crypto #LA #trading #Bearish
💡 This analysis is for educational purposes and does not constitute financial advice. Do your own research and make your decision calmly.
🎯 Target: $0.05314872. Will it get there?
🎯 Trading levels:
🔴 Entry: $0.05394
🛑 Stop Loss: $0.05438
🏁 TP1: $0.053149
🏁 TP2: $0.052709
🏁 TP3: $0.052182
📈 Analysis:
The asset shows a clear bearish structure with multiple confirmations across different timeframes. A break of key support levels is visible, accompanied by a significant increase in trading volume, suggesting greater selling pressure in the market. In addition, the momentum indicator confirms the current trend with a bearish setup, supporting the scenario of continued movement toward the stated target.
⚖️ Risk/Reward: 1:1.8
⏱️ Timeframe: 15M
💭 The elevated relative volume indicates that participant activity is higher than usual, which often accompanies breakouts in price structure.
#crypto #LA #trading #Bearish
💡 This analysis is for educational purposes and does not constitute financial advice. Do your own research and make your decision calmly.
4
·
--
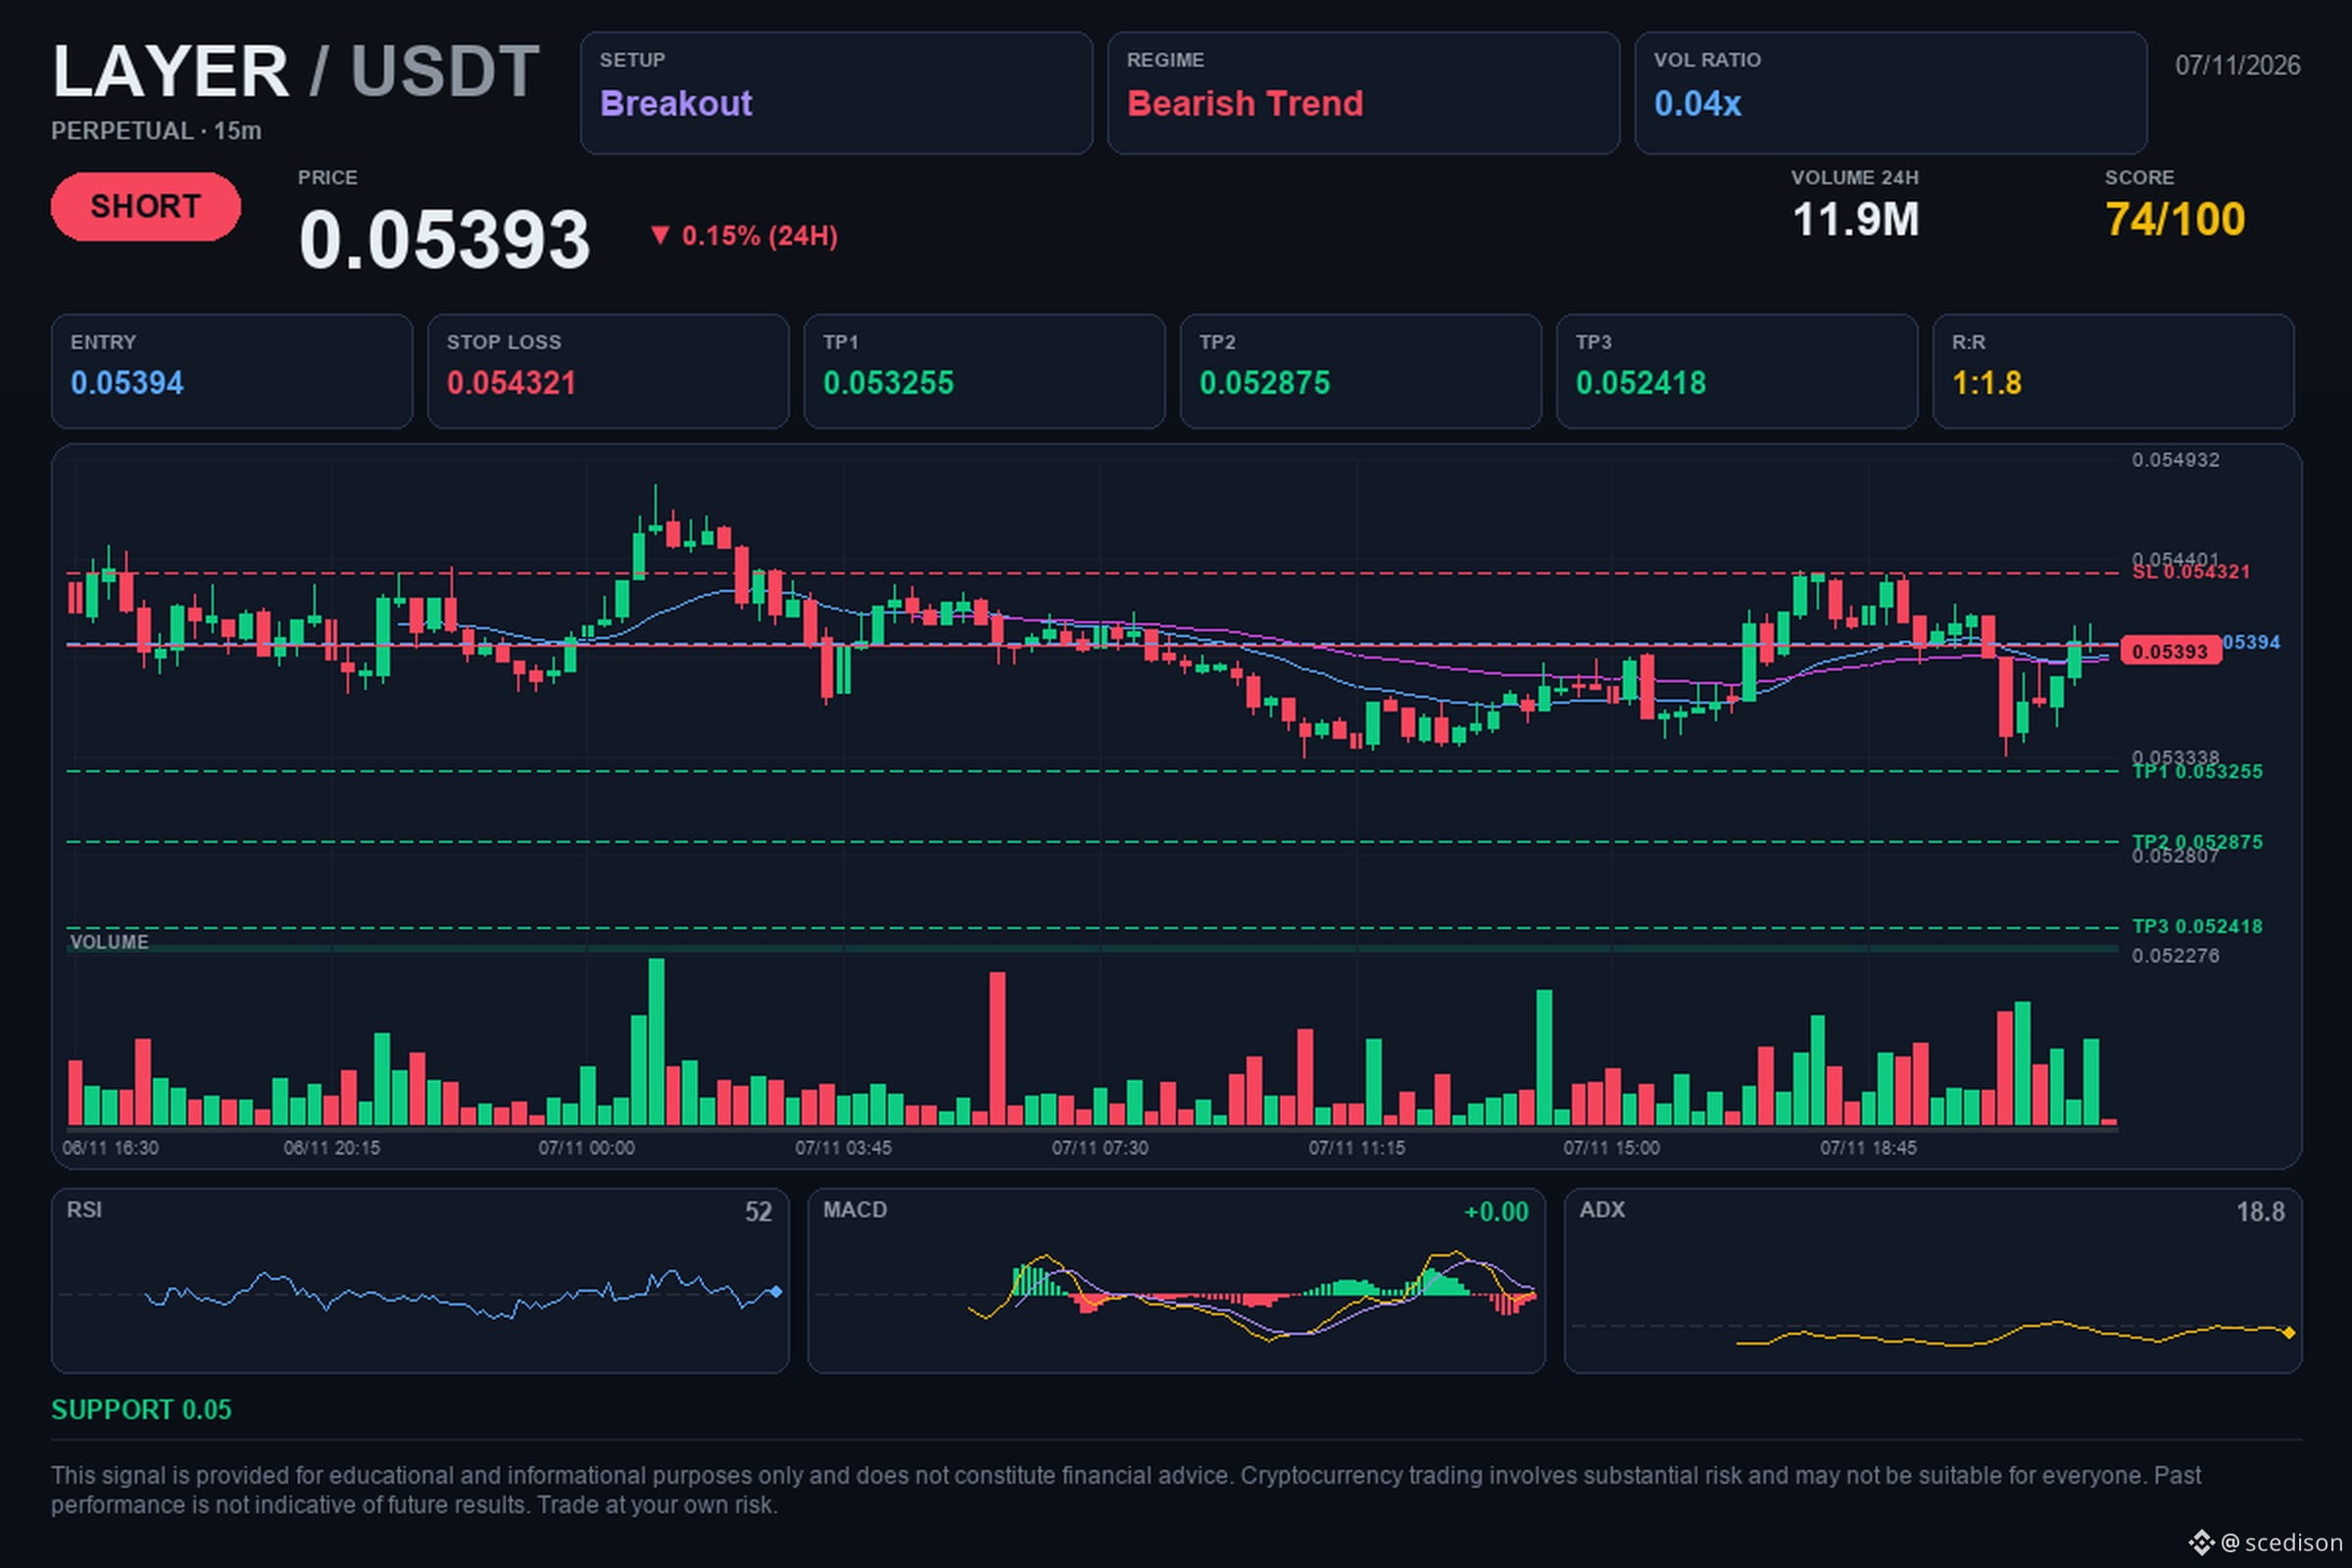
📢 $LAYER / USDT | 🔴 SHORT | ⭐ 74%
🎯 Target: $0.05325506. Will it get there?
🎯 Trade levels:
🔴 Entry: $0.05394
🛑 Stop Loss: $0.054321
🏁 TP1: $0.053255
🏁 TP2: $0.052875
🏁 TP3: $0.052418
📈 Analysis:
The market structure shows a clear downtrend, with lower highs forming and support breaking on the 4-hour and 15-minute timeframes. Trading volume has increased by 72.8%, suggesting growing interest from sellers in this move. With selling pressure backed by the current technical structure, the market is looking to continue its path toward lower levels.
⚖️ Risk/Reward: 1:1.8
⏱️ Timeframe: 15M
💭 A “lower high” occurs when the price reaches a peak lower than the previous one, which is usually a sign of weakness in the prior uptrend.
#crypto #LAYER #trading #Bearish
💡 This analysis is for educational purposes and does not constitute financial advice. Do your own research and make your decision calmly.
📢 $LAYER / USDT | 🔴 SHORT | ⭐ 74%
🎯 Target: $0.05325506. Will it get there?
🎯 Trade levels:
🔴 Entry: $0.05394
🛑 Stop Loss: $0.054321
🏁 TP1: $0.053255
🏁 TP2: $0.052875
🏁 TP3: $0.052418
📈 Analysis:
The market structure shows a clear downtrend, with lower highs forming and support breaking on the 4-hour and 15-minute timeframes. Trading volume has increased by 72.8%, suggesting growing interest from sellers in this move. With selling pressure backed by the current technical structure, the market is looking to continue its path toward lower levels.
⚖️ Risk/Reward: 1:1.8
⏱️ Timeframe: 15M
💭 A “lower high” occurs when the price reaches a peak lower than the previous one, which is usually a sign of weakness in the prior uptrend.
#crypto #LAYER #trading #Bearish
💡 This analysis is for educational purposes and does not constitute financial advice. Do your own research and make your decision calmly.
🎯 Target: $0.05325506. Will it get there?
🎯 Trade levels:
🔴 Entry: $0.05394
🛑 Stop Loss: $0.054321
🏁 TP1: $0.053255
🏁 TP2: $0.052875
🏁 TP3: $0.052418
📈 Analysis:
The market structure shows a clear downtrend, with lower highs forming and support breaking on the 4-hour and 15-minute timeframes. Trading volume has increased by 72.8%, suggesting growing interest from sellers in this move. With selling pressure backed by the current technical structure, the market is looking to continue its path toward lower levels.
⚖️ Risk/Reward: 1:1.8
⏱️ Timeframe: 15M
💭 A “lower high” occurs when the price reaches a peak lower than the previous one, which is usually a sign of weakness in the prior uptrend.
#crypto #LAYER #trading #Bearish
💡 This analysis is for educational purposes and does not constitute financial advice. Do your own research and make your decision calmly.
4
·
--
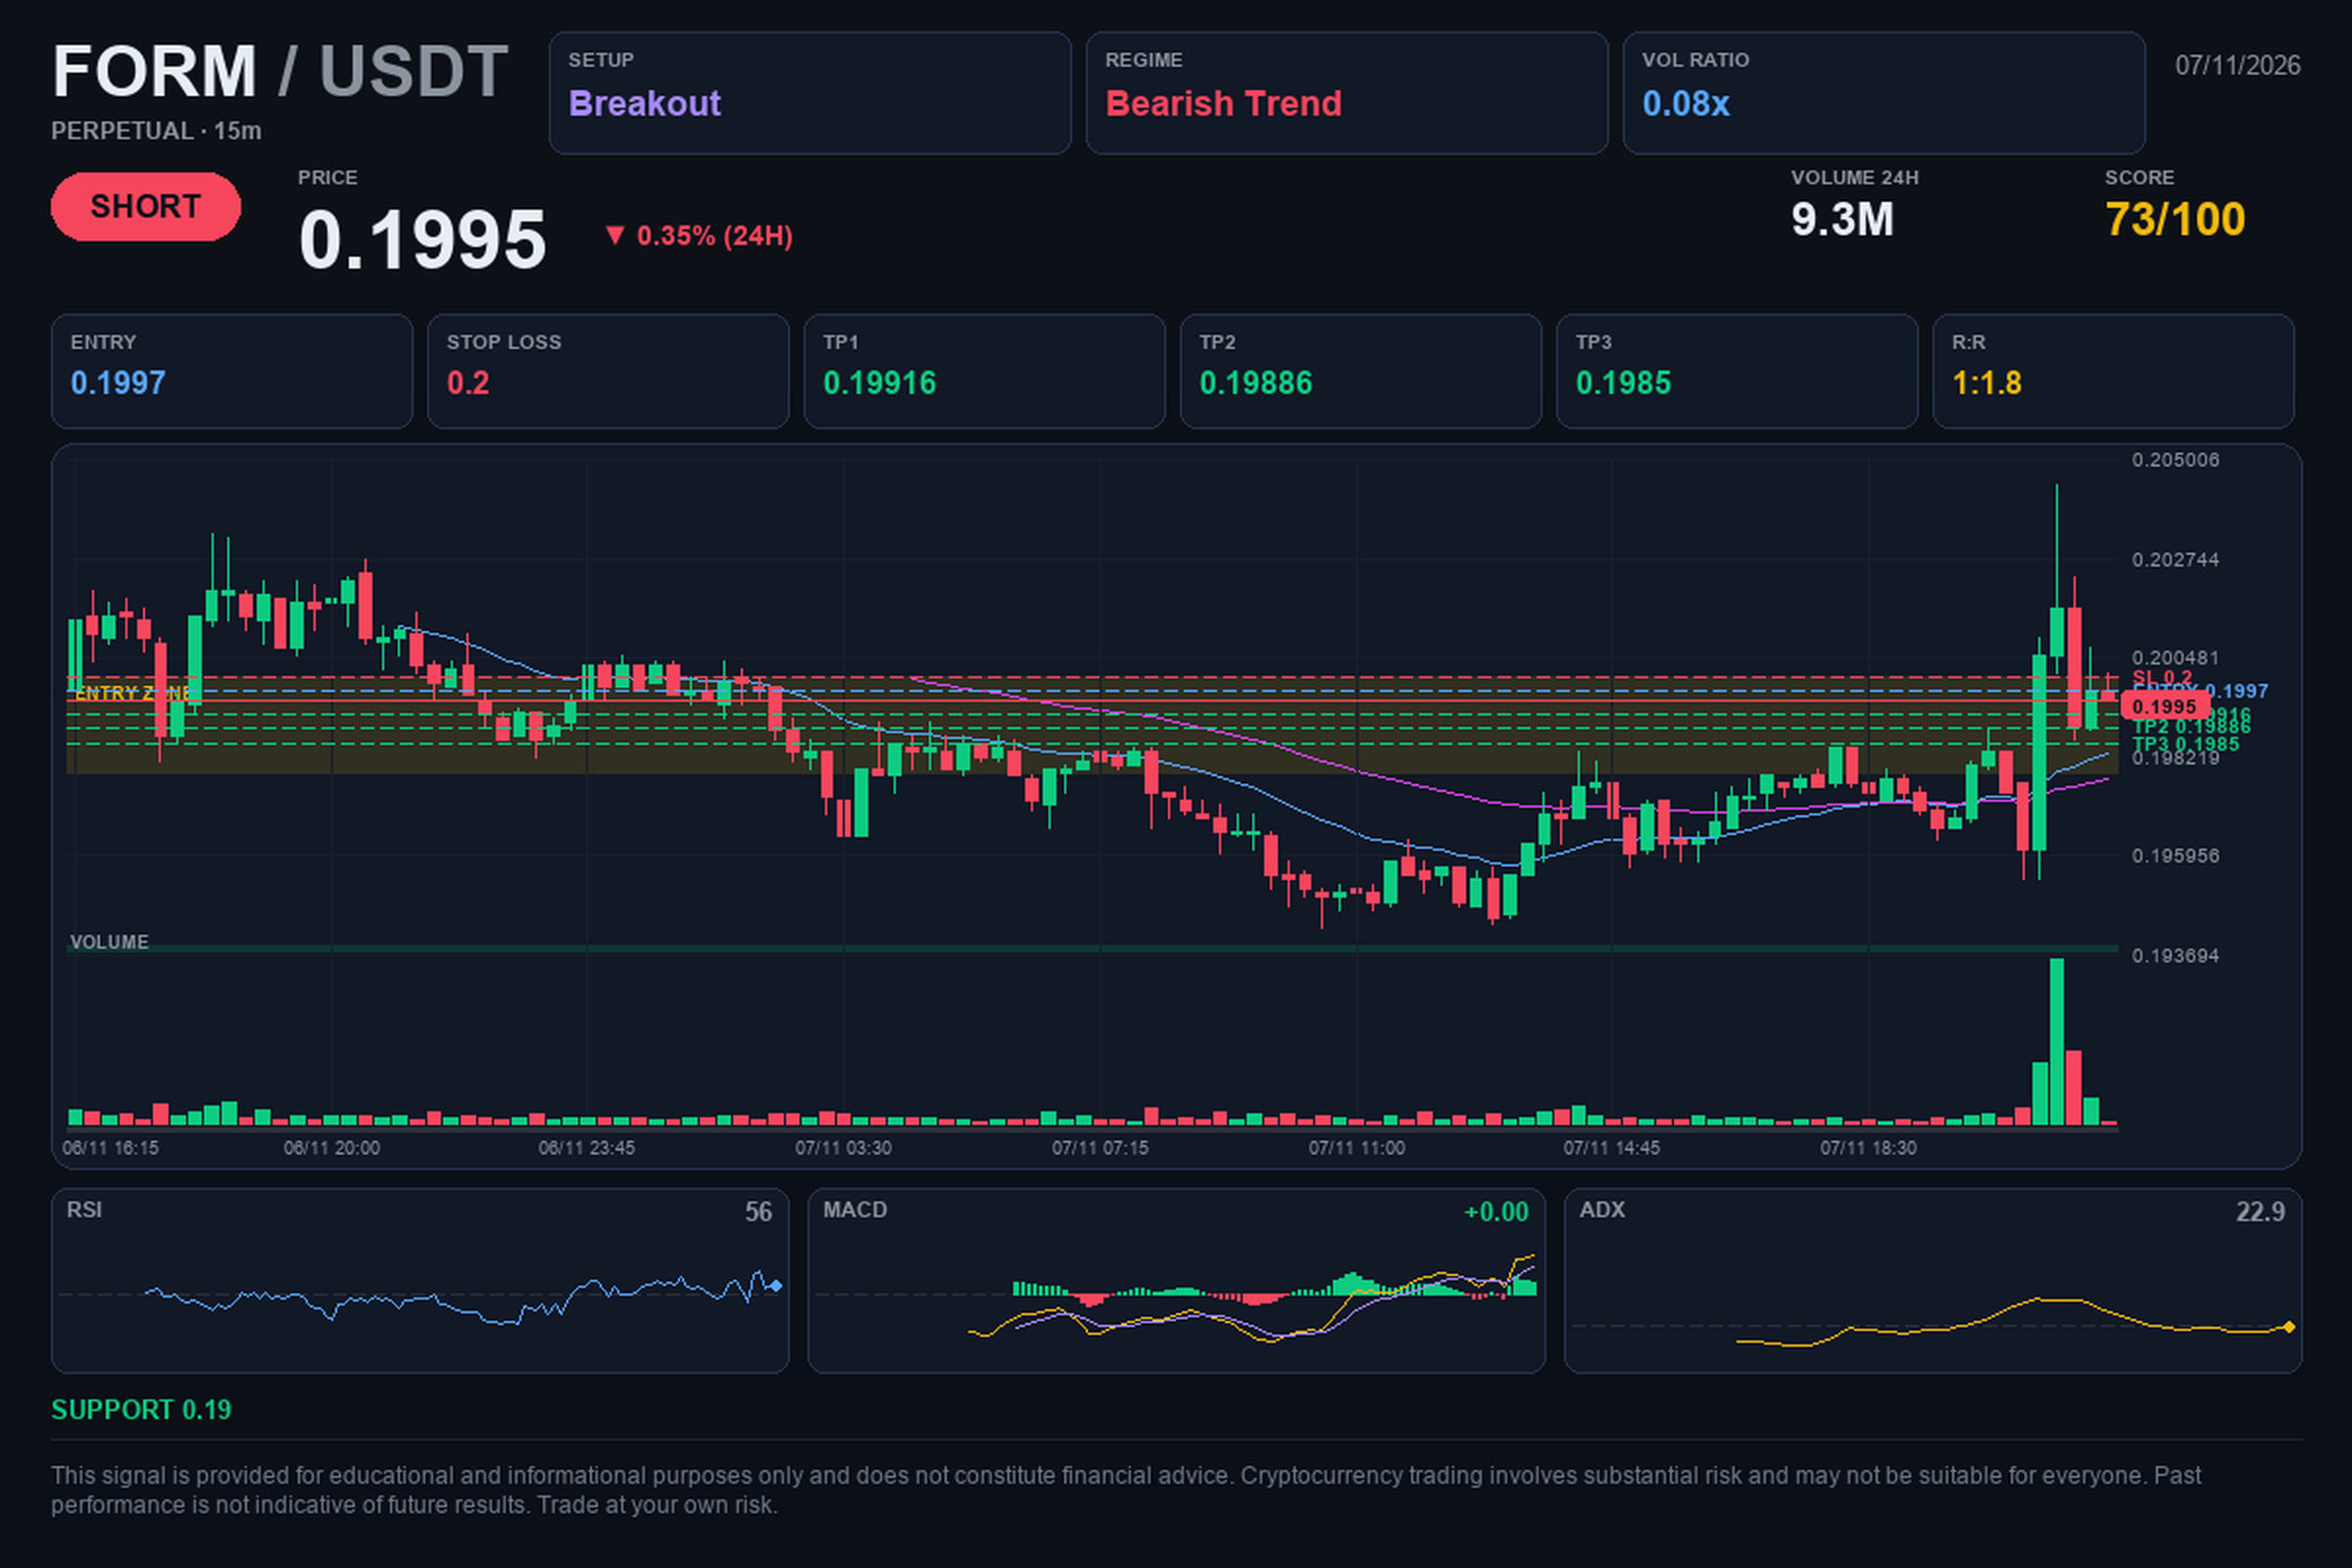
📢 $FORM / USDT | 🔴 SHORT | ⭐ 74%
🎯 Target: $0.19916. Will it reach it?
🎯 Trading levels:
🔴 Entry: $0.1997
🛑 Stop Loss: $0.2
🏁 TP1: $0.19916
🏁 TP2: $0.19886
🏁 TP3: $0.1985
📈 Analysis:
The market structure shows a clear downtrend, confirmed by patterns of lower highs and support breaks on the 4-hour timeframes. A significant increase in trading volume can be observed, supporting the current selling pressure following the break below the support zone at 0.2. This bearish move remains within an established trend regime, while open interest shows a slight decline.
⚖️ Risk/Reward: 1:1.8
⏱️ Timeframe: 15M
💭 Elevated relative volume indicates greater-than-usual participation, which often lends more significance to a break of key levels.
#crypto #FORM #trading #Bearish
💡 This analysis is for educational purposes and does not constitute financial advice. Do your own research and make your decision calmly.
📢 $FORM / USDT | 🔴 SHORT | ⭐ 74%
🎯 Target: $0.19916. Will it reach it?
🎯 Trading levels:
🔴 Entry: $0.1997
🛑 Stop Loss: $0.2
🏁 TP1: $0.19916
🏁 TP2: $0.19886
🏁 TP3: $0.1985
📈 Analysis:
The market structure shows a clear downtrend, confirmed by patterns of lower highs and support breaks on the 4-hour timeframes. A significant increase in trading volume can be observed, supporting the current selling pressure following the break below the support zone at 0.2. This bearish move remains within an established trend regime, while open interest shows a slight decline.
⚖️ Risk/Reward: 1:1.8
⏱️ Timeframe: 15M
💭 Elevated relative volume indicates greater-than-usual participation, which often lends more significance to a break of key levels.
#crypto #FORM #trading #Bearish
💡 This analysis is for educational purposes and does not constitute financial advice. Do your own research and make your decision calmly.
🎯 Target: $0.19916. Will it reach it?
🎯 Trading levels:
🔴 Entry: $0.1997
🛑 Stop Loss: $0.2
🏁 TP1: $0.19916
🏁 TP2: $0.19886
🏁 TP3: $0.1985
📈 Analysis:
The market structure shows a clear downtrend, confirmed by patterns of lower highs and support breaks on the 4-hour timeframes. A significant increase in trading volume can be observed, supporting the current selling pressure following the break below the support zone at 0.2. This bearish move remains within an established trend regime, while open interest shows a slight decline.
⚖️ Risk/Reward: 1:1.8
⏱️ Timeframe: 15M
💭 Elevated relative volume indicates greater-than-usual participation, which often lends more significance to a break of key levels.
#crypto #FORM #trading #Bearish
💡 This analysis is for educational purposes and does not constitute financial advice. Do your own research and make your decision calmly.
3
·
--
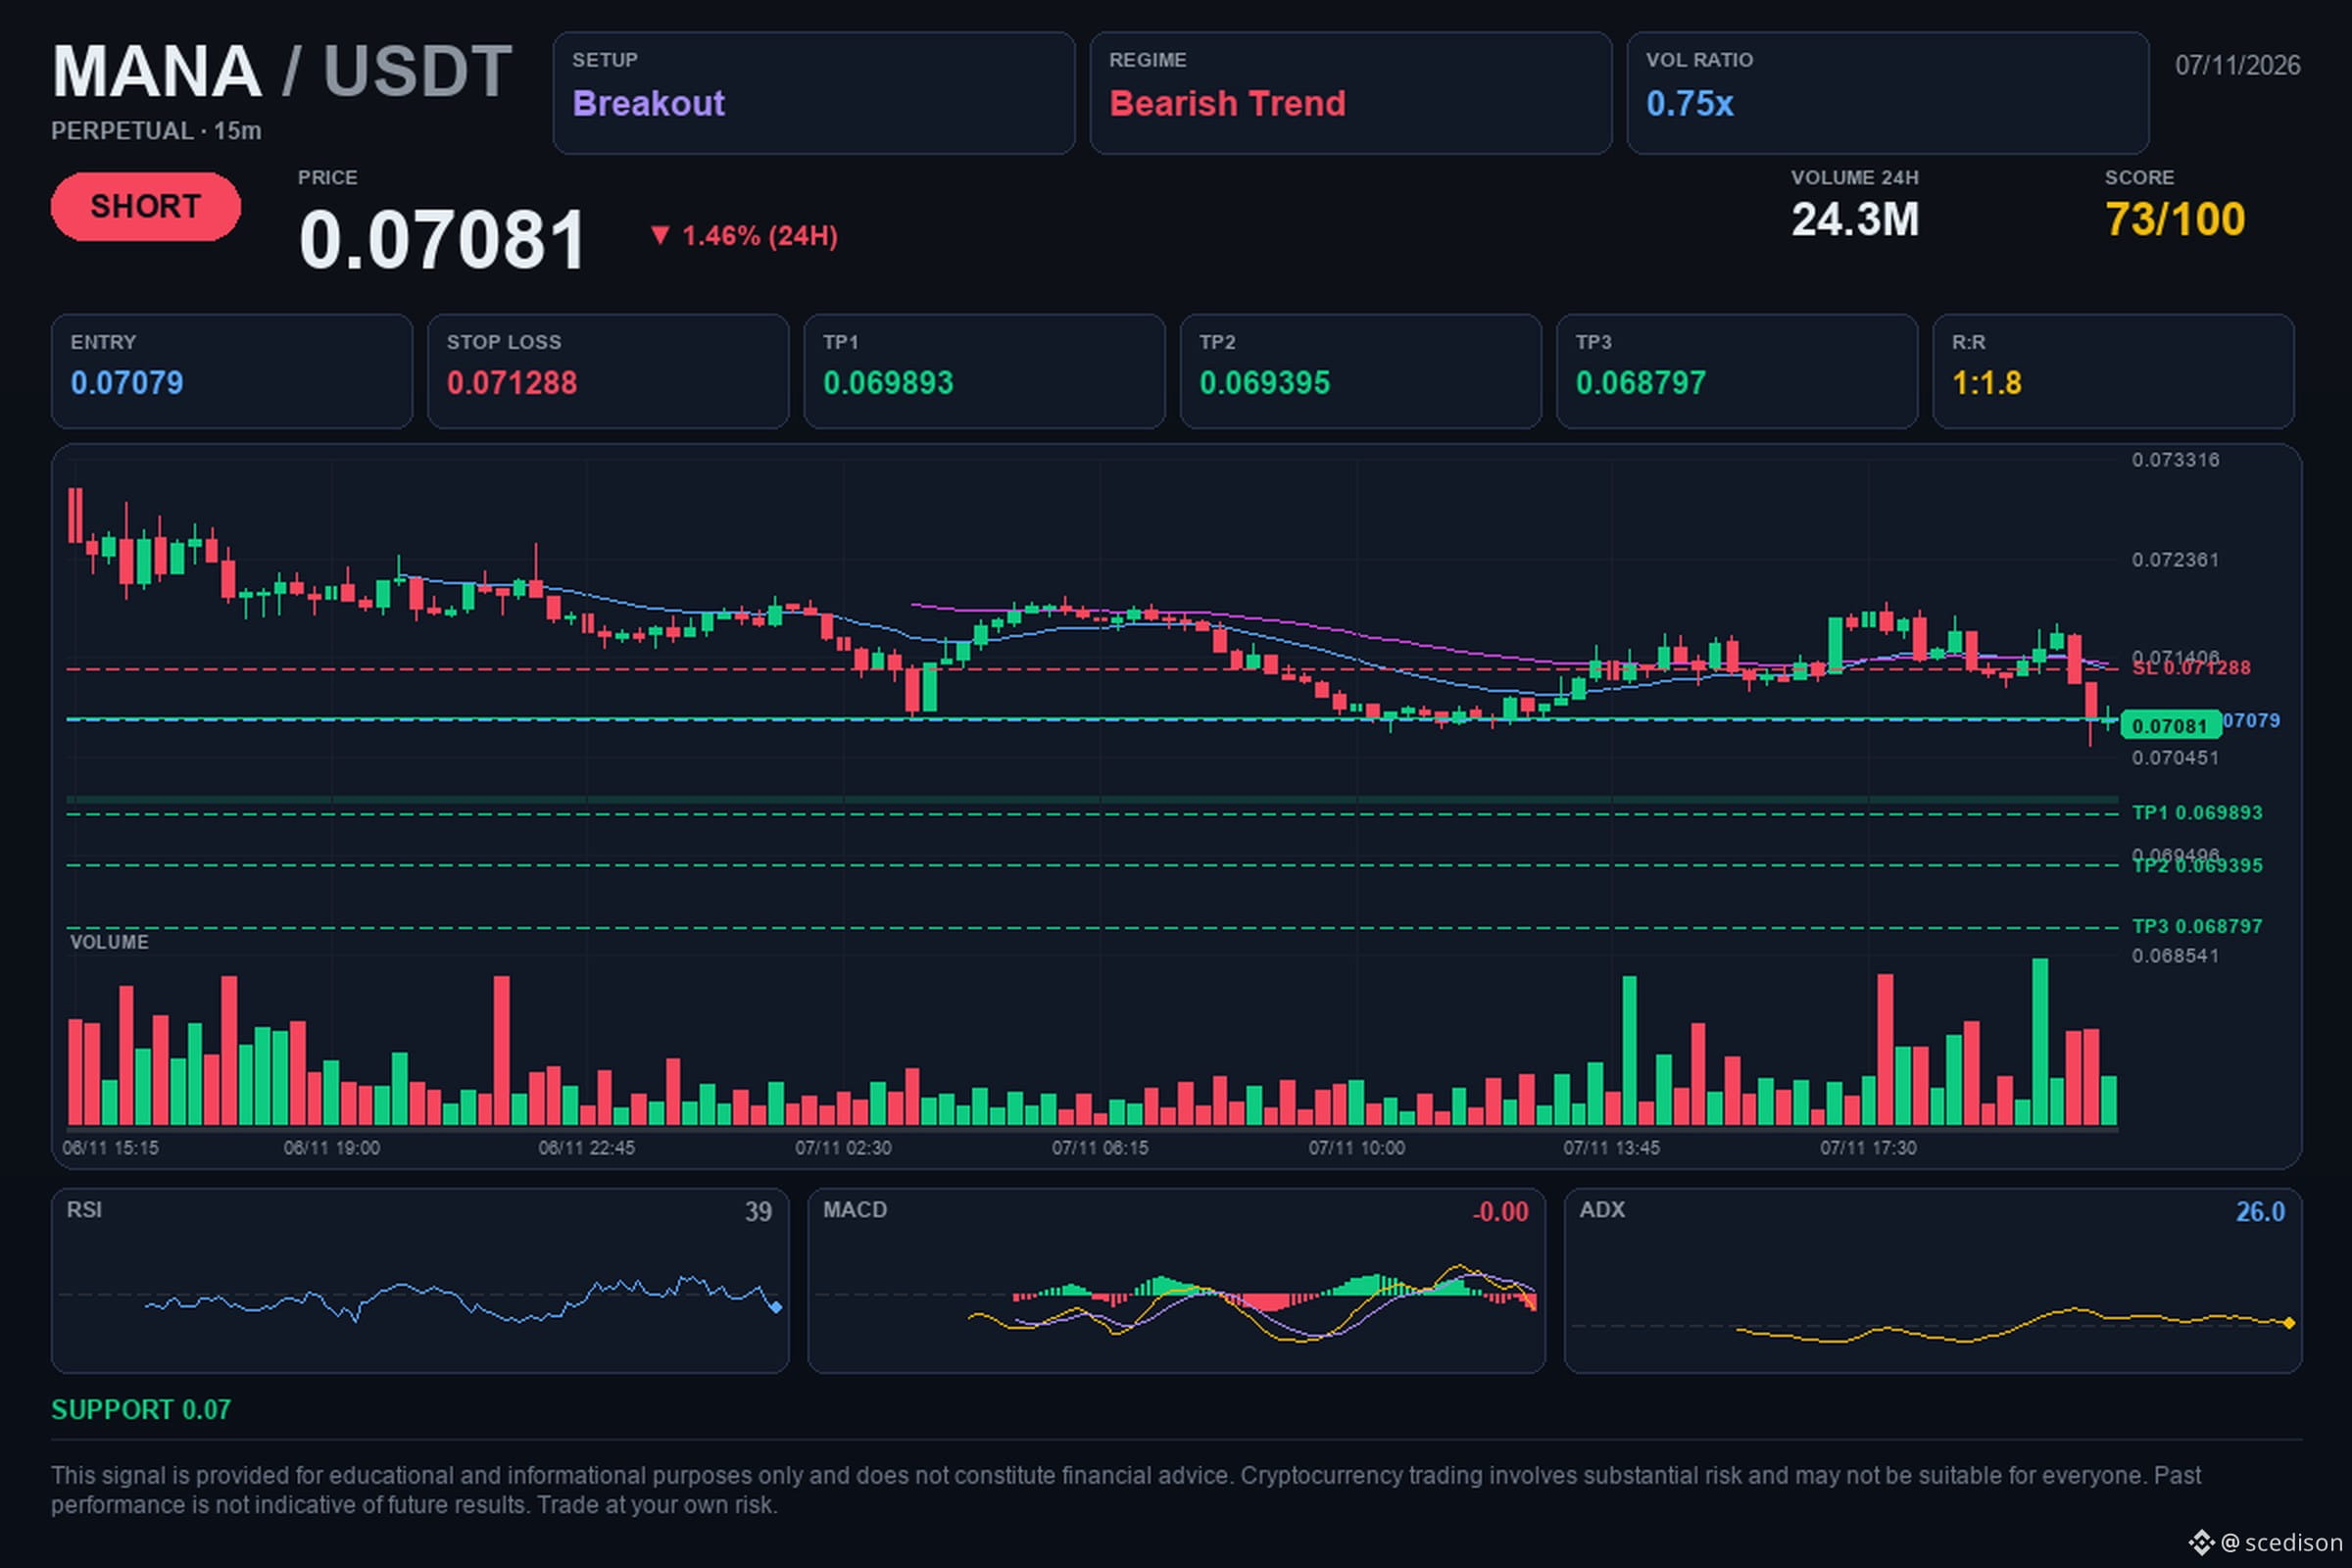
📢 $MANA / USDT | 🔴 SHORT | ⭐ 74%
🎯 Target: $0.06989301. Will it reach it?
🎯 Trade levels:
🔴 Entry: $0.07079
🛑 Stop Loss: $0.071288
🏁 TP1: $0.069893
🏁 TP2: $0.069395
🏁 TP3: $0.068797
📈 Analysis:
The asset shows a clear bearish structure, with lower highs on the 4-hour timeframes. We observe a significant increase in trading volume, which is 169.7% above its usual average, indicating increased market activity. Selling pressure is supported by the confirmed bearish trend across multiple timeframes, from the daily chart down to 15 minutes.
⚖️ Risk/Reward: 1:1.8
⏱️ Timeframe: 15M
💭 An increase in volume during a bearish trend is often interpreted as greater seller interest in continuing the current move.
#crypto #MANA #trading #Bearish
💡 This analysis is for educational purposes and does not constitute financial advice. Do your own research and make your decisions calmly.
📢 $MANA / USDT | 🔴 SHORT | ⭐ 74%
🎯 Target: $0.06989301. Will it reach it?
🎯 Trade levels:
🔴 Entry: $0.07079
🛑 Stop Loss: $0.071288
🏁 TP1: $0.069893
🏁 TP2: $0.069395
🏁 TP3: $0.068797
📈 Analysis:
The asset shows a clear bearish structure, with lower highs on the 4-hour timeframes. We observe a significant increase in trading volume, which is 169.7% above its usual average, indicating increased market activity. Selling pressure is supported by the confirmed bearish trend across multiple timeframes, from the daily chart down to 15 minutes.
⚖️ Risk/Reward: 1:1.8
⏱️ Timeframe: 15M
💭 An increase in volume during a bearish trend is often interpreted as greater seller interest in continuing the current move.
#crypto #MANA #trading #Bearish
💡 This analysis is for educational purposes and does not constitute financial advice. Do your own research and make your decisions calmly.
🎯 Target: $0.06989301. Will it reach it?
🎯 Trade levels:
🔴 Entry: $0.07079
🛑 Stop Loss: $0.071288
🏁 TP1: $0.069893
🏁 TP2: $0.069395
🏁 TP3: $0.068797
📈 Analysis:
The asset shows a clear bearish structure, with lower highs on the 4-hour timeframes. We observe a significant increase in trading volume, which is 169.7% above its usual average, indicating increased market activity. Selling pressure is supported by the confirmed bearish trend across multiple timeframes, from the daily chart down to 15 minutes.
⚖️ Risk/Reward: 1:1.8
⏱️ Timeframe: 15M
💭 An increase in volume during a bearish trend is often interpreted as greater seller interest in continuing the current move.
#crypto #MANA #trading #Bearish
💡 This analysis is for educational purposes and does not constitute financial advice. Do your own research and make your decisions calmly.
7
·
--
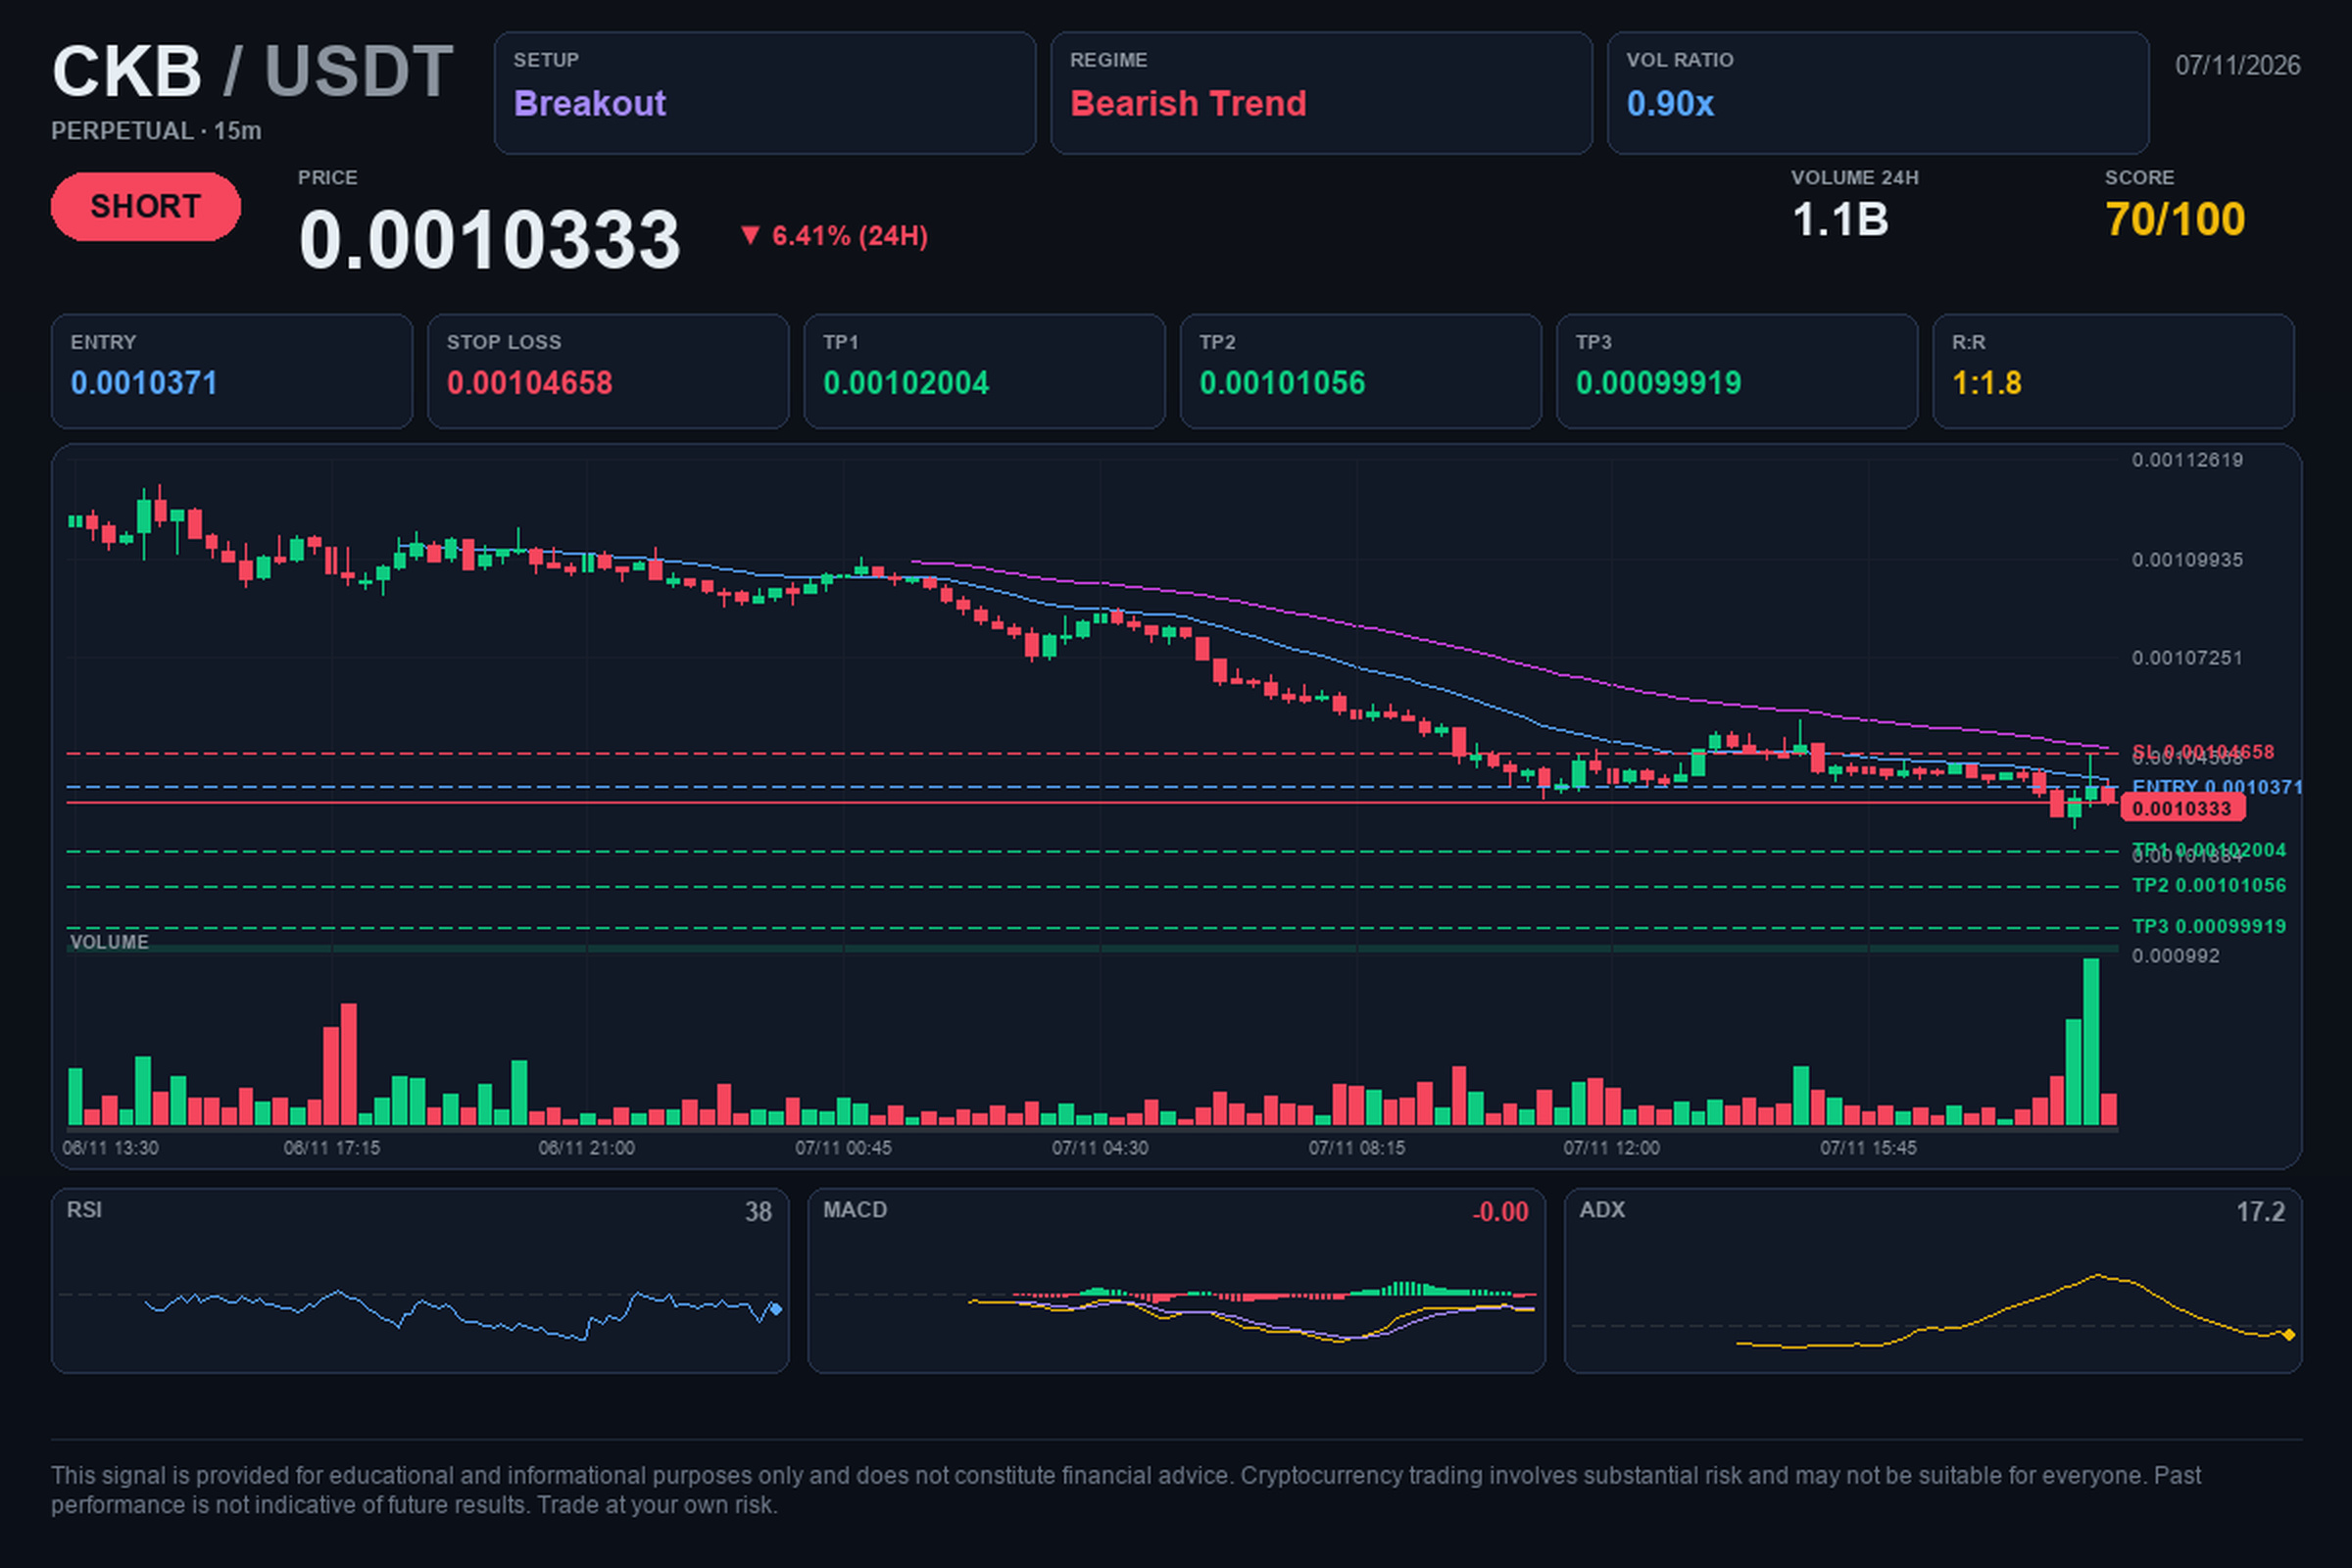
📢 $CKB / USDT | 🔴 SHORT | ⭐ 71%
🎯 Target: $0.00102004. Will it reach it?
🎯 Trading levels:
🔴 Entry: $0.0010371
🛑 Stop Loss: $0.00104658
🏁 TP1: $0.00102004
🏁 TP2: $0.00101056
🏁 TP3: $0.00099919
📈 Analysis:
The market shows a clear bearish structure with lower lows across multiple timeframes, indicating seller dominance. Trading volume has increased significantly, exceeding the average, while the relative strength indicator remains at low levels, reflecting persistent weakness in the price. This technical setup suggests continued selling pressure aimed at breaking current support levels.
⚖️ Risk/Reward: 1:1.8
⏱️ Timeframe: 15M
💭 A 'breakout' occurs when the price forcefully moves through a key support or resistance level, which often indicates that the prevailing trend will continue.
#crypto #CKB #trading #Bearish
💡 This analysis is for educational purposes and does not constitute financial advice. Do your own research and make your decision carefully.
📢 $CKB / USDT | 🔴 SHORT | ⭐ 71%
🎯 Target: $0.00102004. Will it reach it?
🎯 Trading levels:
🔴 Entry: $0.0010371
🛑 Stop Loss: $0.00104658
🏁 TP1: $0.00102004
🏁 TP2: $0.00101056
🏁 TP3: $0.00099919
📈 Analysis:
The market shows a clear bearish structure with lower lows across multiple timeframes, indicating seller dominance. Trading volume has increased significantly, exceeding the average, while the relative strength indicator remains at low levels, reflecting persistent weakness in the price. This technical setup suggests continued selling pressure aimed at breaking current support levels.
⚖️ Risk/Reward: 1:1.8
⏱️ Timeframe: 15M
💭 A 'breakout' occurs when the price forcefully moves through a key support or resistance level, which often indicates that the prevailing trend will continue.
#crypto #CKB #trading #Bearish
💡 This analysis is for educational purposes and does not constitute financial advice. Do your own research and make your decision carefully.
🎯 Target: $0.00102004. Will it reach it?
🎯 Trading levels:
🔴 Entry: $0.0010371
🛑 Stop Loss: $0.00104658
🏁 TP1: $0.00102004
🏁 TP2: $0.00101056
🏁 TP3: $0.00099919
📈 Analysis:
The market shows a clear bearish structure with lower lows across multiple timeframes, indicating seller dominance. Trading volume has increased significantly, exceeding the average, while the relative strength indicator remains at low levels, reflecting persistent weakness in the price. This technical setup suggests continued selling pressure aimed at breaking current support levels.
⚖️ Risk/Reward: 1:1.8
⏱️ Timeframe: 15M
💭 A 'breakout' occurs when the price forcefully moves through a key support or resistance level, which often indicates that the prevailing trend will continue.
#crypto #CKB #trading #Bearish
💡 This analysis is for educational purposes and does not constitute financial advice. Do your own research and make your decision carefully.
9
·
--
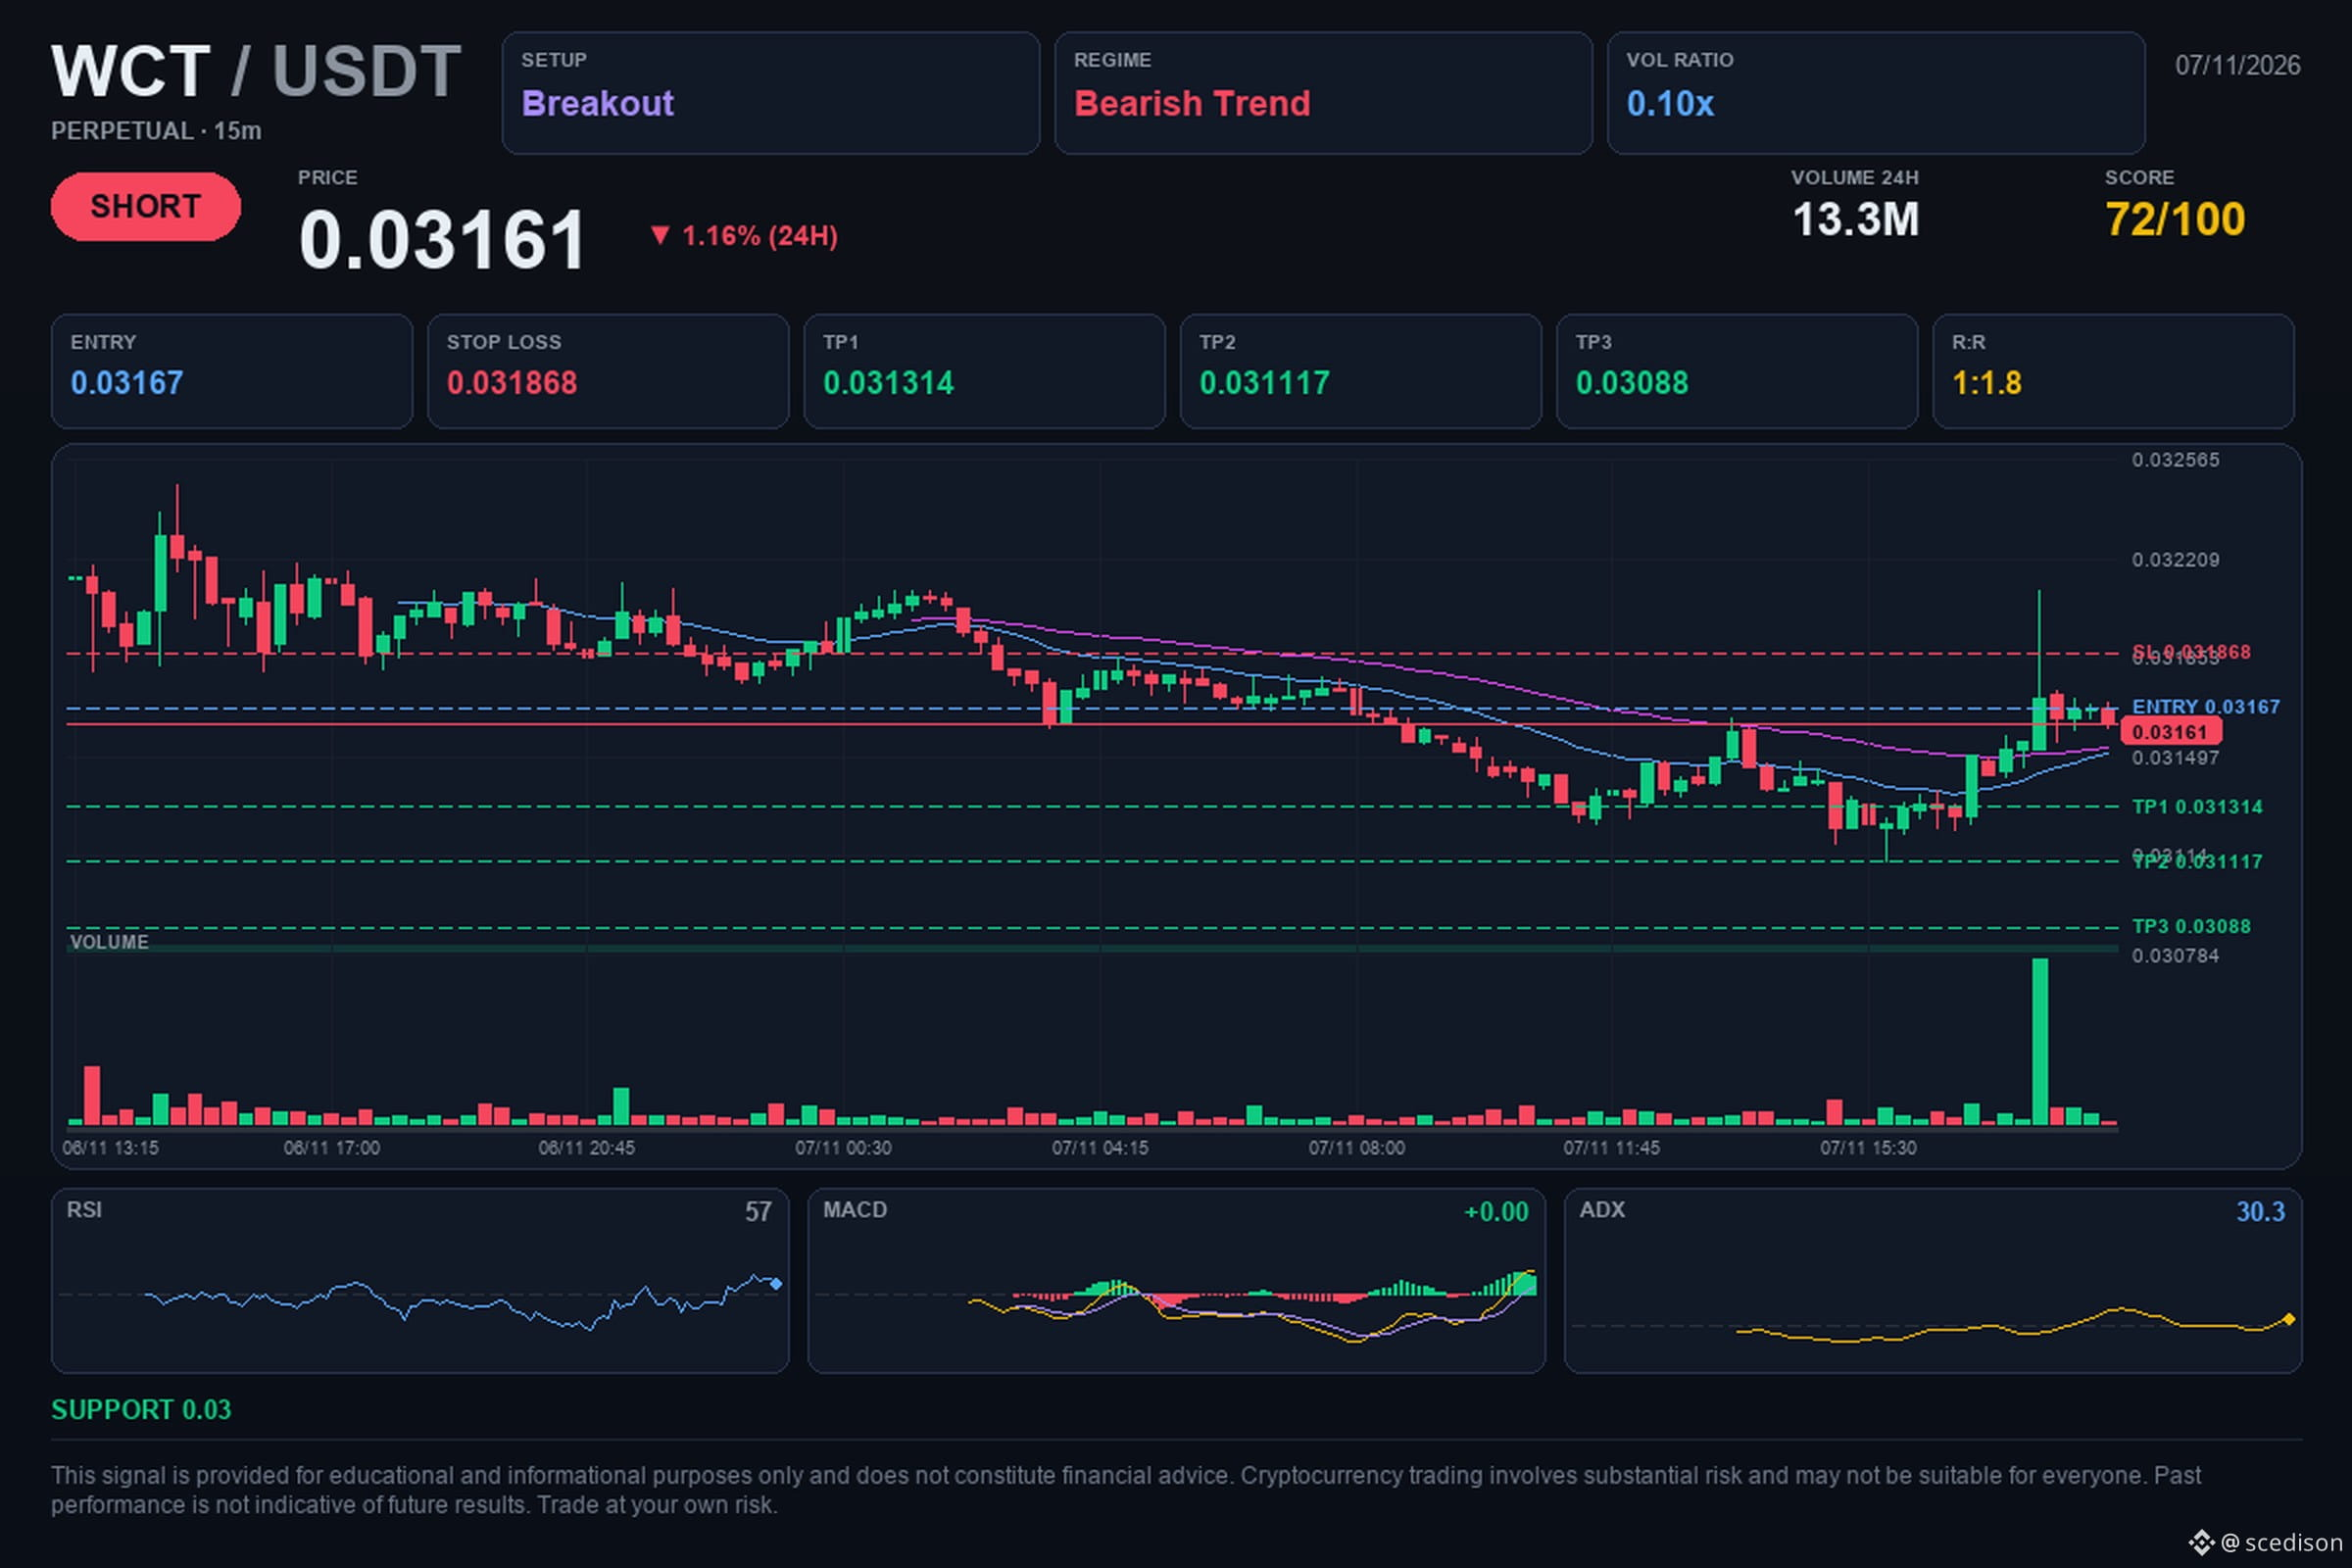
📢 $WCT / USDT | 🔴 SHORT | ⭐ 72%
🎯 Target: $0.03131429. Will it get there?
🎯 Trading levels:
🔴 Entry: $0.03167
🛑 Stop Loss: $0.031868
🏁 TP1: $0.031314
🏁 TP2: $0.031117
🏁 TP3: $0.03088
📈 Analysis:
The asset shows a clear bearish structure, with lower highs on the 4-hour timeframes, indicating strong selling pressure. A technical break below key support levels can be observed, accompanied by a significant increase in trading volume that far exceeds the average. The overall trend remains bearish, supported by market conditions that favor sellers in the short term.
⚖️ Risk/Reward: 1:1.8
⏱️ Timeframe: 15M
💭 A “breakout” occurs when the price forcefully crosses a support or resistance level, which often indicates that the current trend will continue.
#crypto #WCT #trading #Bearish
💡 This analysis is for educational purposes and does not constitute financial advice. Do your own research and make your decisions carefully.
📢 $WCT / USDT | 🔴 SHORT | ⭐ 72%
🎯 Target: $0.03131429. Will it get there?
🎯 Trading levels:
🔴 Entry: $0.03167
🛑 Stop Loss: $0.031868
🏁 TP1: $0.031314
🏁 TP2: $0.031117
🏁 TP3: $0.03088
📈 Analysis:
The asset shows a clear bearish structure, with lower highs on the 4-hour timeframes, indicating strong selling pressure. A technical break below key support levels can be observed, accompanied by a significant increase in trading volume that far exceeds the average. The overall trend remains bearish, supported by market conditions that favor sellers in the short term.
⚖️ Risk/Reward: 1:1.8
⏱️ Timeframe: 15M
💭 A “breakout” occurs when the price forcefully crosses a support or resistance level, which often indicates that the current trend will continue.
#crypto #WCT #trading #Bearish
💡 This analysis is for educational purposes and does not constitute financial advice. Do your own research and make your decisions carefully.
🎯 Target: $0.03131429. Will it get there?
🎯 Trading levels:
🔴 Entry: $0.03167
🛑 Stop Loss: $0.031868
🏁 TP1: $0.031314
🏁 TP2: $0.031117
🏁 TP3: $0.03088
📈 Analysis:
The asset shows a clear bearish structure, with lower highs on the 4-hour timeframes, indicating strong selling pressure. A technical break below key support levels can be observed, accompanied by a significant increase in trading volume that far exceeds the average. The overall trend remains bearish, supported by market conditions that favor sellers in the short term.
⚖️ Risk/Reward: 1:1.8
⏱️ Timeframe: 15M
💭 A “breakout” occurs when the price forcefully crosses a support or resistance level, which often indicates that the current trend will continue.
#crypto #WCT #trading #Bearish
💡 This analysis is for educational purposes and does not constitute financial advice. Do your own research and make your decisions carefully.
6
·
--
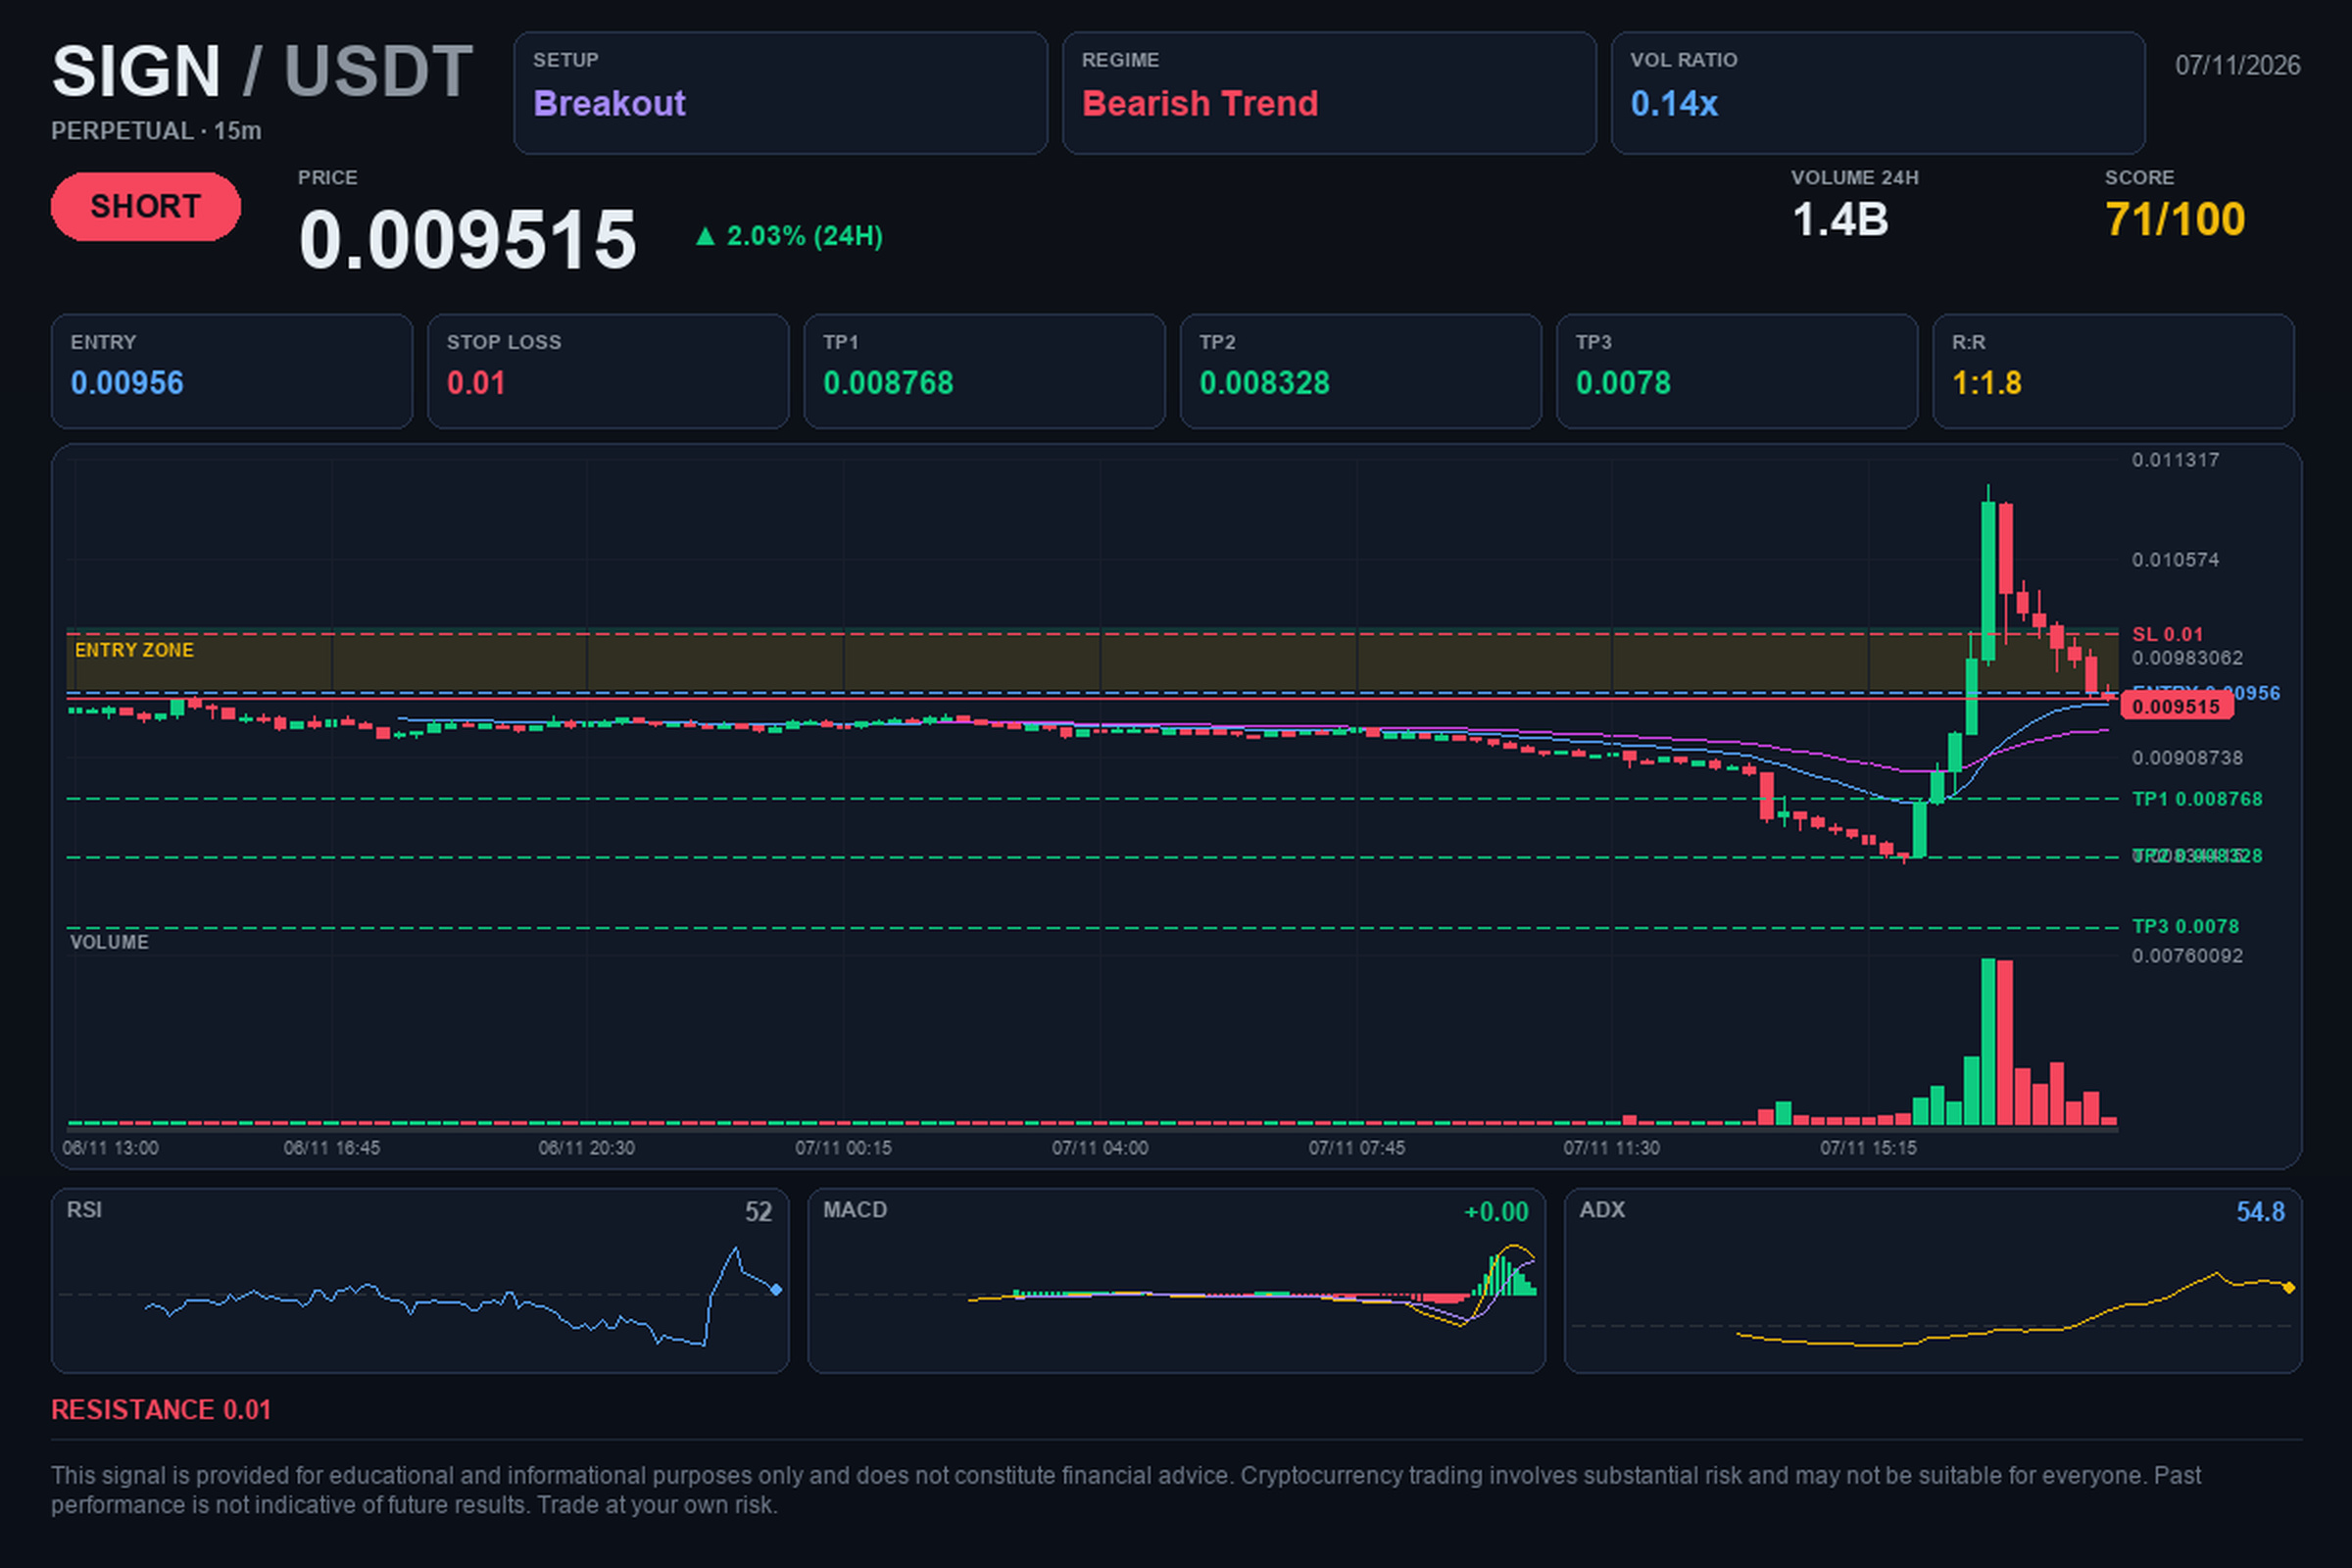
📢 $SIGN / USDT | 🔴 SHORT | ⭐ 72%
🎯 Target: $0.008768. Will it get there?
🎯 Trade levels:
🔴 Entry: $0.00956
🛑 Stop Loss: $0.01
🏁 TP1: $0.008768
🏁 TP2: $0.008328
🏁 TP3: $0.0078
📈 Analysis:
The market shows a clear bearish structure on higher timeframes, confirmed by patterns of lower highs and support breaks. We’re seeing a significant increase in trading volume, suggesting strong selling pressure at the current resistance zone. Volatility is expanding, indicating a more intense price movement.
⚖️ Risk/Reward: 1:1.8
⏱️ Timeframe: 15M
#crypto #SIGN #trading #Bearish
💡 This analysis is for educational purposes and does not constitute financial advice. Do your own research and make your decision calmly.
📢 $SIGN / USDT | 🔴 SHORT | ⭐ 72%
🎯 Target: $0.008768. Will it get there?
🎯 Trade levels:
🔴 Entry: $0.00956
🛑 Stop Loss: $0.01
🏁 TP1: $0.008768
🏁 TP2: $0.008328
🏁 TP3: $0.0078
📈 Analysis:
The market shows a clear bearish structure on higher timeframes, confirmed by patterns of lower highs and support breaks. We’re seeing a significant increase in trading volume, suggesting strong selling pressure at the current resistance zone. Volatility is expanding, indicating a more intense price movement.
⚖️ Risk/Reward: 1:1.8
⏱️ Timeframe: 15M
#crypto #SIGN #trading #Bearish
💡 This analysis is for educational purposes and does not constitute financial advice. Do your own research and make your decision calmly.
🎯 Target: $0.008768. Will it get there?
🎯 Trade levels:
🔴 Entry: $0.00956
🛑 Stop Loss: $0.01
🏁 TP1: $0.008768
🏁 TP2: $0.008328
🏁 TP3: $0.0078
📈 Analysis:
The market shows a clear bearish structure on higher timeframes, confirmed by patterns of lower highs and support breaks. We’re seeing a significant increase in trading volume, suggesting strong selling pressure at the current resistance zone. Volatility is expanding, indicating a more intense price movement.
⚖️ Risk/Reward: 1:1.8
⏱️ Timeframe: 15M
#crypto #SIGN #trading #Bearish
💡 This analysis is for educational purposes and does not constitute financial advice. Do your own research and make your decision calmly.
4

🔴 HEAVY SELLER PRESSURE THREATENS TO CRACK $NEIRO TOWARD $0.00008500! 📉
Target: 0.00008500 🎯
Sellers are gaining full control of momentum as $NEIRO breaks key support structures. 📊 Supply is overwhelming bids on lower timeframes, signaling a swift sweep into deeper liquidity.
🐻 Momentum favors the short side as distribution patterns complete across the order book. 📉 If bid depth fails to absorb sell-side volume, expect acceleration straight down to the 0.00008500 zone. 💬 Are you riding the breakdown lower or waiting to catch a bounce? 👇
⚠️ Not financial advice. Always manage your risk. 🛡️
🏷️ #NEIRO #ShortSetup #Bearish #Crypto
🎯 📉
🔴 HEAVY SELLER PRESSURE THREATENS TO CRACK $NEIRO TOWARD $0.00008500! 📉
Target: 0.00008500 🎯
Sellers are gaining full control of momentum as $NEIRO breaks key support structures. 📊 Supply is overwhelming bids on lower timeframes, signaling a swift sweep into deeper liquidity.
🐻 Momentum favors the short side as distribution patterns complete across the order book. 📉 If bid depth fails to absorb sell-side volume, expect acceleration straight down to the 0.00008500 zone. 💬 Are you riding the breakdown lower or waiting to catch a bounce? 👇
⚠️ Not financial advice. Always manage your risk. 🛡️
🏷️ #NEIRO #ShortSetup #Bearish #Crypto
🎯 📉
Target: 0.00008500 🎯
Sellers are gaining full control of momentum as $NEIRO breaks key support structures. 📊 Supply is overwhelming bids on lower timeframes, signaling a swift sweep into deeper liquidity.
🐻 Momentum favors the short side as distribution patterns complete across the order book. 📉 If bid depth fails to absorb sell-side volume, expect acceleration straight down to the 0.00008500 zone. 💬 Are you riding the breakdown lower or waiting to catch a bounce? 👇
⚠️ Not financial advice. Always manage your risk. 🛡️
🏷️ #NEIRO #ShortSetup #Bearish #Crypto
🎯 📉
14

·
--
🚨 $TRB REJECTED AT THE HIGHS AS BEARS POSITION FOR A DROPOFF TO $15! 🔻
Entry: $20.20 – $20.70 🔴
Target: $19.00 / $17.50 / $15.50 💥
Stop Loss: $23.15 ⚠️
The aggressive push into $22.90 hit a brick wall of seller liquidity, leaving late buyers trapped at the local top. 📉 Consecutive red candles on the 1H timeframe confirm momentum is shifting rapidly as aggressive supply takes control.
If sellers defend the $20.20 breakdown zone, expect order flow to accelerate downward toward the major support levels down to $15.50. 📊 The fakeout above resistance opens up a clear runway for bears to sweep lower liquidity.
🤔 Are you shorting this rejection or waiting for a relief retest before taking a position? 👇
⚠️ Not financial advice. Always manage your risk. 🛡️
🏷️ #TRB #ShortSetup #Crypto #Bearish
🐻 📉
🚨 $TRB REJECTED AT THE HIGHS AS BEARS POSITION FOR A DROPOFF TO $15! 🔻
Entry: $20.20 – $20.70 🔴
Target: $19.00 / $17.50 / $15.50 💥
Stop Loss: $23.15 ⚠️
The aggressive push into $22.90 hit a brick wall of seller liquidity, leaving late buyers trapped at the local top. 📉 Consecutive red candles on the 1H timeframe confirm momentum is shifting rapidly as aggressive supply takes control.
If sellers defend the $20.20 breakdown zone, expect order flow to accelerate downward toward the major support levels down to $15.50. 📊 The fakeout above resistance opens up a clear runway for bears to sweep lower liquidity.
🤔 Are you shorting this rejection or waiting for a relief retest before taking a position? 👇
⚠️ Not financial advice. Always manage your risk. 🛡️
🏷️ #TRB #ShortSetup #Crypto #Bearish
🐻 📉
Entry: $20.20 – $20.70 🔴
Target: $19.00 / $17.50 / $15.50 💥
Stop Loss: $23.15 ⚠️
The aggressive push into $22.90 hit a brick wall of seller liquidity, leaving late buyers trapped at the local top. 📉 Consecutive red candles on the 1H timeframe confirm momentum is shifting rapidly as aggressive supply takes control.
If sellers defend the $20.20 breakdown zone, expect order flow to accelerate downward toward the major support levels down to $15.50. 📊 The fakeout above resistance opens up a clear runway for bears to sweep lower liquidity.
🤔 Are you shorting this rejection or waiting for a relief retest before taking a position? 👇
⚠️ Not financial advice. Always manage your risk. 🛡️
🏷️ #TRB #ShortSetup #Crypto #Bearish
🐻 📉
50

·
--
🚨 $TRUMP HITS HEAVY SUPPLY ZONE FOR HIGH-CONVICTION SHORT OPPORTUNITY! 📉
Entry: 1.84300 - 1.85500 ⚡
Target: 1.80800 - 1.74000 🚀
Stop Loss: 1.90400 ⚠️
Price has slammed into a critical supply wall at 1.84300 - 1.85500 where sellers are actively taking control. 📊 Order flow shows aggressive ask density absorbing buyer attempts, setting up a textbook liquidity sweep before a leg down. 📉
💡 Risk is strictly capped at 1.90400, offering an attractive asymmetric risk-to-reward profile targeting structural support down to 1.74000. ⚡ Momentum oscillators are rolling over as buying volume shrinks rapidly at these levels. 💬 Are you taking the short from resistance or waiting for a lower low confirmation? 👇
⚠️ Not financial advice. Always manage your risk. 🛡️
🏷️ #TRUMP #ShortSetup #CryptoTrading #Bearish
🎯 📉
🚨 $TRUMP HITS HEAVY SUPPLY ZONE FOR HIGH-CONVICTION SHORT OPPORTUNITY! 📉
Entry: 1.84300 - 1.85500 ⚡
Target: 1.80800 - 1.74000 🚀
Stop Loss: 1.90400 ⚠️
Price has slammed into a critical supply wall at 1.84300 - 1.85500 where sellers are actively taking control. 📊 Order flow shows aggressive ask density absorbing buyer attempts, setting up a textbook liquidity sweep before a leg down. 📉
💡 Risk is strictly capped at 1.90400, offering an attractive asymmetric risk-to-reward profile targeting structural support down to 1.74000. ⚡ Momentum oscillators are rolling over as buying volume shrinks rapidly at these levels. 💬 Are you taking the short from resistance or waiting for a lower low confirmation? 👇
⚠️ Not financial advice. Always manage your risk. 🛡️
🏷️ #TRUMP #ShortSetup #CryptoTrading #Bearish
🎯 📉
Entry: 1.84300 - 1.85500 ⚡
Target: 1.80800 - 1.74000 🚀
Stop Loss: 1.90400 ⚠️
Price has slammed into a critical supply wall at 1.84300 - 1.85500 where sellers are actively taking control. 📊 Order flow shows aggressive ask density absorbing buyer attempts, setting up a textbook liquidity sweep before a leg down. 📉
💡 Risk is strictly capped at 1.90400, offering an attractive asymmetric risk-to-reward profile targeting structural support down to 1.74000. ⚡ Momentum oscillators are rolling over as buying volume shrinks rapidly at these levels. 💬 Are you taking the short from resistance or waiting for a lower low confirmation? 👇
⚠️ Not financial advice. Always manage your risk. 🛡️
🏷️ #TRUMP #ShortSetup #CryptoTrading #Bearish
🎯 📉
25
·
--
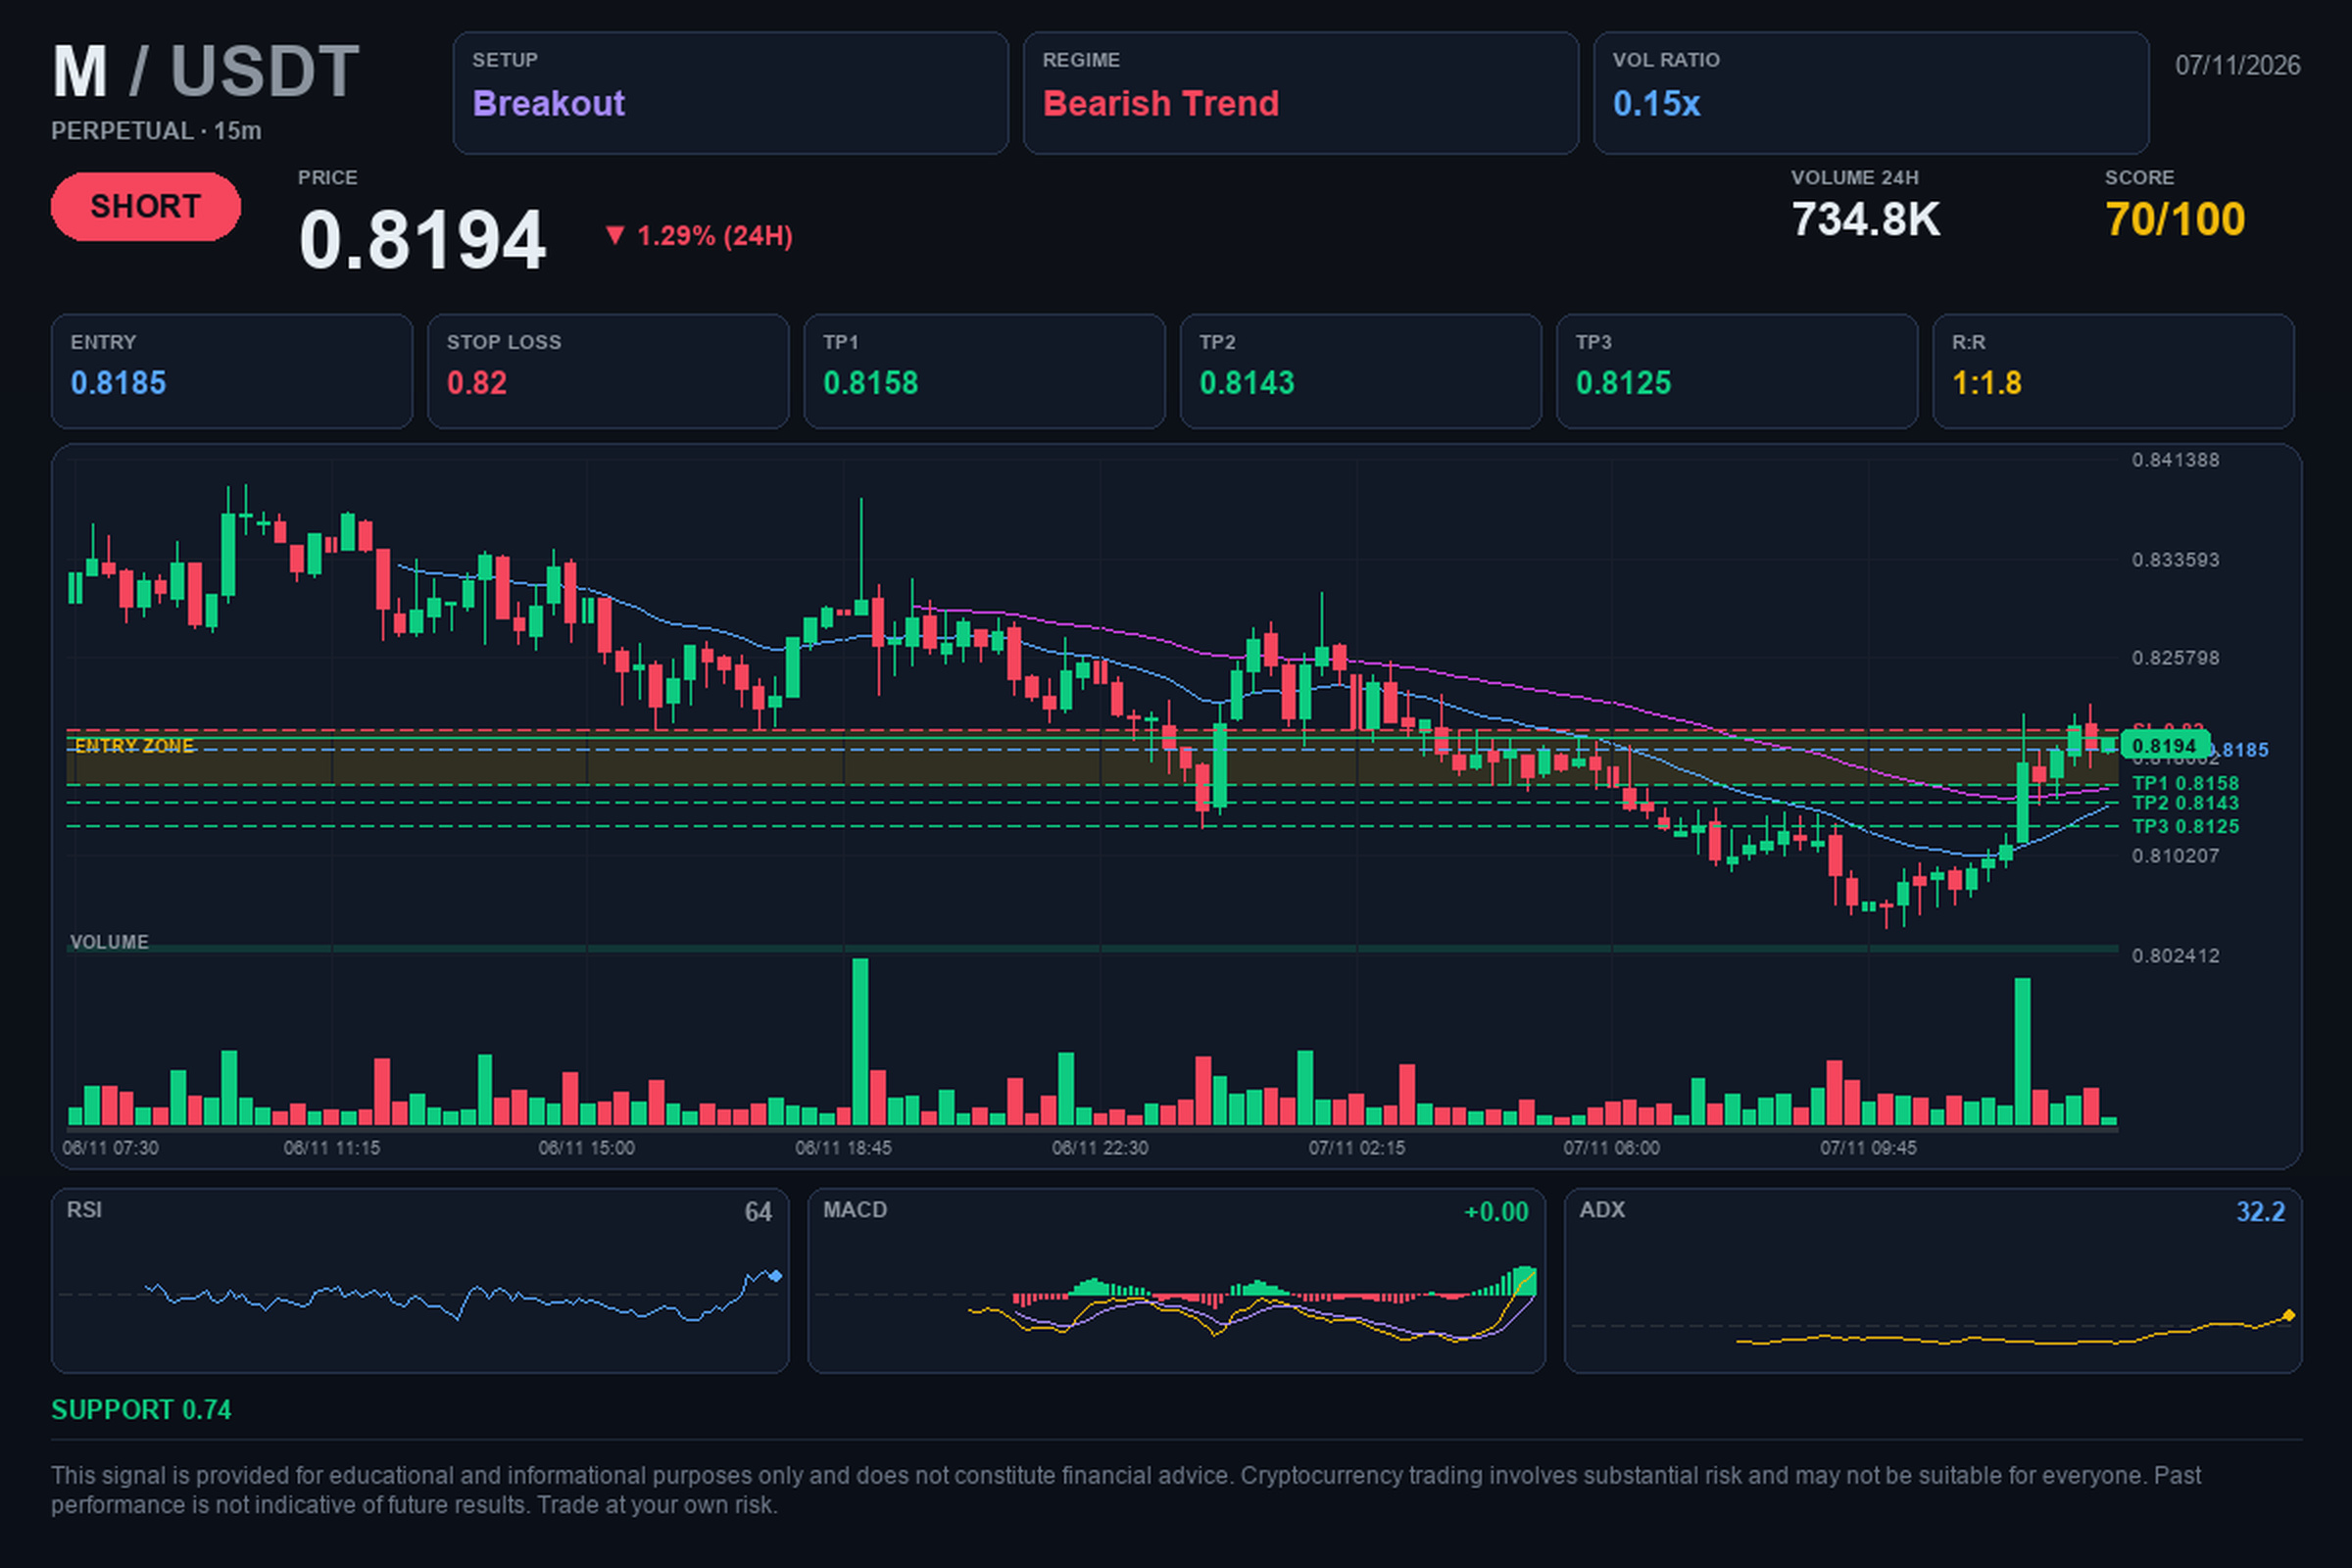
📢 $M / USDT | 🔴 SHORT | ⭐ 71%
🎯 Target: $0.8158. Will it reach it?
🎯 Trading levels:
🔴 Entry: $0.8185
🛑 Stop Loss: $0.82
🏁 TP1: $0.8158
🏁 TP2: $0.8143
🏁 TP3: $0.8125
📈 Analysis:
The market shows a clear bearish structure, with lower highs on the 4-hour timeframes, confirming a predominant downtrend. A bearish breakout is observed around the 0.82 resistance zone, accompanied by a significant increase in trading volume above average. Selling pressure remains active as the price attempts to consolidate this move below key levels.
⚖️ Risk/Reward: 1:1.8
⏱️ Timeframe: 15M
💭 A bearish breakout occurs when the price forcefully moves through a support or resistance level, indicating a possible change in or continuation of the current trend.
#crypto #M #trading #Bearish
💡 This analysis is for educational purposes and does not constitute financial advice. Do your own research and make your decision calmly.
📢 $M / USDT | 🔴 SHORT | ⭐ 71%
🎯 Target: $0.8158. Will it reach it?
🎯 Trading levels:
🔴 Entry: $0.8185
🛑 Stop Loss: $0.82
🏁 TP1: $0.8158
🏁 TP2: $0.8143
🏁 TP3: $0.8125
📈 Analysis:
The market shows a clear bearish structure, with lower highs on the 4-hour timeframes, confirming a predominant downtrend. A bearish breakout is observed around the 0.82 resistance zone, accompanied by a significant increase in trading volume above average. Selling pressure remains active as the price attempts to consolidate this move below key levels.
⚖️ Risk/Reward: 1:1.8
⏱️ Timeframe: 15M
💭 A bearish breakout occurs when the price forcefully moves through a support or resistance level, indicating a possible change in or continuation of the current trend.
#crypto #M #trading #Bearish
💡 This analysis is for educational purposes and does not constitute financial advice. Do your own research and make your decision calmly.
🎯 Target: $0.8158. Will it reach it?
🎯 Trading levels:
🔴 Entry: $0.8185
🛑 Stop Loss: $0.82
🏁 TP1: $0.8158
🏁 TP2: $0.8143
🏁 TP3: $0.8125
📈 Analysis:
The market shows a clear bearish structure, with lower highs on the 4-hour timeframes, confirming a predominant downtrend. A bearish breakout is observed around the 0.82 resistance zone, accompanied by a significant increase in trading volume above average. Selling pressure remains active as the price attempts to consolidate this move below key levels.
⚖️ Risk/Reward: 1:1.8
⏱️ Timeframe: 15M
💭 A bearish breakout occurs when the price forcefully moves through a support or resistance level, indicating a possible change in or continuation of the current trend.
#crypto #M #trading #Bearish
💡 This analysis is for educational purposes and does not constitute financial advice. Do your own research and make your decision calmly.
7
·
--
🚨 $SCRT POST-IMPULSE CONSOLIDATION SIGNALS HEAVY DISTRIBUTION BEFORE THE NEXT DOWNWARD LEG! 📉
Entry: 0.02991 ⚡
Target: 0.0278432 🎯
Stop Loss: 0.0319768 ⚠️
📉 After that aggressive downside impulse, $SCRT is now carving out a textbook consolidation range, giving sellers a pristine window to position. Order flow shows buyers failing to reclaim overhead resistance, indicating high-conviction distribution rather than genuine accumulation. 📊
💡 Patience pays here—instead of chasing breakdowns into low liquidity, the highest probability execution is waiting for price to retest our key entry pivot. If sellers step in to defend this supply zone, momentum should accelerate swiftly toward lower liquidity pools. 🔍 Are you leaning short on this consolidation or waiting for a fakeout liquidity sweep? 👇
⚠️ Not financial advice. Always manage your risk. 🛡️
🏷️ #SCRT #ShortSetup #Bearish #CryptoTrading
📉 🐻
🚨 $SCRT POST-IMPULSE CONSOLIDATION SIGNALS HEAVY DISTRIBUTION BEFORE THE NEXT DOWNWARD LEG! 📉
Entry: 0.02991 ⚡
Target: 0.0278432 🎯
Stop Loss: 0.0319768 ⚠️
📉 After that aggressive downside impulse, $SCRT is now carving out a textbook consolidation range, giving sellers a pristine window to position. Order flow shows buyers failing to reclaim overhead resistance, indicating high-conviction distribution rather than genuine accumulation. 📊
💡 Patience pays here—instead of chasing breakdowns into low liquidity, the highest probability execution is waiting for price to retest our key entry pivot. If sellers step in to defend this supply zone, momentum should accelerate swiftly toward lower liquidity pools. 🔍 Are you leaning short on this consolidation or waiting for a fakeout liquidity sweep? 👇
⚠️ Not financial advice. Always manage your risk. 🛡️
🏷️ #SCRT #ShortSetup #Bearish #CryptoTrading
📉 🐻
Entry: 0.02991 ⚡
Target: 0.0278432 🎯
Stop Loss: 0.0319768 ⚠️
📉 After that aggressive downside impulse, $SCRT is now carving out a textbook consolidation range, giving sellers a pristine window to position. Order flow shows buyers failing to reclaim overhead resistance, indicating high-conviction distribution rather than genuine accumulation. 📊
💡 Patience pays here—instead of chasing breakdowns into low liquidity, the highest probability execution is waiting for price to retest our key entry pivot. If sellers step in to defend this supply zone, momentum should accelerate swiftly toward lower liquidity pools. 🔍 Are you leaning short on this consolidation or waiting for a fakeout liquidity sweep? 👇
⚠️ Not financial advice. Always manage your risk. 🛡️
🏷️ #SCRT #ShortSetup #Bearish #CryptoTrading
📉 🐻
1
Log in to explore more content
Join global crypto users on Binance Square
⚡️ Get latest and useful information about crypto.
💬 Trusted by the world’s largest crypto exchange.
👍 Discover real insights from verified creators.
Email / Phone number
Trending Topics
1
#HKSFCToExpandRestrictedTitlesList
31 views
32 Discussing
2
#JobsReportRaisesHikeOdds
582,007 views
3,673 Discussing
3
#CPITestsDecemberRateOutlook
188,510 views
1,342 Discussing
4
#US Data Center Rules May Constrain AI Expansion
81,511 views
238 Discussing
5
#ARKPlans14ThematicETFsCoveringAIAndTokenizedMarkets
5,142 views
74 Discussing
6
#WillAnthropicListOnTime
181,473 views
1,539 Discussing
7
#WillUS-IranTensionsBoostSafe-HavenDemand?
88,946 views
635 Discussing
8
#BitcoinETFsSee$412MNetOutflows
17,743 views
81 Discussing
9
#HKSFCPlansToRestrictCryptoAndExchangeTerms
72,397 views
631 Discussing
10
#TradFiForBeginners
103,595 views
1,123 Discussing