

#render
render
3.3M views
10,625 Discussing
Hot
Latest

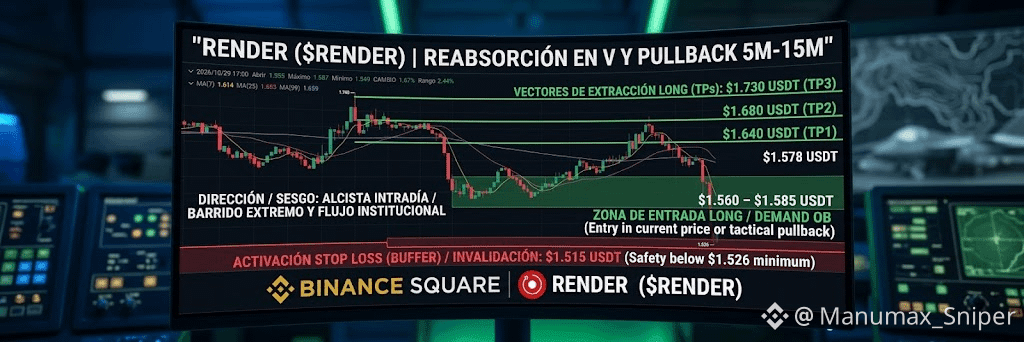
Heads up, troops! Pull up the chart with me for a second, because Render has just given us a fascinating tactical scenario for a quick reaction, operating strictly under our 5M, 15M, and 1H doctrine. The price suffered a very sharp vertical drop, with a massive volume climax that deeply swept liquidity down to $1.526 USDT. An aggressive absorption by institutional buyers immediately kicked in, with a gigantic rejection wick and a bullish change of character. It’s now trading at $1.578–$1.580 USDT, quickly recovering ground. The play is clearly Long.
Keep this in mind: don’t recklessly chase candles after a “V”-shaped bounce. We stick to the battle plan and wait for the tactical cooldown pullback toward our entry zone at $1.560–$1.585 USDT to catch the best risk-reward ratio.
The Stop Loss is secured at $1.515 USDT, placed with a strategic buffer below the institutional sweep low to protect the account from false wicks. If the market invalidates our entry, we pay the 1% toll with a cool head and keep our capital safe.
The take-profit plan focuses on the fast session structure (a 4-to-8-hour window), with no ticking clocks:
As soon as it reaches $1.640 USDT (TP1), we secure 50% of the loot and move the Stop Loss to Break-Even (Zero Risk).
At $1.680 USDT (TP2), we pocket another 30% in the intermediate resistance zone and the retest of the previous block on 15M charts.
We’ll let the remaining 20% run toward $1.730 USDT (TP3), aiming for the maximum intraday momentum recovery target near the previous supply zone.
Adjust your orders and let the chart do its job without hovering over it and biting your nails. Ready for the mission, soldiers? Head over to the chat. 👇🎯🔥
Click the $RENDER widget below to follow the chart live and trade directly on Binance.
#RENDER #RenderNetwork
Heads up, troops! Pull up the chart with me for a second, because Render has just given us a fascinating tactical scenario for a quick reaction, operating strictly under our 5M, 15M, and 1H doctrine. The price suffered a very sharp vertical drop, with a massive volume climax that deeply swept liquidity down to $1.526 USDT. An aggressive absorption by institutional buyers immediately kicked in, with a gigantic rejection wick and a bullish change of character. It’s now trading at $1.578–$1.580 USDT, quickly recovering ground. The play is clearly Long.
Keep this in mind: don’t recklessly chase candles after a “V”-shaped bounce. We stick to the battle plan and wait for the tactical cooldown pullback toward our entry zone at $1.560–$1.585 USDT to catch the best risk-reward ratio.
The Stop Loss is secured at $1.515 USDT, placed with a strategic buffer below the institutional sweep low to protect the account from false wicks. If the market invalidates our entry, we pay the 1% toll with a cool head and keep our capital safe.
The take-profit plan focuses on the fast session structure (a 4-to-8-hour window), with no ticking clocks:
As soon as it reaches $1.640 USDT (TP1), we secure 50% of the loot and move the Stop Loss to Break-Even (Zero Risk).
At $1.680 USDT (TP2), we pocket another 30% in the intermediate resistance zone and the retest of the previous block on 15M charts.
We’ll let the remaining 20% run toward $1.730 USDT (TP3), aiming for the maximum intraday momentum recovery target near the previous supply zone.
Adjust your orders and let the chart do its job without hovering over it and biting your nails. Ready for the mission, soldiers? Head over to the chat. 👇🎯🔥
Click the $RENDER widget below to follow the chart live and trade directly on Binance.
#RENDER #RenderNetwork
Keep this in mind: don’t recklessly chase candles after a “V”-shaped bounce. We stick to the battle plan and wait for the tactical cooldown pullback toward our entry zone at $1.560–$1.585 USDT to catch the best risk-reward ratio.
The Stop Loss is secured at $1.515 USDT, placed with a strategic buffer below the institutional sweep low to protect the account from false wicks. If the market invalidates our entry, we pay the 1% toll with a cool head and keep our capital safe.
The take-profit plan focuses on the fast session structure (a 4-to-8-hour window), with no ticking clocks:
As soon as it reaches $1.640 USDT (TP1), we secure 50% of the loot and move the Stop Loss to Break-Even (Zero Risk).
At $1.680 USDT (TP2), we pocket another 30% in the intermediate resistance zone and the retest of the previous block on 15M charts.
We’ll let the remaining 20% run toward $1.730 USDT (TP3), aiming for the maximum intraday momentum recovery target near the previous supply zone.
Adjust your orders and let the chart do its job without hovering over it and biting your nails. Ready for the mission, soldiers? Head over to the chat. 👇🎯🔥
Click the $RENDER widget below to follow the chart live and trade directly on Binance.
#RENDER #RenderNetwork
178

·
--
$RENDER #RENDER
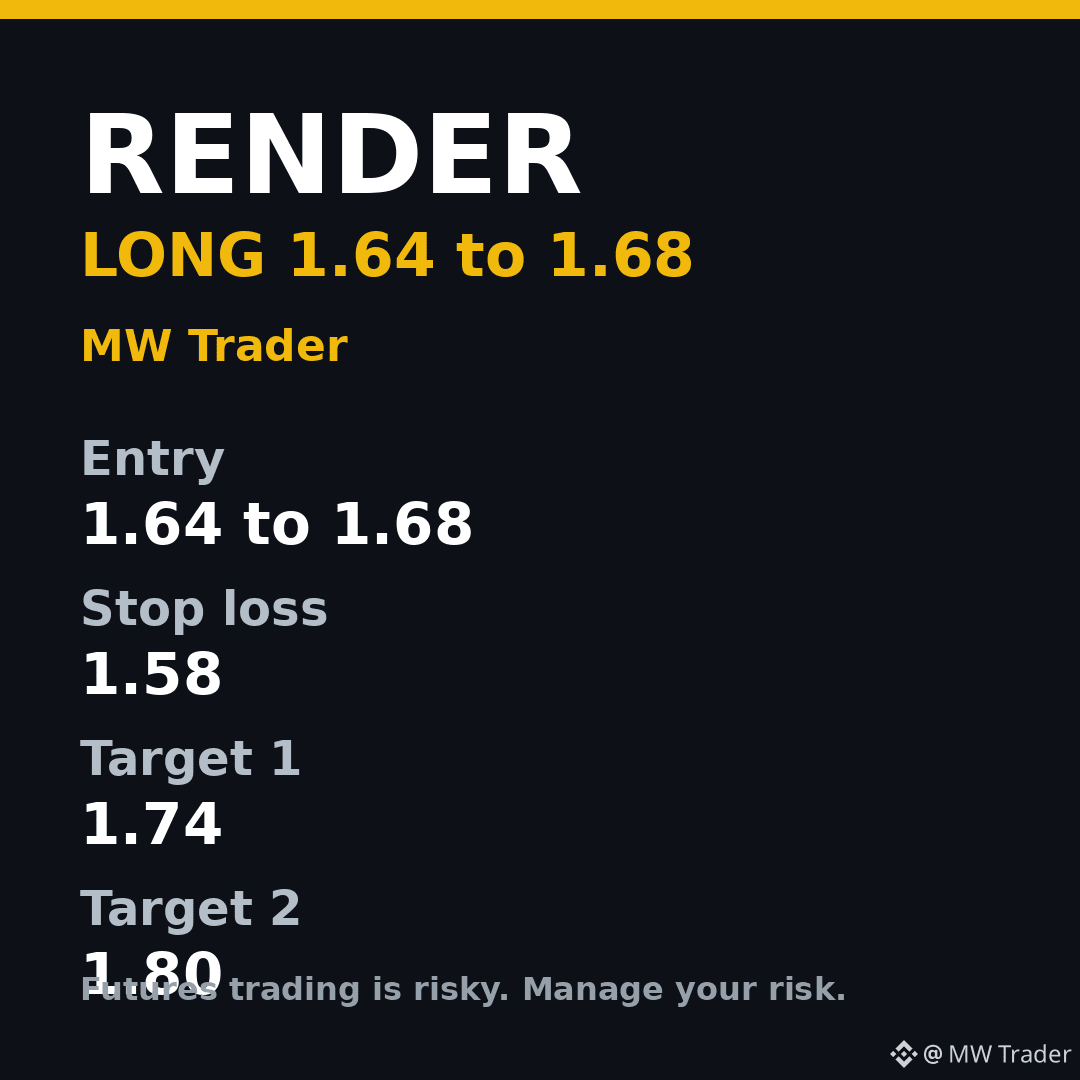
LONG idea, fresh setup for 29 October evening
Entry: 1.64 to 1.68
Stop loss: 1.58
Target 1: 1.74
Target 2: 1.80
Render is near 1.67, up about 0.35 percent over 24 hours on about 43 million dollars of volume, holding firm despite the weak tone in AI tokens today. Holding up when its sector is down is a relative strength sign. A long on a pullback toward 1.64 to 1.68 favours a move toward 1.74. Below 1.58, step aside.
Futures trading is risky, trade small, manage your risk, and do your own research.
#Render #Crypto #FuturesTrading #TradingSignals
Follow for more trades.
$RENDER #RENDER
LONG idea, fresh setup for 29 October evening
Entry: 1.64 to 1.68
Stop loss: 1.58
Target 1: 1.74
Target 2: 1.80
Render is near 1.67, up about 0.35 percent over 24 hours on about 43 million dollars of volume, holding firm despite the weak tone in AI tokens today. Holding up when its sector is down is a relative strength sign. A long on a pullback toward 1.64 to 1.68 favours a move toward 1.74. Below 1.58, step aside.
Futures trading is risky, trade small, manage your risk, and do your own research.
#Render #Crypto #FuturesTrading #TradingSignals
Follow for more trades.
LONG idea, fresh setup for 29 October evening
Entry: 1.64 to 1.68
Stop loss: 1.58
Target 1: 1.74
Target 2: 1.80
Render is near 1.67, up about 0.35 percent over 24 hours on about 43 million dollars of volume, holding firm despite the weak tone in AI tokens today. Holding up when its sector is down is a relative strength sign. A long on a pullback toward 1.64 to 1.68 favours a move toward 1.74. Below 1.58, step aside.
Futures trading is risky, trade small, manage your risk, and do your own research.
#Render #Crypto #FuturesTrading #TradingSignals
Follow for more trades.
9

🚨 $RENDER FLASH CRASH! 🔥 BOUNCE SETUP OR ANOTHER LEG DOWN?
$RENDER /USDT is facing intense bearish pressure, trading at $1.637 (-3.54%) after a sharp rejection from $1.740 and a steep sell-off to $1.612. The 1H chart shows a strong bearish impulse followed by a volatile relief bounce, but bulls still need confirmation! 🎯 Potential LONG Setup: Entry $1.640–$1.662 after bullish confirmation | TP1: $1.690 | TP2: $1.718 | Stop Loss: $1.605. ⚡ Key resistance: $1.662; reclaiming this level with strong buying volume could trigger a recovery toward $1.690. However, rejection near resistance could send price back toward $1.612, while a confirmed breakdown may expose $1.605. Watch the $1.612 support and $1.662 resistance closely—wait for a decisive candle close and volume confirmation before entering. Protect your capital and avoid chasing volatile candles! 📊 #RENDER #RENDERUSDT #CryptoTrading #Binance #Altcoins #TechnicalAnalysis #TradingSetup
#render
🚨 $RENDER FLASH CRASH! 🔥 BOUNCE SETUP OR ANOTHER LEG DOWN?
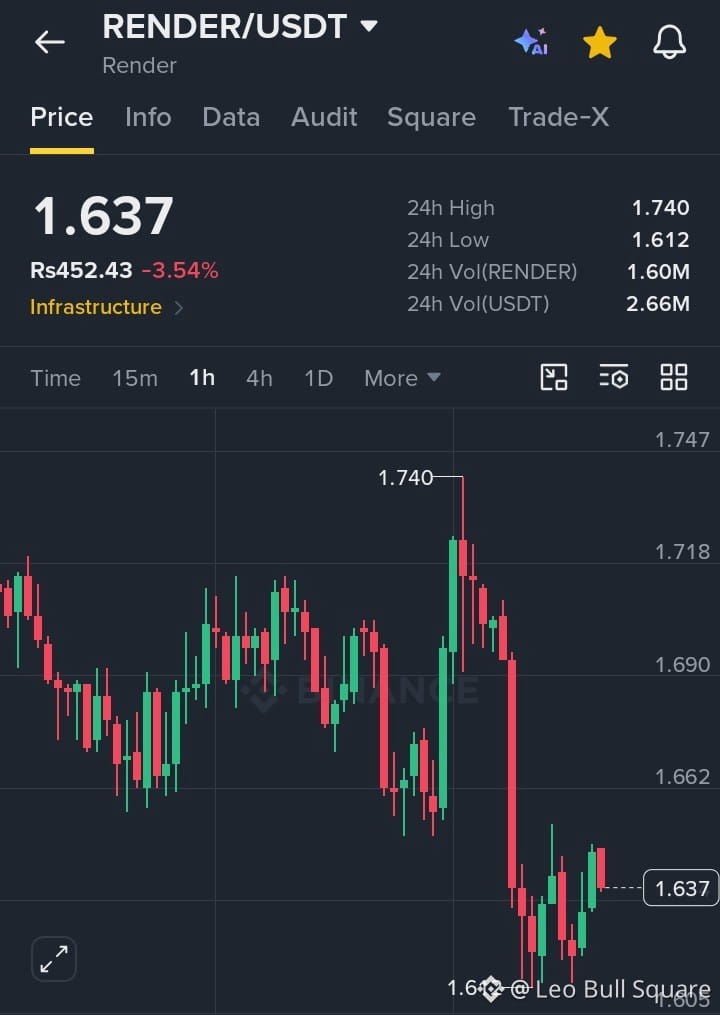
$RENDER /USDT is facing intense bearish pressure, trading at $1.637 (-3.54%) after a sharp rejection from $1.740 and a steep sell-off to $1.612. The 1H chart shows a strong bearish impulse followed by a volatile relief bounce, but bulls still need confirmation! 🎯 Potential LONG Setup: Entry $1.640–$1.662 after bullish confirmation | TP1: $1.690 | TP2: $1.718 | Stop Loss: $1.605. ⚡ Key resistance: $1.662; reclaiming this level with strong buying volume could trigger a recovery toward $1.690. However, rejection near resistance could send price back toward $1.612, while a confirmed breakdown may expose $1.605. Watch the $1.612 support and $1.662 resistance closely—wait for a decisive candle close and volume confirmation before entering. Protect your capital and avoid chasing volatile candles! 📊 #RENDER #RENDERUSDT #CryptoTrading #Binance #Altcoins #TechnicalAnalysis #TradingSetup
#render
$RENDER /USDT is facing intense bearish pressure, trading at $1.637 (-3.54%) after a sharp rejection from $1.740 and a steep sell-off to $1.612. The 1H chart shows a strong bearish impulse followed by a volatile relief bounce, but bulls still need confirmation! 🎯 Potential LONG Setup: Entry $1.640–$1.662 after bullish confirmation | TP1: $1.690 | TP2: $1.718 | Stop Loss: $1.605. ⚡ Key resistance: $1.662; reclaiming this level with strong buying volume could trigger a recovery toward $1.690. However, rejection near resistance could send price back toward $1.612, while a confirmed breakdown may expose $1.605. Watch the $1.612 support and $1.662 resistance closely—wait for a decisive candle close and volume confirmation before entering. Protect your capital and avoid chasing volatile candles! 📊 #RENDER #RENDERUSDT #CryptoTrading #Binance #Altcoins #TechnicalAnalysis #TradingSetup
#render
2
128

·
--
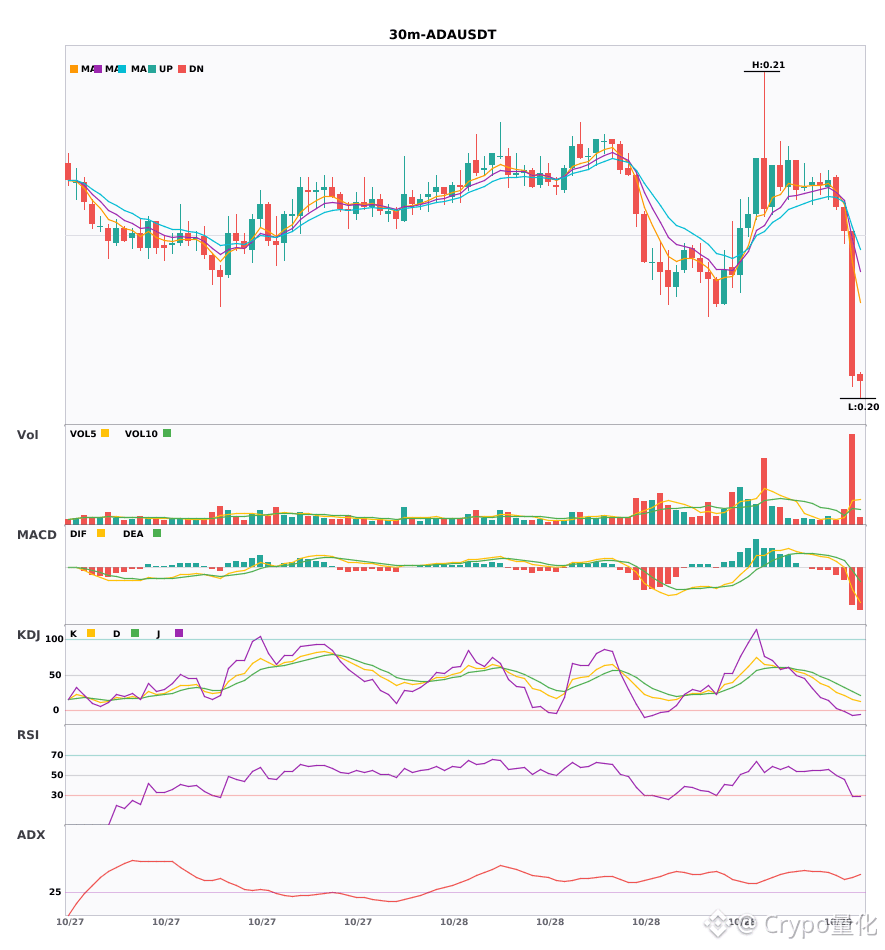
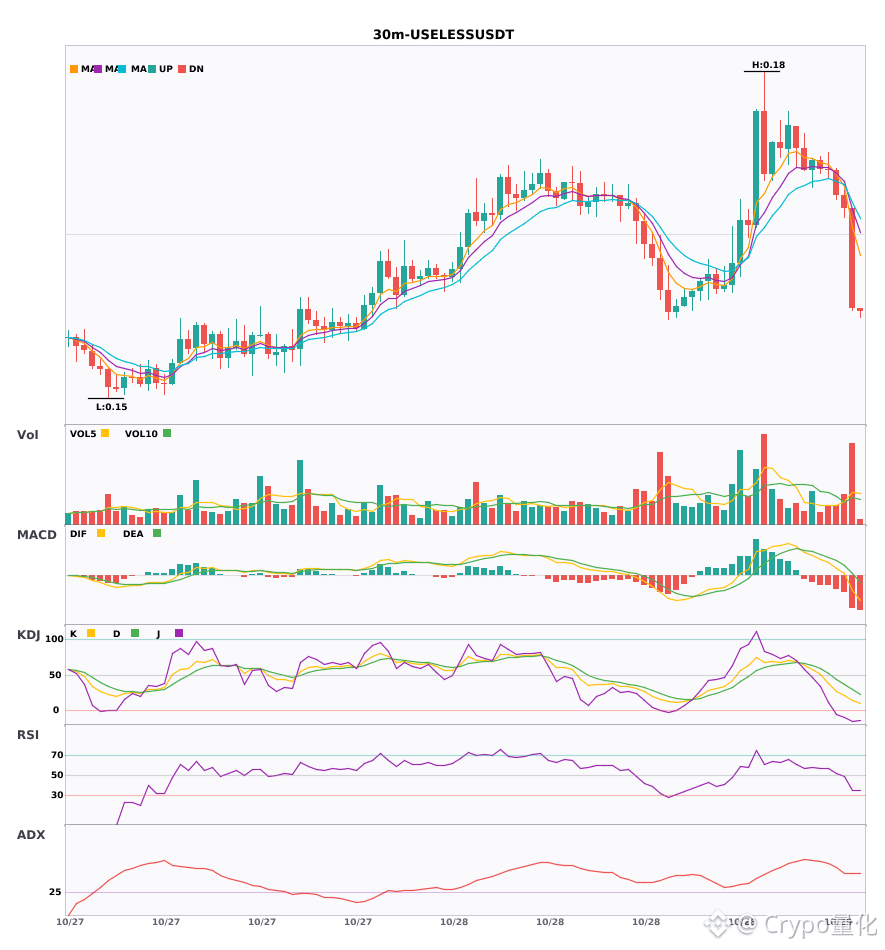
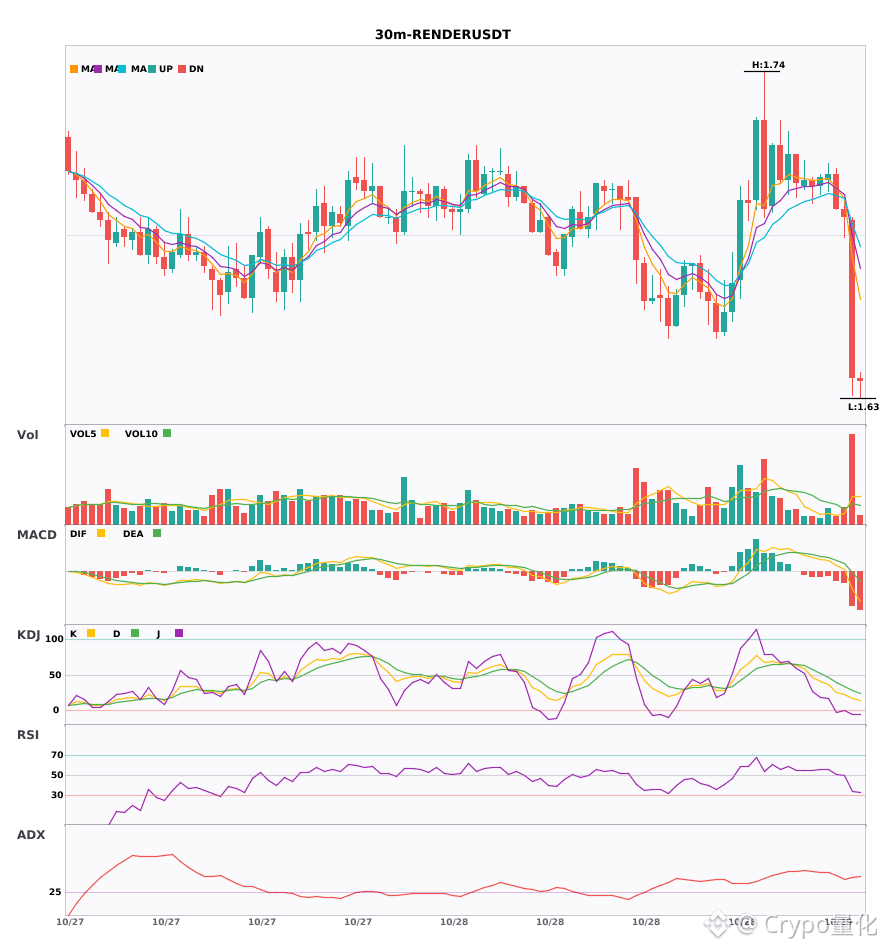
$ADA / $USELESS / $RENDER 30-minute technical indicators are weakening in sync. Watch out for risk 🔥
════════════════════
🟢 $ADA 30-minute bearish signal
⚠️Technical analysis: ADX(44): Clear trending market | MACD is bearish, trend is weak, momentum is strengthening | EMA5 < EMA8 < EMA13, bearish alignment | KDJ is weak, bears are in control (K: 15.5, D: 26.5) | Volume surge (5.5x)
════════════════════
🟢 $USELESS 30-minute bearish signal
⚠️Technical analysis: ADX(47): Very strong trend (beware of a possible overheated pullback) | MACD DIF has fallen below the zero line, signaling a bearish trend | EMA5 < EMA8 < EMA13, bearish alignment | KDJ is weak, bears are in control (K: 14.5, D: 29.0) | Volume surge (3.0x)
════════════════════
🟢 $RENDER 30-minute bearish signal
⚠️Technical analysis: ADX(43): Clear trending market | MACD DIF has fallen below the zero line, signaling a bearish trend | EMA5 < EMA8 < EMA13, bearish alignment | KDJ is weak, bears are in control (K: 17.4, D: 28.5) | Volume surge (4.2x)
════════════════════
🔔 Follow for real-time market alerts 🔔
#技术分析 #ADA #USELESS #RENDER
📌 When trading, pay attention to whether the candlestick pattern confirms the signal.
$ADA / $USELESS / $RENDER 30-minute technical indicators are weakening in sync. Watch out for risk 🔥
════════════════════
🟢 $ADA 30-minute bearish signal
⚠️Technical analysis: ADX(44): Clear trending market | MACD is bearish, trend is weak, momentum is strengthening | EMA5 < EMA8 < EMA13, bearish alignment | KDJ is weak, bears are in control (K: 15.5, D: 26.5) | Volume surge (5.5x)
════════════════════
🟢 $USELESS 30-minute bearish signal
⚠️Technical analysis: ADX(47): Very strong trend (beware of a possible overheated pullback) | MACD DIF has fallen below the zero line, signaling a bearish trend | EMA5 < EMA8 < EMA13, bearish alignment | KDJ is weak, bears are in control (K: 14.5, D: 29.0) | Volume surge (3.0x)
════════════════════
🟢 $RENDER 30-minute bearish signal
⚠️Technical analysis: ADX(43): Clear trending market | MACD DIF has fallen below the zero line, signaling a bearish trend | EMA5 < EMA8 < EMA13, bearish alignment | KDJ is weak, bears are in control (K: 17.4, D: 28.5) | Volume surge (4.2x)
════════════════════
🔔 Follow for real-time market alerts 🔔
#技术分析 #ADA #USELESS #RENDER
📌 When trading, pay attention to whether the candlestick pattern confirms the signal.
════════════════════
🟢 $ADA 30-minute bearish signal
⚠️Technical analysis: ADX(44): Clear trending market | MACD is bearish, trend is weak, momentum is strengthening | EMA5 < EMA8 < EMA13, bearish alignment | KDJ is weak, bears are in control (K: 15.5, D: 26.5) | Volume surge (5.5x)
════════════════════
🟢 $USELESS 30-minute bearish signal
⚠️Technical analysis: ADX(47): Very strong trend (beware of a possible overheated pullback) | MACD DIF has fallen below the zero line, signaling a bearish trend | EMA5 < EMA8 < EMA13, bearish alignment | KDJ is weak, bears are in control (K: 14.5, D: 29.0) | Volume surge (3.0x)
════════════════════
🟢 $RENDER 30-minute bearish signal
⚠️Technical analysis: ADX(43): Clear trending market | MACD DIF has fallen below the zero line, signaling a bearish trend | EMA5 < EMA8 < EMA13, bearish alignment | KDJ is weak, bears are in control (K: 17.4, D: 28.5) | Volume surge (4.2x)
════════════════════
🔔 Follow for real-time market alerts 🔔
#技术分析 #ADA #USELESS #RENDER
📌 When trading, pay attention to whether the candlestick pattern confirms the signal.
7

·
--
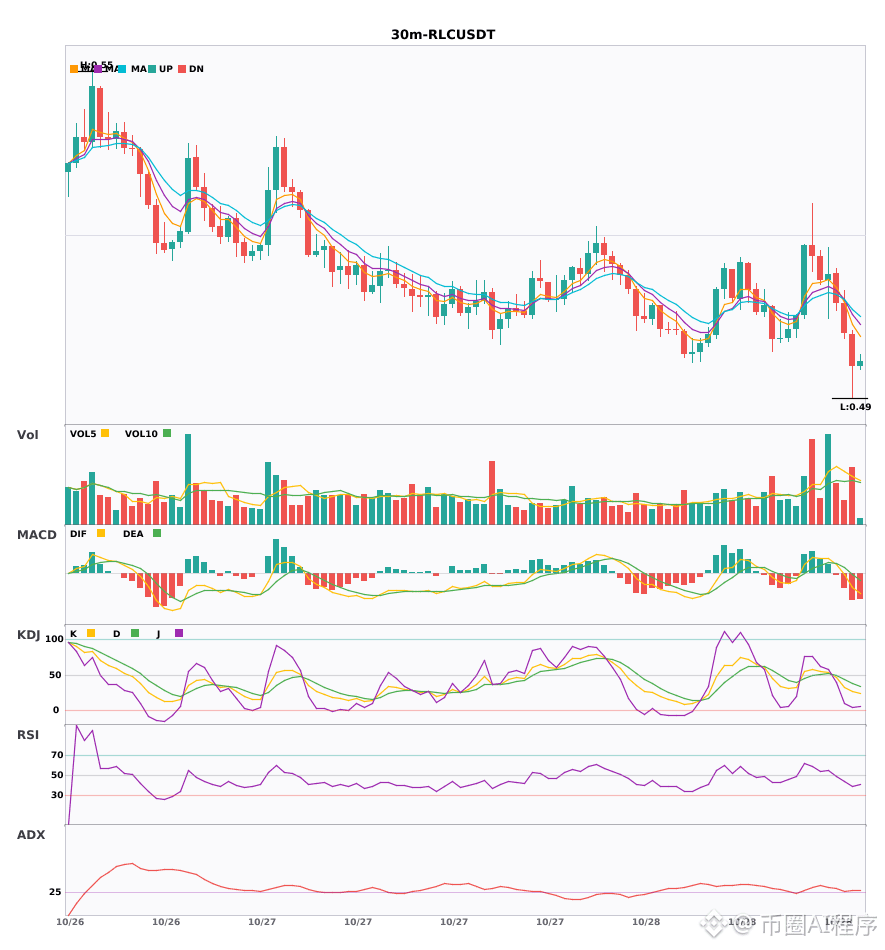
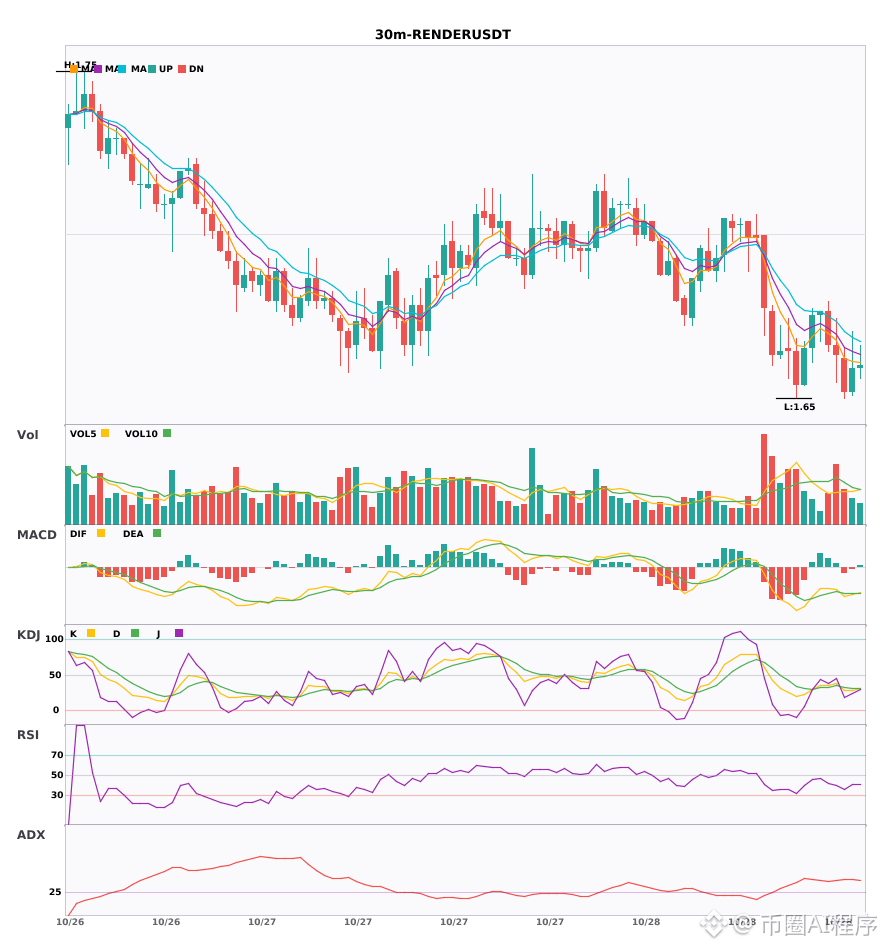
$RLC / $RENDER 30-minute bearish signals + 4-hour bearish trend aligned; multi-timeframe confluence signals a shift to bearish 🔥
════════════════════
🟢 $RLC 30-minute bearish signal
⚠️ Technical analysis: 4-hour bearish confluence confirmed | 30-minute entry: MACD bearish, trend weak, momentum strengthening | EMA5 < EMA8 < EMA13, bearish alignment | KDJ weak, bears in control (K: 27.5, D: 38.7) | Normal volume (1.3x)
════════════════════
🟢 $RENDER 30-minute bearish signal
⚠️ Technical analysis: 4-hour bearish confluence confirmed | 30-minute entry: MACD bearish crossover below zero, bearish momentum accelerating | EMA5 < EMA8 < EMA13, bearish alignment | KDJ bearish crossover, short-term outlook bearish (K: 27.7, D: 32.4) | Normal volume (1.3x)
════════════════════
🔔 Follow for firsthand market movement alerts 🔔
#多周期共振 #RLC #RENDER
📌 When trading, pay attention to whether the candlestick pattern confirms the setup
$RLC / $RENDER 30-minute bearish signals + 4-hour bearish trend aligned; multi-timeframe confluence signals a shift to bearish 🔥
════════════════════
🟢 $RLC 30-minute bearish signal
⚠️ Technical analysis: 4-hour bearish confluence confirmed | 30-minute entry: MACD bearish, trend weak, momentum strengthening | EMA5 < EMA8 < EMA13, bearish alignment | KDJ weak, bears in control (K: 27.5, D: 38.7) | Normal volume (1.3x)
════════════════════
🟢 $RENDER 30-minute bearish signal
⚠️ Technical analysis: 4-hour bearish confluence confirmed | 30-minute entry: MACD bearish crossover below zero, bearish momentum accelerating | EMA5 < EMA8 < EMA13, bearish alignment | KDJ bearish crossover, short-term outlook bearish (K: 27.7, D: 32.4) | Normal volume (1.3x)
════════════════════
🔔 Follow for firsthand market movement alerts 🔔
#多周期共振 #RLC #RENDER
📌 When trading, pay attention to whether the candlestick pattern confirms the setup
════════════════════
🟢 $RLC 30-minute bearish signal
⚠️ Technical analysis: 4-hour bearish confluence confirmed | 30-minute entry: MACD bearish, trend weak, momentum strengthening | EMA5 < EMA8 < EMA13, bearish alignment | KDJ weak, bears in control (K: 27.5, D: 38.7) | Normal volume (1.3x)
════════════════════
🟢 $RENDER 30-minute bearish signal
⚠️ Technical analysis: 4-hour bearish confluence confirmed | 30-minute entry: MACD bearish crossover below zero, bearish momentum accelerating | EMA5 < EMA8 < EMA13, bearish alignment | KDJ bearish crossover, short-term outlook bearish (K: 27.7, D: 32.4) | Normal volume (1.3x)
════════════════════
🔔 Follow for firsthand market movement alerts 🔔
#多周期共振 #RLC #RENDER
📌 When trading, pay attention to whether the candlestick pattern confirms the setup
17

·
--
Bearish
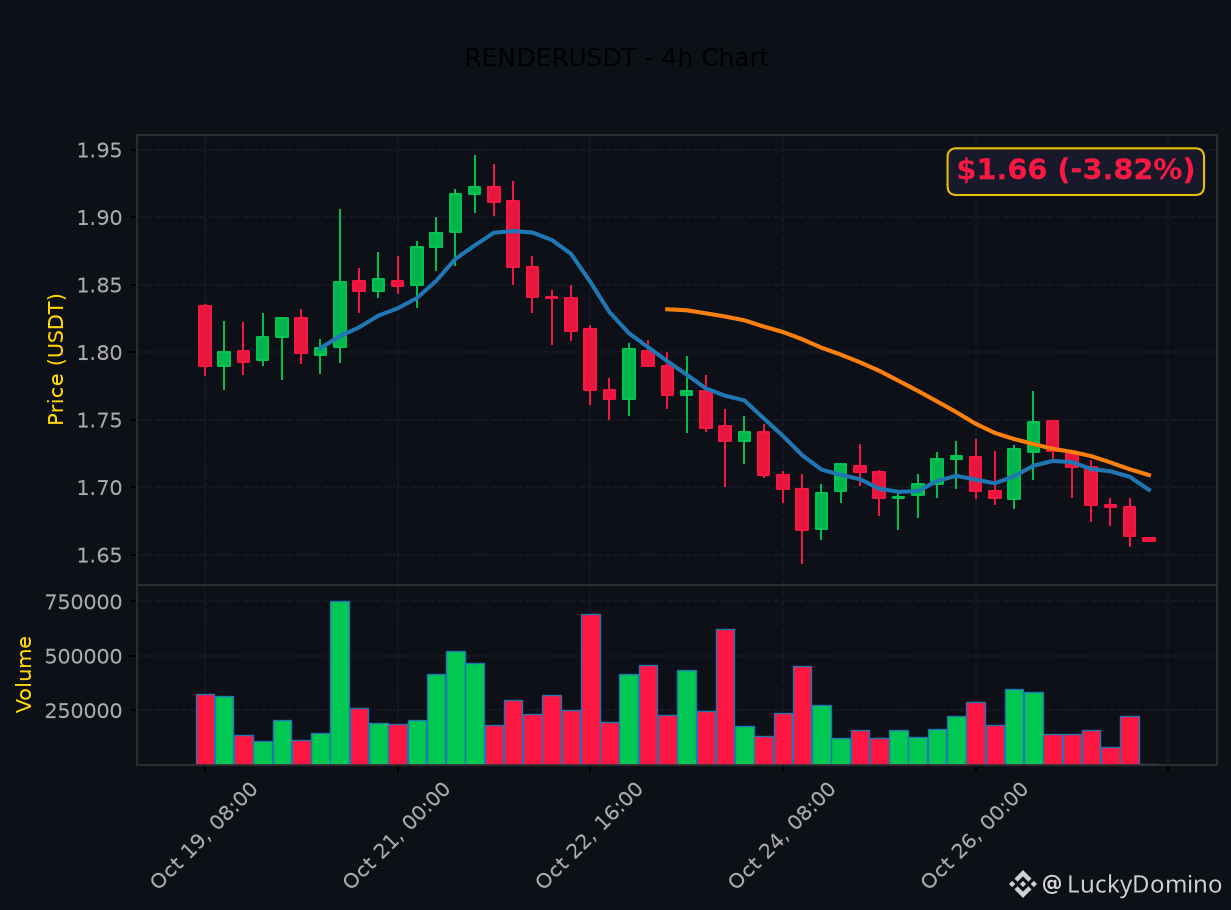
$RENDER Price Prediction Today: Render Crypto Signal & Technical Analysis 📊
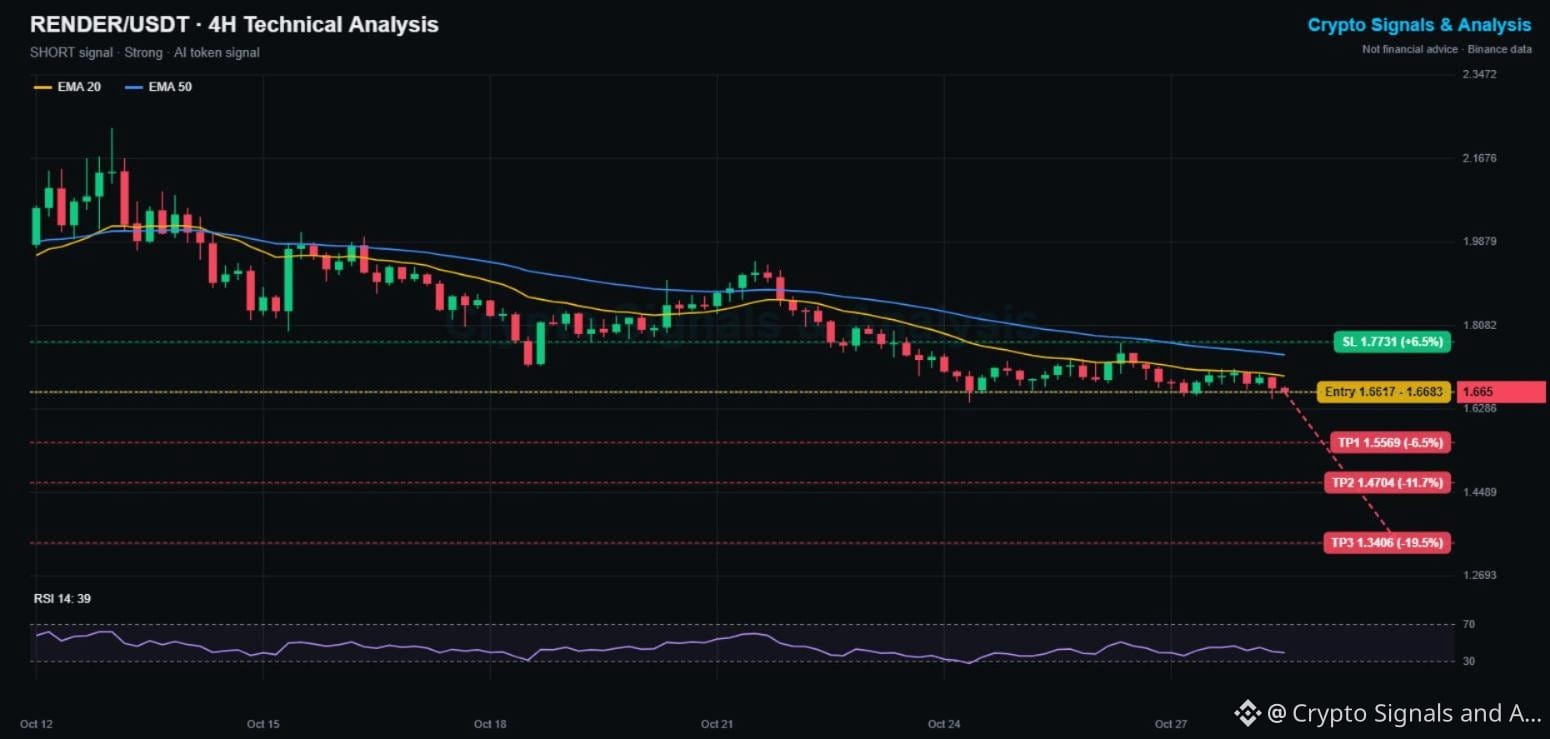
🔴 SHORT | Entry 1.662 - 1.668 | TP1 1.557 | SL 1.773
👉 Tap $RENDER to place your trade fast
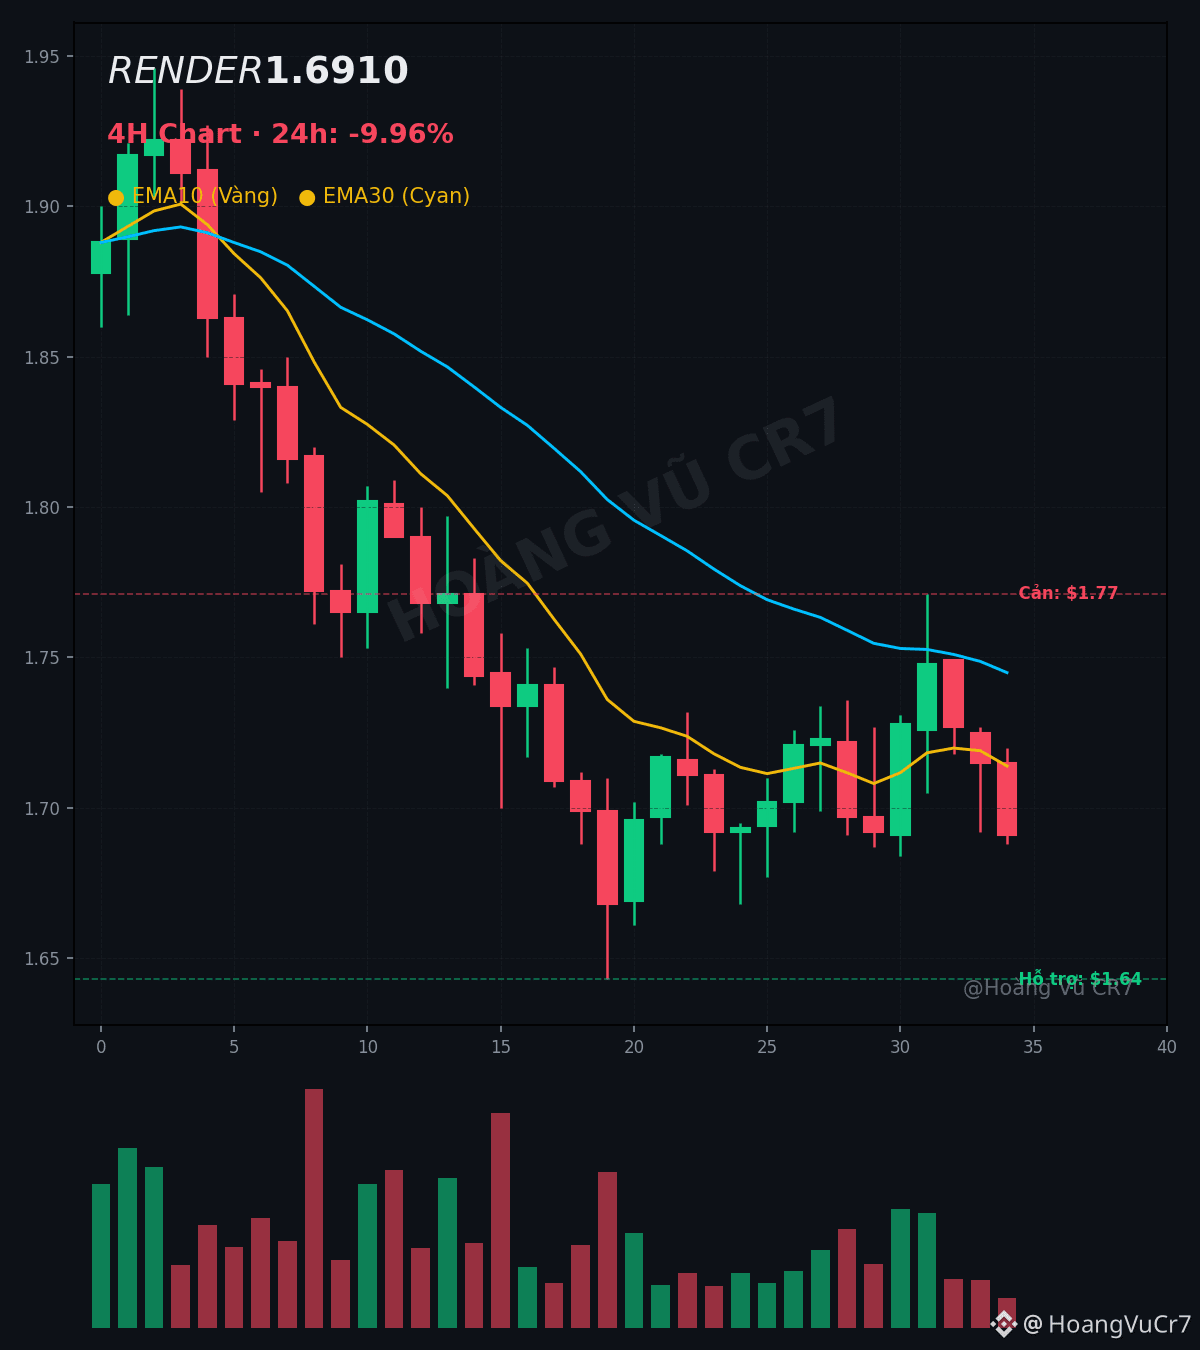
Render, the AI and GPU computing token, is down 13% this week and 25% since Oct 13 (from 2.23 to 1.65). It just slipped to a new low for the week, and the 4H EMAs keep pressing it lower.
📌 RENDER TRADING SIGNAL (Strong, 5/5 signals agree)
Entry: 1.662 - 1.668
Take profit 1: 1.557 (-6.5%)
Take profit 2: 1.470 (-11.7%)
Take profit 3: 1.341 (-19.5%)
Stop loss: 1.773 (+6.5%)
📊 RENDER TECHNICAL ANALYSIS (4H CHART)
Price is under the EMA20 (1.700) and EMA50 (1.745), both are falling, and RSI at 39 shows sellers in control. The 1.643 to 1.65 zone is the last support from Oct 24. A clean break below it has no nearby floor until the 1.50s.
🔑 KEY LEVELS
Support: 1.643, then 1.557
Resistance: 1.700 (EMA20), then 1.771
📈 Bullish scenario: a 4H close above 1.773 breaks the downtrend and cancels the short.
📉 Bearish scenario: a close under 1.643 confirms the breakdown toward TP1 and TP2.
💡 Bottom line: AI tokens are the weakest sector this week, and Render's trend is clearly down.
👉 Tap $RENDER
to open the live chart. NFA
🔥 TRADE WITH LOWER FEES
✅ Get a 20% kickback on your Binance trading fees, for life
👇👇👇
{spot}(RENDERUSDT)
[Claim your 20% Binance fee kickback here](https://www.binance.com/register?ref=X0NQWZ4N)
━━━━━━━━━━
AI crypto sell-off: buying opportunity or warning sign? 👇
Follow Crypto Signals and Analysis for daily signals.
#cryptosignals #RENDER #CanGoogleDefendItsCore
⚠️ Crypto is volatile: risk only what you can afford to lose.
$RENDER Price Prediction Today: Render Crypto Signal & Technical Analysis 📊
🔴 SHORT | Entry 1.662 - 1.668 | TP1 1.557 | SL 1.773
👉 Tap $RENDER to place your trade fast
Render, the AI and GPU computing token, is down 13% this week and 25% since Oct 13 (from 2.23 to 1.65). It just slipped to a new low for the week, and the 4H EMAs keep pressing it lower.
📌 RENDER TRADING SIGNAL (Strong, 5/5 signals agree)
Entry: 1.662 - 1.668
Take profit 1: 1.557 (-6.5%)
Take profit 2: 1.470 (-11.7%)
Take profit 3: 1.341 (-19.5%)
Stop loss: 1.773 (+6.5%)
📊 RENDER TECHNICAL ANALYSIS (4H CHART)
Price is under the EMA20 (1.700) and EMA50 (1.745), both are falling, and RSI at 39 shows sellers in control. The 1.643 to 1.65 zone is the last support from Oct 24. A clean break below it has no nearby floor until the 1.50s.
🔑 KEY LEVELS
Support: 1.643, then 1.557
Resistance: 1.700 (EMA20), then 1.771
📈 Bullish scenario: a 4H close above 1.773 breaks the downtrend and cancels the short.
📉 Bearish scenario: a close under 1.643 confirms the breakdown toward TP1 and TP2.
💡 Bottom line: AI tokens are the weakest sector this week, and Render's trend is clearly down.
👉 Tap $RENDER
to open the live chart. NFA
🔥 TRADE WITH LOWER FEES
✅ Get a 20% kickback on your Binance trading fees, for life
👇👇👇
Claim your 20% Binance fee kickback here
━━━━━━━━━━
AI crypto sell-off: buying opportunity or warning sign? 👇
Follow Crypto Signals and Analysis for daily signals.
#cryptosignals #RENDER #CanGoogleDefendItsCore
⚠️ Crypto is volatile: risk only what you can afford to lose.
🔴 SHORT | Entry 1.662 - 1.668 | TP1 1.557 | SL 1.773
👉 Tap $RENDER to place your trade fast
Render, the AI and GPU computing token, is down 13% this week and 25% since Oct 13 (from 2.23 to 1.65). It just slipped to a new low for the week, and the 4H EMAs keep pressing it lower.
📌 RENDER TRADING SIGNAL (Strong, 5/5 signals agree)
Entry: 1.662 - 1.668
Take profit 1: 1.557 (-6.5%)
Take profit 2: 1.470 (-11.7%)
Take profit 3: 1.341 (-19.5%)
Stop loss: 1.773 (+6.5%)
📊 RENDER TECHNICAL ANALYSIS (4H CHART)
Price is under the EMA20 (1.700) and EMA50 (1.745), both are falling, and RSI at 39 shows sellers in control. The 1.643 to 1.65 zone is the last support from Oct 24. A clean break below it has no nearby floor until the 1.50s.
🔑 KEY LEVELS
Support: 1.643, then 1.557
Resistance: 1.700 (EMA20), then 1.771
📈 Bullish scenario: a 4H close above 1.773 breaks the downtrend and cancels the short.
📉 Bearish scenario: a close under 1.643 confirms the breakdown toward TP1 and TP2.
💡 Bottom line: AI tokens are the weakest sector this week, and Render's trend is clearly down.
👉 Tap $RENDER
to open the live chart. NFA
🔥 TRADE WITH LOWER FEES
✅ Get a 20% kickback on your Binance trading fees, for life
👇👇👇
Claim your 20% Binance fee kickback here
━━━━━━━━━━
AI crypto sell-off: buying opportunity or warning sign? 👇
Follow Crypto Signals and Analysis for daily signals.
#cryptosignals #RENDER #CanGoogleDefendItsCore
⚠️ Crypto is volatile: risk only what you can afford to lose.
53

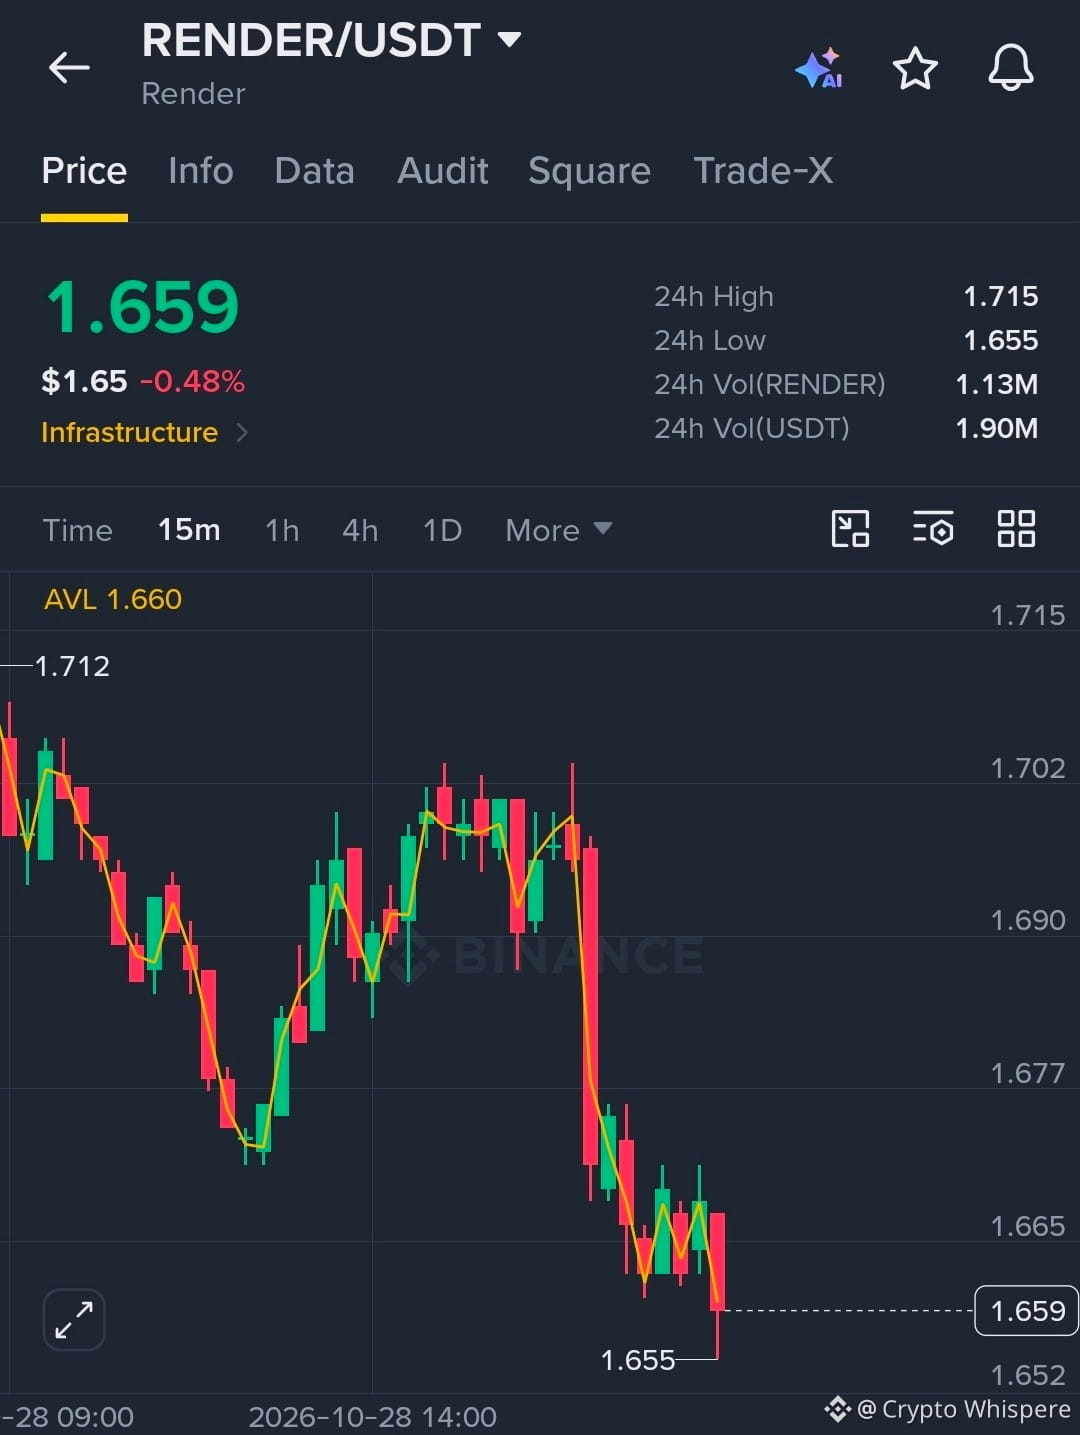
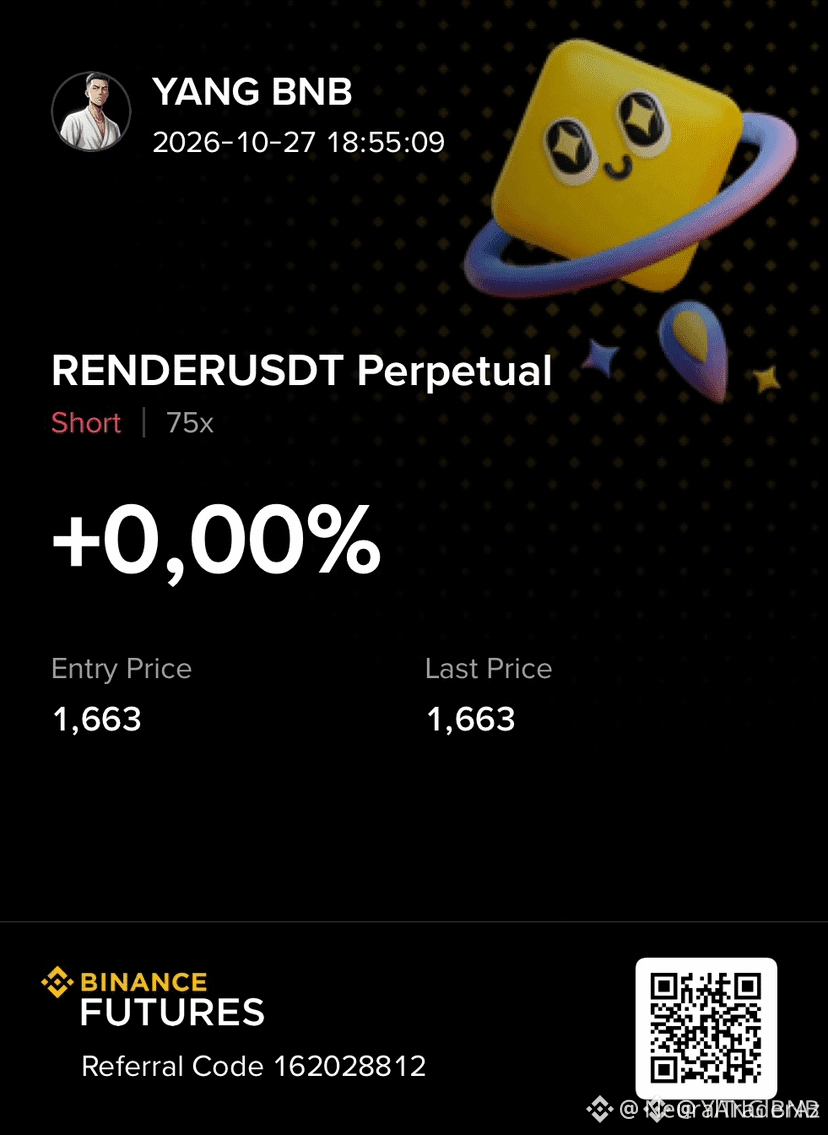
$RENDER SHORT TRADE 🛑
Entry Zone: $1.659–$1.665
SL: $1.677
TP1: $1.655
TP2: $1.652
TP3: $1.645
RENDER is showing strong bearish momentum on the 15-minute chart after a sharp breakdown from the $1.695–$1.700 resistance zone. Price is trading below the recent support levels, while sellers remain in control. A break below $1.655 could trigger further downside.
#RENDER #CryptoSignals #TechnicalAnalysis
{spot}(RENDERUSDT)
$RENDER SHORT TRADE 🛑
Entry Zone: $1.659–$1.665
SL: $1.677
TP1: $1.655
TP2: $1.652
TP3: $1.645
RENDER is showing strong bearish momentum on the 15-minute chart after a sharp breakdown from the $1.695–$1.700 resistance zone. Price is trading below the recent support levels, while sellers remain in control. A break below $1.655 could trigger further downside.
#RENDER #CryptoSignals #TechnicalAnalysis
Entry Zone: $1.659–$1.665
SL: $1.677
TP1: $1.655
TP2: $1.652
TP3: $1.645
RENDER is showing strong bearish momentum on the 15-minute chart after a sharp breakdown from the $1.695–$1.700 resistance zone. Price is trading below the recent support levels, while sellers remain in control. A break below $1.655 could trigger further downside.
#RENDER #CryptoSignals #TechnicalAnalysis
40

·
--
Your stop on $RENDER at $1.6560 is closer than the noise and that is why you keep getting wicked out
Most people pick a round percentage to risk instead of looking at what the actual chart is doing
Right now $RENDER trades at $1.6960 with a normal hourly swing of 1.1 percent which eats up tiny buffers instantly
If you set your stop tighter than that hourly swing market noise just hunts your position for free liquidity
A proper stop belongs below the swing low that actually invalidates the idea not at an arbitrary number
Where do you usually put your stops when you trade
#RENDER #TradingTips
Your stop on $RENDER at $1.6560 is closer than the noise and that is why you keep getting wicked out
Most people pick a round percentage to risk instead of looking at what the actual chart is doing
Right now $RENDER trades at $1.6960 with a normal hourly swing of 1.1 percent which eats up tiny buffers instantly
If you set your stop tighter than that hourly swing market noise just hunts your position for free liquidity
A proper stop belongs below the swing low that actually invalidates the idea not at an arbitrary number
Where do you usually put your stops when you trade
#RENDER #TradingTips
Most people pick a round percentage to risk instead of looking at what the actual chart is doing
Right now $RENDER trades at $1.6960 with a normal hourly swing of 1.1 percent which eats up tiny buffers instantly
If you set your stop tighter than that hourly swing market noise just hunts your position for free liquidity
A proper stop belongs below the swing low that actually invalidates the idea not at an arbitrary number
Where do you usually put your stops when you trade
#RENDER #TradingTips
3

$RENDER is the GPU coin to watch into tonight's Big Tech earnings 🎨
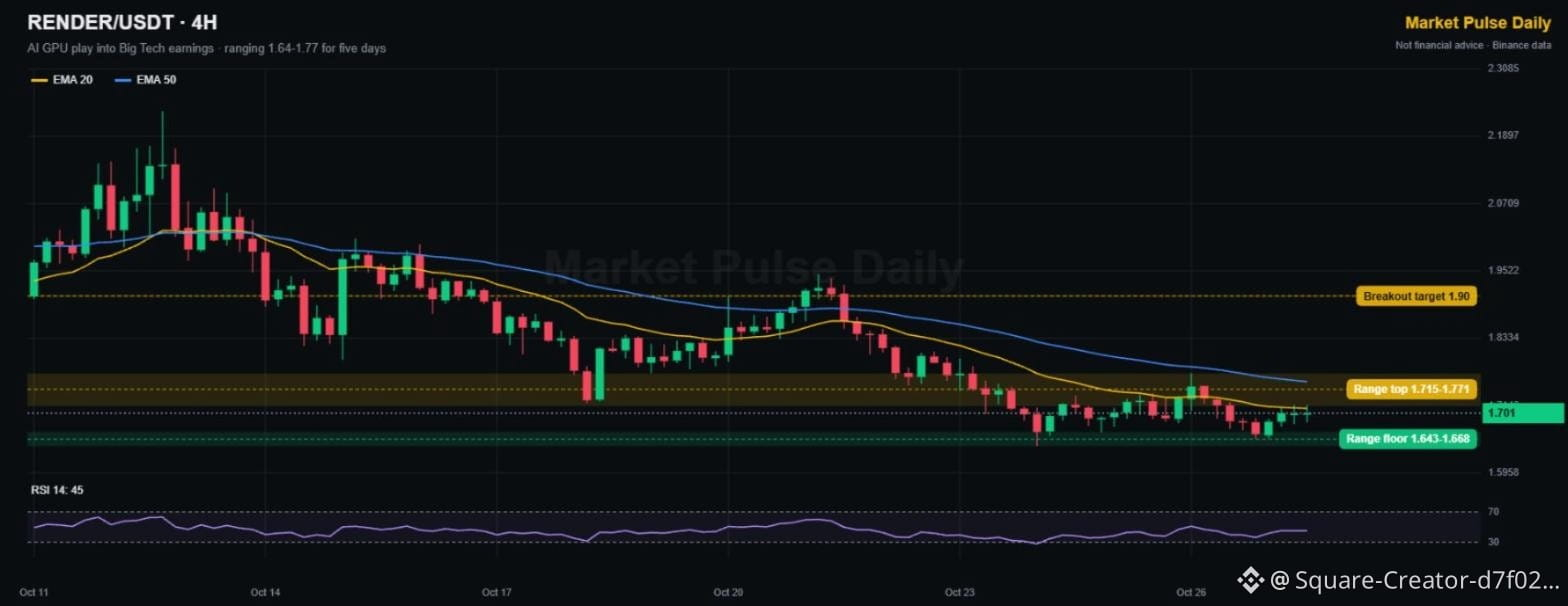
Microsoft and Alphabet will update the market on AI spending after the close. Render, the decentralized GPU network, has been ranging 1.64-1.77 for five days, coiling right under its 4H EMA50.
🟢 Range floor: 1.643-1.668
🔴 Range top: 1.715-1.771
🎯 Breakout target: 1.90
Strong AI capex numbers could be the spark for a range break. Weak ones and the floor gets tested.
👉 Tap $RENDER
for the live chart. NFA
Can Microsoft deliver on AI tonight? 👇
#Render #AIcrypto #CanMicrosoftDeliverOnAI
No Binance account yet? Get 20% of your trading fees back 👉 [Sign up on Binance](https://www.binance.com/register?ref=TGCSTKKM)
{spot}(RENDERUSDT)
$RENDER is the GPU coin to watch into tonight's Big Tech earnings 🎨
Microsoft and Alphabet will update the market on AI spending after the close. Render, the decentralized GPU network, has been ranging 1.64-1.77 for five days, coiling right under its 4H EMA50.
🟢 Range floor: 1.643-1.668
🔴 Range top: 1.715-1.771
🎯 Breakout target: 1.90
Strong AI capex numbers could be the spark for a range break. Weak ones and the floor gets tested.
👉 Tap $RENDER
for the live chart. NFA
Can Microsoft deliver on AI tonight? 👇
#Render #AIcrypto #CanMicrosoftDeliverOnAI
No Binance account yet? Get 20% of your trading fees back 👉 Sign up on Binance
Microsoft and Alphabet will update the market on AI spending after the close. Render, the decentralized GPU network, has been ranging 1.64-1.77 for five days, coiling right under its 4H EMA50.
🟢 Range floor: 1.643-1.668
🔴 Range top: 1.715-1.771
🎯 Breakout target: 1.90
Strong AI capex numbers could be the spark for a range break. Weak ones and the floor gets tested.
👉 Tap $RENDER
for the live chart. NFA
Can Microsoft deliver on AI tonight? 👇
#Render #AIcrypto #CanMicrosoftDeliverOnAI
No Binance account yet? Get 20% of your trading fees back 👉 Sign up on Binance
25
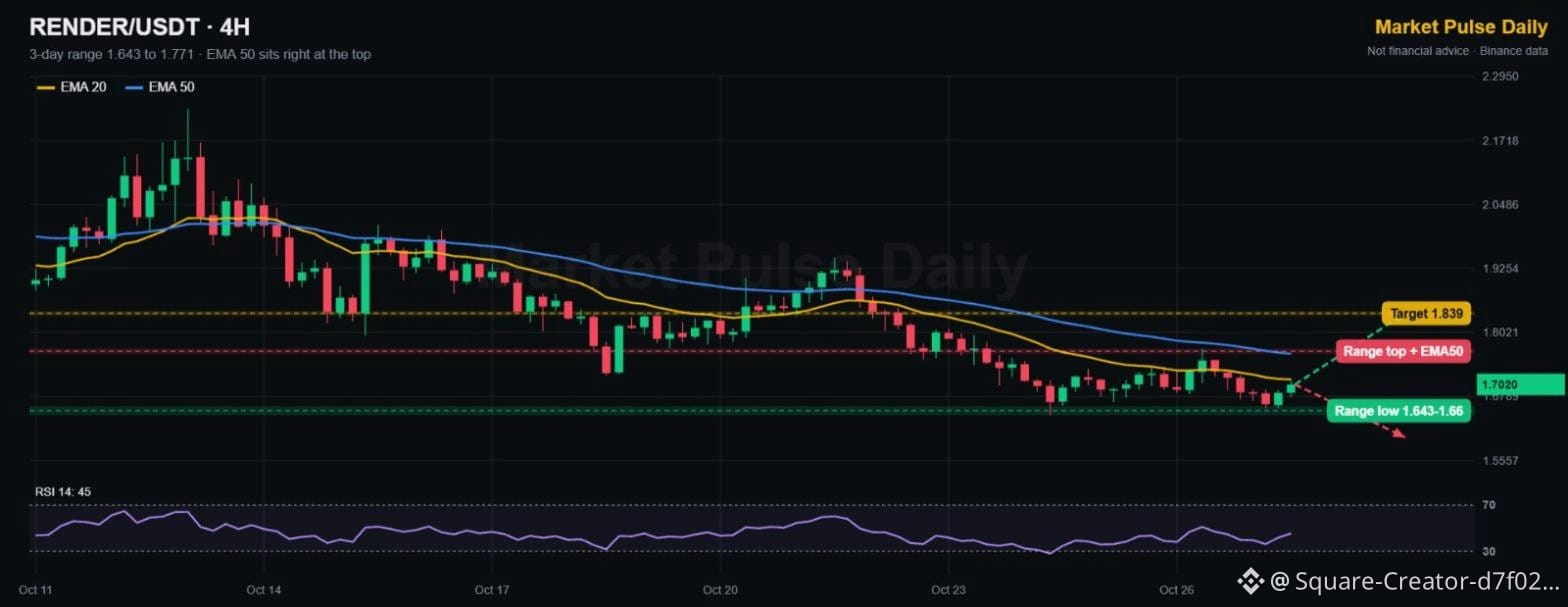
$RENDER has been boxed between 1.643 and 1.771 for 3 days. AI coins need a catalyst, and this chart is waiting for one 🤖
Structure (4H):
• Range low: 1.643 (Oct 24), retested at 1.656 today
• Range top: 1.771, where EMA 50 (1.761) also sits
• Price 1.702, right on EMA 20 (1.712)
• RSI 45.5. Down 7.8% on the week
Mid-range = no edge. The trade is at the edges of the box.
Levels for $RENDER :
🟢 4H close above 1.771 → box + EMA 50 cleared, 1.839 next
🔴 4H close below 1.643 → range breaks down, 1.60 next
↔️ Range trade: bids near 1.66, offers near 1.76
Are you holding $RENDER into the next AI run? 👇
NFA
#Render #AICrypto #TechnicalAnalysis
No Binance account yet? Get 20% of your trading fees back 👉 [Sign up on Binance](https://www.binance.com/register?ref=TGCSTKKM)
$RENDER has been boxed between 1.643 and 1.771 for 3 days. AI coins need a catalyst, and this chart is waiting for one 🤖
Structure (4H):
• Range low: 1.643 (Oct 24), retested at 1.656 today
• Range top: 1.771, where EMA 50 (1.761) also sits
• Price 1.702, right on EMA 20 (1.712)
• RSI 45.5. Down 7.8% on the week
Mid-range = no edge. The trade is at the edges of the box.
Levels for $RENDER :
🟢 4H close above 1.771 → box + EMA 50 cleared, 1.839 next
🔴 4H close below 1.643 → range breaks down, 1.60 next
↔️ Range trade: bids near 1.66, offers near 1.76
Are you holding $RENDER into the next AI run? 👇
NFA
#Render #AICrypto #TechnicalAnalysis
No Binance account yet? Get 20% of your trading fees back 👉 Sign up on Binance
Structure (4H):
• Range low: 1.643 (Oct 24), retested at 1.656 today
• Range top: 1.771, where EMA 50 (1.761) also sits
• Price 1.702, right on EMA 20 (1.712)
• RSI 45.5. Down 7.8% on the week
Mid-range = no edge. The trade is at the edges of the box.
Levels for $RENDER :
🟢 4H close above 1.771 → box + EMA 50 cleared, 1.839 next
🔴 4H close below 1.643 → range breaks down, 1.60 next
↔️ Range trade: bids near 1.66, offers near 1.76
Are you holding $RENDER into the next AI run? 👇
NFA
#Render #AICrypto #TechnicalAnalysis
No Binance account yet? Get 20% of your trading fees back 👉 Sign up on Binance
37

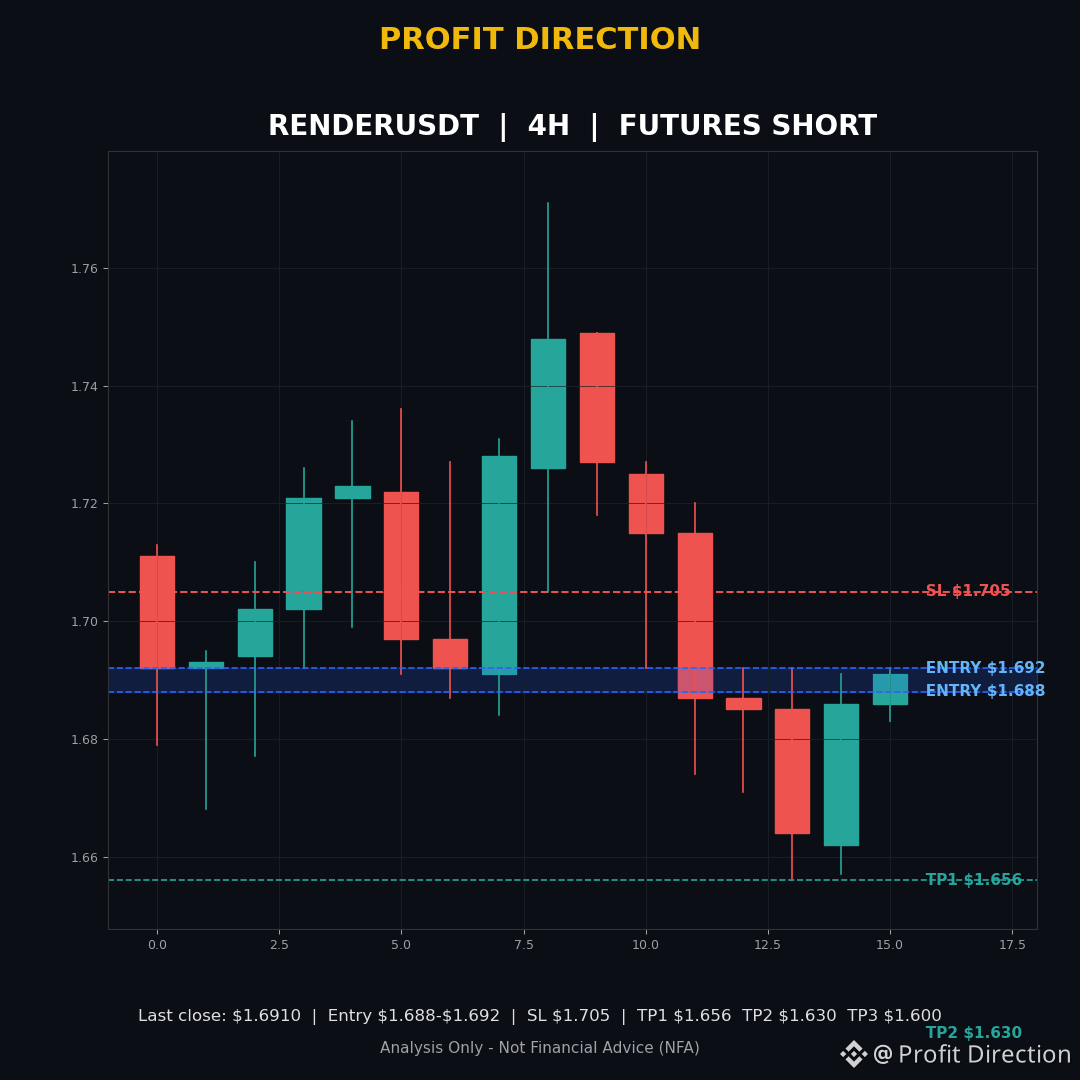
🔴 RENDERUSDT — FUTURES SHORT
Entry Zone: $1.688-$1.692
Stop Loss: $1.705
TP1: $1.656
TP2: $1.630
TP3: $1.600
R:R: 1:2.27 to TP1, 1:4.00 to TP2, 1:6.00 to TP3 (midpoint $1.690)
Timeframe: 4H
RENDER keeps getting turned away at the same ceiling, and it is sitting right there again as I write this.
Why I like this one: $1.692 has rejected price four times on the 4H chart today alone, and each bounce since the $1.771 high has stopped lower. If this ceiling holds once more, the move back down toward $1.656, then $1.630 and $1.600, opens up with strong reward against the risk. This is a resistance trade — it only works while price stays capped under the zone.
Invalidation: a 4H close above $1.705 breaks the rejection pattern and cancels this idea — do not hold a losing short hoping it turns around.
Analysis Only — Not Financial Advice (NFA). Trading involves risk.
Follow Profit Direction for more signals, best signals and market updates. Share your opinion in the comments.
#RENDER #RENDERUSDT #CryptoTrading #FuturesTrading
🔴 RENDERUSDT — FUTURES SHORT
Entry Zone: $1.688-$1.692
Stop Loss: $1.705
TP1: $1.656
TP2: $1.630
TP3: $1.600
R:R: 1:2.27 to TP1, 1:4.00 to TP2, 1:6.00 to TP3 (midpoint $1.690)
Timeframe: 4H
RENDER keeps getting turned away at the same ceiling, and it is sitting right there again as I write this.
Why I like this one: $1.692 has rejected price four times on the 4H chart today alone, and each bounce since the $1.771 high has stopped lower. If this ceiling holds once more, the move back down toward $1.656, then $1.630 and $1.600, opens up with strong reward against the risk. This is a resistance trade — it only works while price stays capped under the zone.
Invalidation: a 4H close above $1.705 breaks the rejection pattern and cancels this idea — do not hold a losing short hoping it turns around.
Analysis Only — Not Financial Advice (NFA). Trading involves risk.
Follow Profit Direction for more signals, best signals and market updates. Share your opinion in the comments.
#RENDER #RENDERUSDT #CryptoTrading #FuturesTrading
Entry Zone: $1.688-$1.692
Stop Loss: $1.705
TP1: $1.656
TP2: $1.630
TP3: $1.600
R:R: 1:2.27 to TP1, 1:4.00 to TP2, 1:6.00 to TP3 (midpoint $1.690)
Timeframe: 4H
RENDER keeps getting turned away at the same ceiling, and it is sitting right there again as I write this.
Why I like this one: $1.692 has rejected price four times on the 4H chart today alone, and each bounce since the $1.771 high has stopped lower. If this ceiling holds once more, the move back down toward $1.656, then $1.630 and $1.600, opens up with strong reward against the risk. This is a resistance trade — it only works while price stays capped under the zone.
Invalidation: a 4H close above $1.705 breaks the rejection pattern and cancels this idea — do not hold a losing short hoping it turns around.
Analysis Only — Not Financial Advice (NFA). Trading involves risk.
Follow Profit Direction for more signals, best signals and market updates. Share your opinion in the comments.
#RENDER #RENDERUSDT #CryptoTrading #FuturesTrading
21

RENDER vs ENA – Which AI & DeFi Gem Has Better Potential? 📊🚀
Current Market Prices:
• RENDER: ~$1.67
• ENA: ~$0.20
Both projects serve very different narratives in the crypto space:
1. RENDER (Render Network): Leading the AI, GPU computing, and decentralized rendering sector.
2. ENA (Ethena): Fast-growing synthetic dollar protocol disrupting DeFi yields.
Both are consolidation zones, but momentum can shift fast once market volume picks up. 💡
👇 Cast your vote below! Which one are you accumulating right now?
---
Poll Options:
- Bullish on $RENDER 🎨
- Bullish on $ENA 💵
- Holding Both 🔥
- Waiting for dip ⏳
#BinanceSquare #CryptoNews #Render #Ethena #Trading
{spot}(RENDERUSDT)
{spot}(ENAUSDT)
RENDER vs ENA – Which AI & DeFi Gem Has Better Potential? 📊🚀
Current Market Prices:
• RENDER: ~$1.67
• ENA: ~$0.20
Both projects serve very different narratives in the crypto space:
1. RENDER (Render Network): Leading the AI, GPU computing, and decentralized rendering sector.
2. ENA (Ethena): Fast-growing synthetic dollar protocol disrupting DeFi yields.
Both are consolidation zones, but momentum can shift fast once market volume picks up. 💡
👇 Cast your vote below! Which one are you accumulating right now?
---
Poll Options:
- Bullish on $RENDER 🎨
- Bullish on $ENA 💵
- Holding Both 🔥
- Waiting for dip ⏳
#BinanceSquare #CryptoNews #Render #Ethena #Trading
Current Market Prices:
• RENDER: ~$1.67
• ENA: ~$0.20
Both projects serve very different narratives in the crypto space:
1. RENDER (Render Network): Leading the AI, GPU computing, and decentralized rendering sector.
2. ENA (Ethena): Fast-growing synthetic dollar protocol disrupting DeFi yields.
Both are consolidation zones, but momentum can shift fast once market volume picks up. 💡
👇 Cast your vote below! Which one are you accumulating right now?
---
Poll Options:
- Bullish on $RENDER 🎨
- Bullish on $ENA 💵
- Holding Both 🔥
- Waiting for dip ⏳
#BinanceSquare #CryptoNews #Render #Ethena #Trading
Render
71%
ENA
29%
17 votes • Voting closed
412

·
--
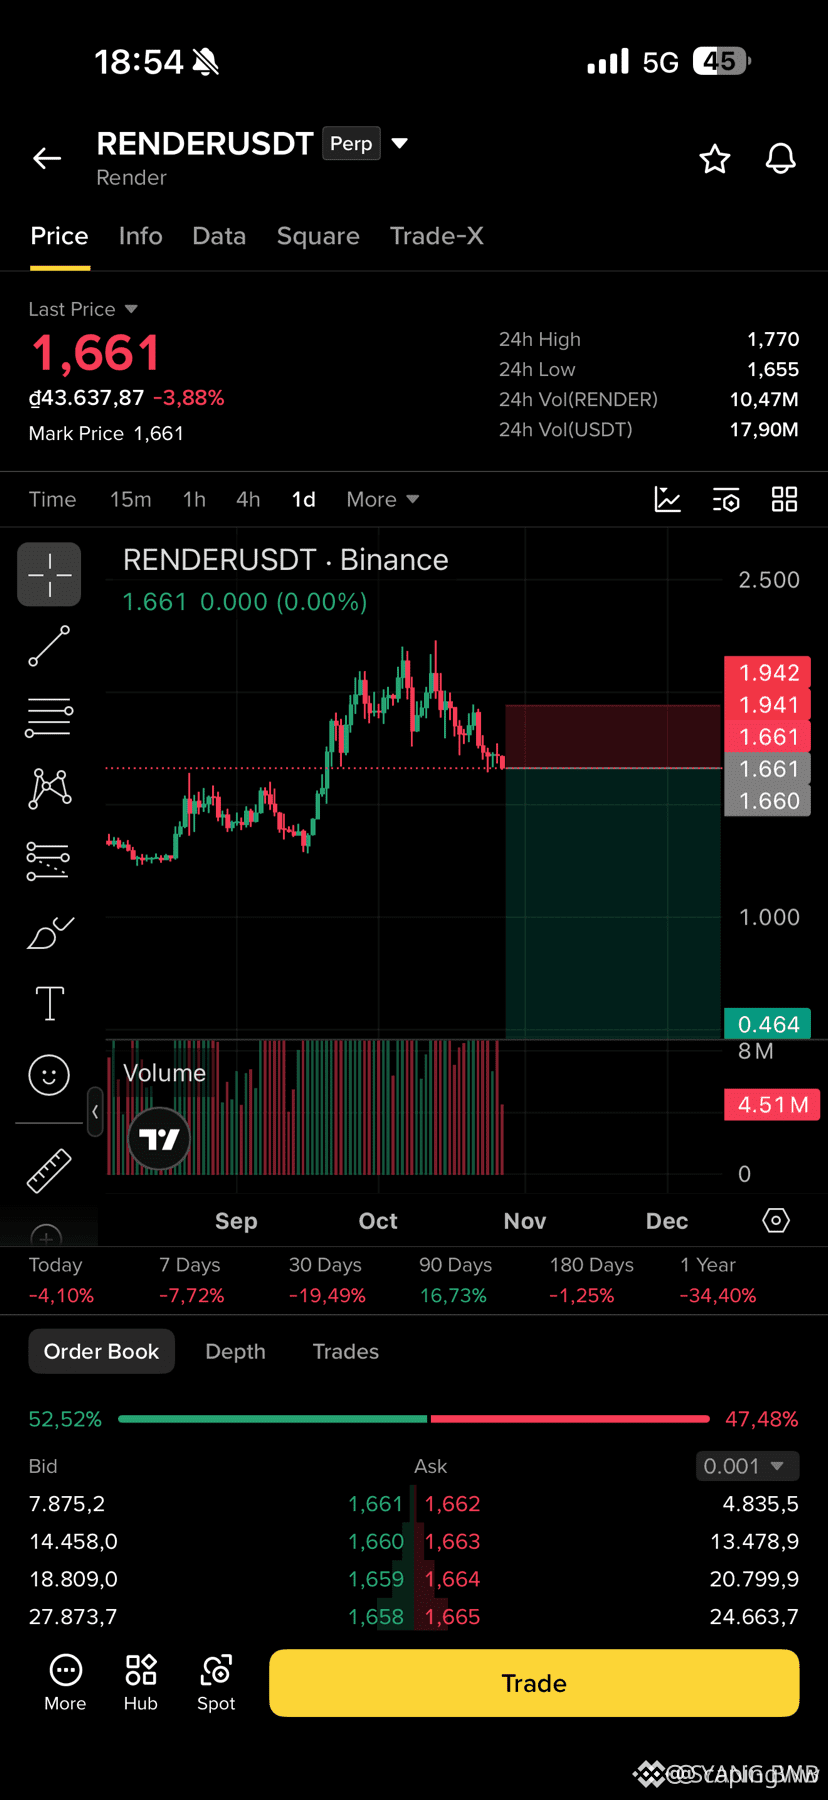
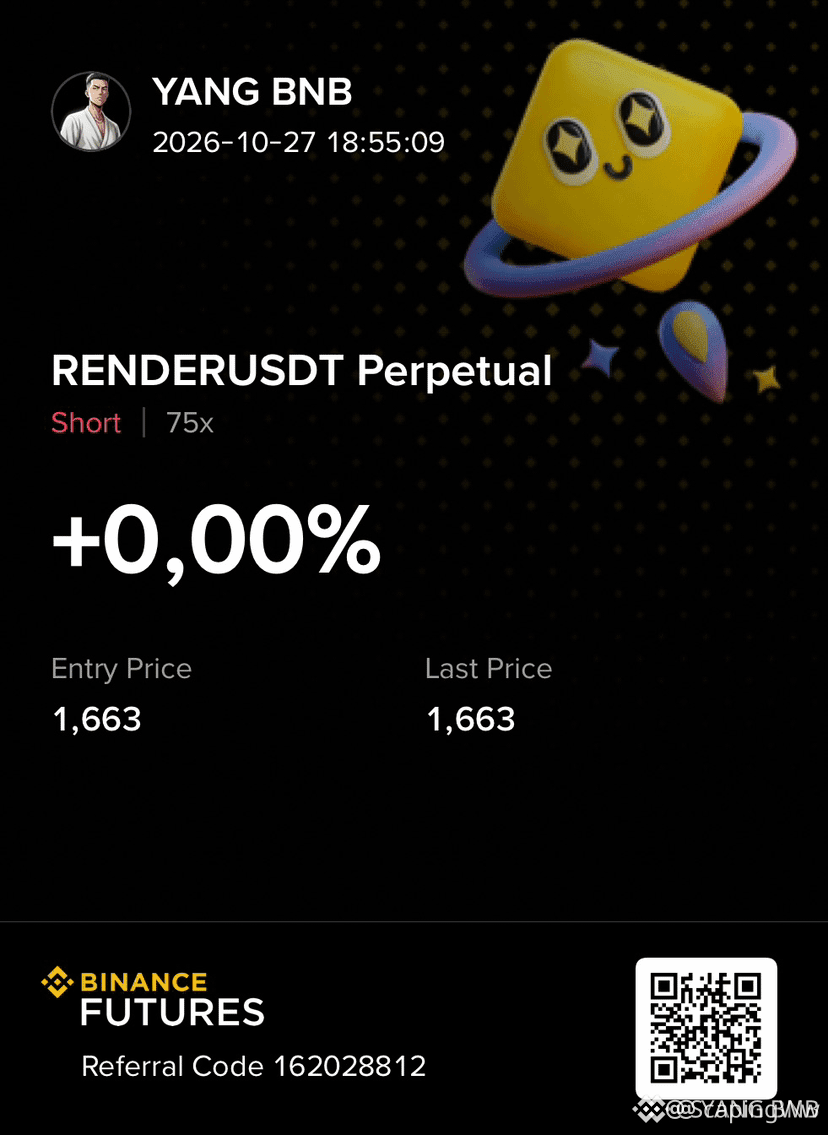
🚨 $RENDER ON THE EDGE OF A MAJOR SHORT SQUEEZE! 📉
Entry: 1.661‑1.770 ⚡
Target: 1.500 🚀
Stop Loss: 1.942 ⚠️
📊 The chart is screaming bearish as the last high got snubbed, and sellers are now stacking pressure on every pull‑back. ⚡ Momentum stalls, and the order flow shows a clear liquidity sweep—smart money is flushing out the last longs. 🦈 With each dip, buying dries up, setting the stage for a rapid descent toward the next demand zone.
💬 Are you positioning for the downside or waiting for the next liquidity dump? 👇
⚠️ Not financial advice. Always manage your risk. 🛡️
🏷️ #RENDER #ShortSetup #BearishMomentum #Crypto
🐻 🔥
🚨 $RENDER ON THE EDGE OF A MAJOR SHORT SQUEEZE! 📉
Entry: 1.661‑1.770 ⚡
Target: 1.500 🚀
Stop Loss: 1.942 ⚠️
📊 The chart is screaming bearish as the last high got snubbed, and sellers are now stacking pressure on every pull‑back. ⚡ Momentum stalls, and the order flow shows a clear liquidity sweep—smart money is flushing out the last longs. 🦈 With each dip, buying dries up, setting the stage for a rapid descent toward the next demand zone.
💬 Are you positioning for the downside or waiting for the next liquidity dump? 👇
⚠️ Not financial advice. Always manage your risk. 🛡️
🏷️ #RENDER #ShortSetup #BearishMomentum #Crypto
🐻 🔥
Entry: 1.661‑1.770 ⚡
Target: 1.500 🚀
Stop Loss: 1.942 ⚠️
📊 The chart is screaming bearish as the last high got snubbed, and sellers are now stacking pressure on every pull‑back. ⚡ Momentum stalls, and the order flow shows a clear liquidity sweep—smart money is flushing out the last longs. 🦈 With each dip, buying dries up, setting the stage for a rapid descent toward the next demand zone.
💬 Are you positioning for the downside or waiting for the next liquidity dump? 👇
⚠️ Not financial advice. Always manage your risk. 🛡️
🏷️ #RENDER #ShortSetup #BearishMomentum #Crypto
🐻 🔥
60

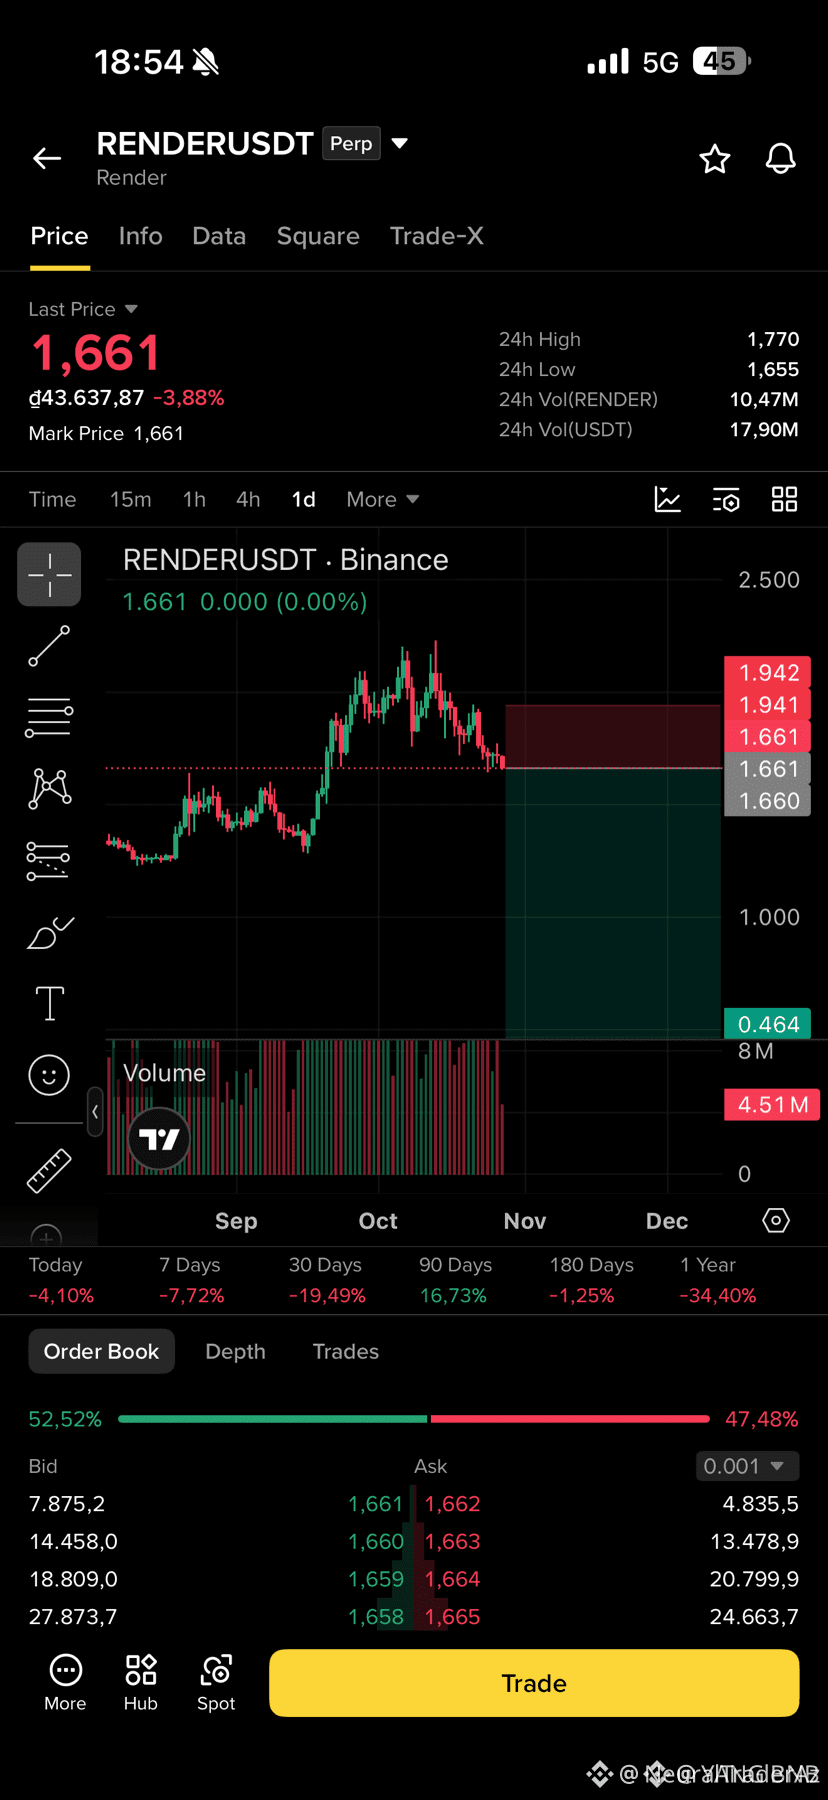
🔴 $RENDER BEARS INTO DEEP LIQUIDITY SWEEP! 💥
Entry: 1.661-1.770 ⚡
Target: 1.500 / 1.200 / 0.800 🚀
Stop Loss: 1.942 ⚠️
📉 The recent high rejection carved a clean bearish order block, and sellers are now sweeping the liquidity pool beneath the 1.8 zone. 📊 Volume on the 4H chart is contracting, confirming that buying pressure is fading fast. 🌊 Each dip is being absorbed, setting the stage for a multi‑target descent toward the 1.5‑1.2 corridor. 💡 The risk‑to‑reward profile remains compelling for disciplined shorts.
💬 Are you aligning your short orders with this liquidity hunt? 👇
⚠️ Not financial advice. Always manage your risk. 🛡️
🏷️ #RENDER #ShortSetup #Bearish #Crypto
🔥 🦈
🔴 $RENDER BEARS INTO DEEP LIQUIDITY SWEEP! 💥
Entry: 1.661-1.770 ⚡
Target: 1.500 / 1.200 / 0.800 🚀
Stop Loss: 1.942 ⚠️
📉 The recent high rejection carved a clean bearish order block, and sellers are now sweeping the liquidity pool beneath the 1.8 zone. 📊 Volume on the 4H chart is contracting, confirming that buying pressure is fading fast. 🌊 Each dip is being absorbed, setting the stage for a multi‑target descent toward the 1.5‑1.2 corridor. 💡 The risk‑to‑reward profile remains compelling for disciplined shorts.
💬 Are you aligning your short orders with this liquidity hunt? 👇
⚠️ Not financial advice. Always manage your risk. 🛡️
🏷️ #RENDER #ShortSetup #Bearish #Crypto
🔥 🦈
Entry: 1.661-1.770 ⚡
Target: 1.500 / 1.200 / 0.800 🚀
Stop Loss: 1.942 ⚠️
📉 The recent high rejection carved a clean bearish order block, and sellers are now sweeping the liquidity pool beneath the 1.8 zone. 📊 Volume on the 4H chart is contracting, confirming that buying pressure is fading fast. 🌊 Each dip is being absorbed, setting the stage for a multi‑target descent toward the 1.5‑1.2 corridor. 💡 The risk‑to‑reward profile remains compelling for disciplined shorts.
💬 Are you aligning your short orders with this liquidity hunt? 👇
⚠️ Not financial advice. Always manage your risk. 🛡️
🏷️ #RENDER #ShortSetup #Bearish #Crypto
🔥 🦈
18


·
--
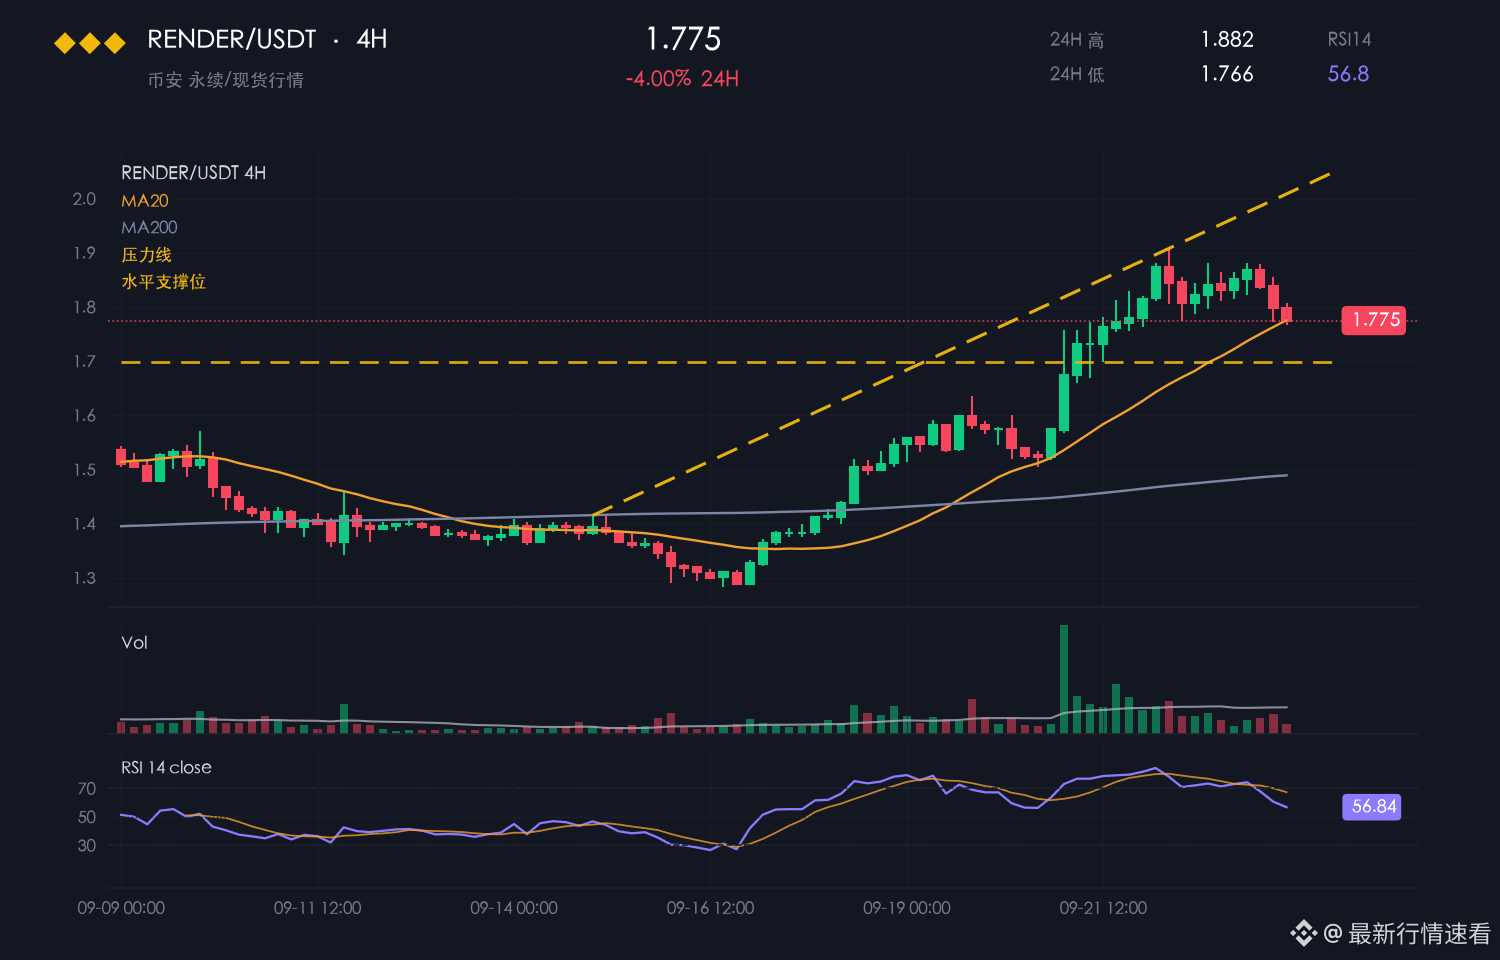
RENDER is currently trading at 1.690, up 0.24% over 24 hours, while still down 6.94% over 7 days. The intraday range is 1.668–1.736, with an amplitude of 4.1%.
【Market】
The ledger has just three figures: 0.24% for the day, 6.94% for the week, and an amplitude of 4.1%.
1.736 and 1.668 each hold one end: one is the threshold for regaining the initiative, the other a line of defense.
RENDER’s latest move hasn’t been particularly rapid, with the center of gravity gradually rising above 1.668.
After moving away from 1.668, the price has held its ground, keeping the overall pullback within manageable bounds.
The broader market is down 0.80% over the same period, so RENDER’s 0.24% gain is a slight outperformance, but not enough to call it strong for now.
【Macro】 U.S. stocks fell overnight, with the Nasdaq down 1.88% and the S&P 500 down 1.11% (close on 2026-10-14). BTC ETFs have seen net outflows of about $45.2 billion this month. U.S. CPI came in above expectations at 3.7% year over year, and the probability of a rate hike at the 2026-10-27/28 meeting is about 47%.
The short-term outlook leans bullish.
【Bullish Reasons】
Trading isn’t about who moves fastest, but who can hold their position the longest.
With the daily gain of 0.24% on the board, short-term bulls have the upper hand.
Let’s see tomorrow whether that 0.24% figure still holds.
The short-term rally is moving quickly, so the risk of a sharp wick should not be ignored. It’s safer to wait for a pullback confirmation before taking action.
$RENDER #RENDER
RENDER is currently trading at 1.690, up 0.24% over 24 hours, while still down 6.94% over 7 days. The intraday range is 1.668–1.736, with an amplitude of 4.1%.
【Market】
The ledger has just three figures: 0.24% for the day, 6.94% for the week, and an amplitude of 4.1%.
1.736 and 1.668 each hold one end: one is the threshold for regaining the initiative, the other a line of defense.
RENDER’s latest move hasn’t been particularly rapid, with the center of gravity gradually rising above 1.668.
After moving away from 1.668, the price has held its ground, keeping the overall pullback within manageable bounds.
The broader market is down 0.80% over the same period, so RENDER’s 0.24% gain is a slight outperformance, but not enough to call it strong for now.
【Macro】 U.S. stocks fell overnight, with the Nasdaq down 1.88% and the S&P 500 down 1.11% (close on 2026-10-14). BTC ETFs have seen net outflows of about $45.2 billion this month. U.S. CPI came in above expectations at 3.7% year over year, and the probability of a rate hike at the 2026-10-27/28 meeting is about 47%.
The short-term outlook leans bullish.
【Bullish Reasons】
Trading isn’t about who moves fastest, but who can hold their position the longest.
With the daily gain of 0.24% on the board, short-term bulls have the upper hand.
Let’s see tomorrow whether that 0.24% figure still holds.
The short-term rally is moving quickly, so the risk of a sharp wick should not be ignored. It’s safer to wait for a pullback confirmation before taking action.
$RENDER #RENDER
【Market】
The ledger has just three figures: 0.24% for the day, 6.94% for the week, and an amplitude of 4.1%.
1.736 and 1.668 each hold one end: one is the threshold for regaining the initiative, the other a line of defense.
RENDER’s latest move hasn’t been particularly rapid, with the center of gravity gradually rising above 1.668.
After moving away from 1.668, the price has held its ground, keeping the overall pullback within manageable bounds.
The broader market is down 0.80% over the same period, so RENDER’s 0.24% gain is a slight outperformance, but not enough to call it strong for now.
【Macro】 U.S. stocks fell overnight, with the Nasdaq down 1.88% and the S&P 500 down 1.11% (close on 2026-10-14). BTC ETFs have seen net outflows of about $45.2 billion this month. U.S. CPI came in above expectations at 3.7% year over year, and the probability of a rate hike at the 2026-10-27/28 meeting is about 47%.
The short-term outlook leans bullish.
【Bullish Reasons】
Trading isn’t about who moves fastest, but who can hold their position the longest.
With the daily gain of 0.24% on the board, short-term bulls have the upper hand.
Let’s see tomorrow whether that 0.24% figure still holds.
The short-term rally is moving quickly, so the risk of a sharp wick should not be ignored. It’s safer to wait for a pullback confirmation before taking action.
$RENDER #RENDER
63
·
--
$RENDER is down 2 percent. Ask yourself who is selling it to you at this price
Chasing today greenest token feels safe until you realize you are just exit liquidity
Look at $RENDER sitting at 1.6700 down 2.3 percent on the day
The 24 hour range spans from 1.6560 to 1.7710 and right now price is buried at the bottom 12 percent of that range
Volume is dead at half of normal and the 1 hour RSI sits weak at 37
When you buy a fading coin near its low you are buying from someone who bought higher and wants out before the break
That is why chasing top gainers traps you every single time
Never buy a token just because it moved yesterday wait for the chart to prove strength
What is your go to rule for avoiding bad entries
#RENDER #TradingTips
$RENDER is down 2 percent. Ask yourself who is selling it to you at this price
Chasing today greenest token feels safe until you realize you are just exit liquidity
Look at $RENDER sitting at 1.6700 down 2.3 percent on the day
The 24 hour range spans from 1.6560 to 1.7710 and right now price is buried at the bottom 12 percent of that range
Volume is dead at half of normal and the 1 hour RSI sits weak at 37
When you buy a fading coin near its low you are buying from someone who bought higher and wants out before the break
That is why chasing top gainers traps you every single time
Never buy a token just because it moved yesterday wait for the chart to prove strength
What is your go to rule for avoiding bad entries
#RENDER #TradingTips
Chasing today greenest token feels safe until you realize you are just exit liquidity
Look at $RENDER sitting at 1.6700 down 2.3 percent on the day
The 24 hour range spans from 1.6560 to 1.7710 and right now price is buried at the bottom 12 percent of that range
Volume is dead at half of normal and the 1 hour RSI sits weak at 37
When you buy a fading coin near its low you are buying from someone who bought higher and wants out before the break
That is why chasing top gainers traps you every single time
Never buy a token just because it moved yesterday wait for the chart to prove strength
What is your go to rule for avoiding bad entries
#RENDER #TradingTips
9

·
--
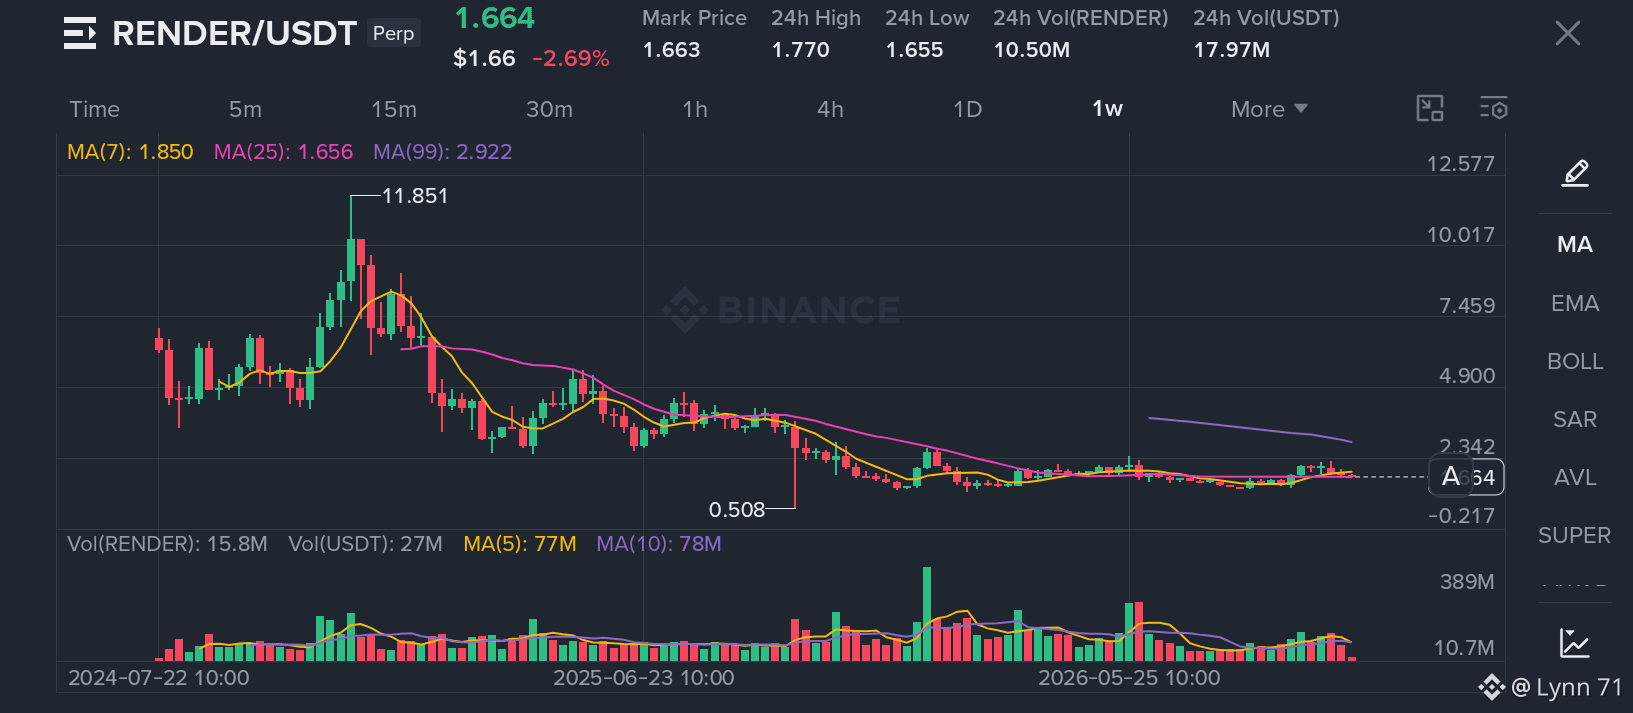
🚨 RENDER ($RENDER): THE QUIET ACCUMULATION BEFORE THE NEXT BIG MOVE? 👀🔥
📉 From a high of $11.85 to around $1.66… RENDER has taken a brutal hit. But is this long-term downtrend approaching a turning point?
🔍 What the weekly chart reveals:
🟢 Price is hovering near the MA(25) at $1.656 — a key level to watch.
⚠️ The MA(7) at $1.850 is overhead resistance.
🐻 The MA(99) at $2.922 shows the bigger trend remains under pressure.
📊 Recent price action suggests consolidation, but a confirmed breakout has NOT happened yet.
💡 My take: RENDER could be setting up for a major move, but the direction still needs confirmation. Watch volume, weekly candle closes, and whether buyers can reclaim resistance.
Are we witnessing the beginning of a RENDER comeback, or is another dip coming first? 👇
🚀 BULLISH 📈 or 🐻 BEARISH 📉?
#RENDER $RENDER
{spot}(RENDERUSDT)
🚨 RENDER ($RENDER ): THE QUIET ACCUMULATION BEFORE THE NEXT BIG MOVE? 👀🔥
📉 From a high of $11.85 to around $1.66… RENDER has taken a brutal hit. But is this long-term downtrend approaching a turning point?
🔍 What the weekly chart reveals:
🟢 Price is hovering near the MA(25) at $1.656 — a key level to watch.
⚠️ The MA(7) at $1.850 is overhead resistance.
🐻 The MA(99) at $2.922 shows the bigger trend remains under pressure.
📊 Recent price action suggests consolidation, but a confirmed breakout has NOT happened yet.
💡 My take: RENDER could be setting up for a major move, but the direction still needs confirmation. Watch volume, weekly candle closes, and whether buyers can reclaim resistance.
Are we witnessing the beginning of a RENDER comeback, or is another dip coming first? 👇
🚀 BULLISH 📈 or 🐻 BEARISH 📉?
#RENDER $RENDER
📉 From a high of $11.85 to around $1.66… RENDER has taken a brutal hit. But is this long-term downtrend approaching a turning point?
🔍 What the weekly chart reveals:
🟢 Price is hovering near the MA(25) at $1.656 — a key level to watch.
⚠️ The MA(7) at $1.850 is overhead resistance.
🐻 The MA(99) at $2.922 shows the bigger trend remains under pressure.
📊 Recent price action suggests consolidation, but a confirmed breakout has NOT happened yet.
💡 My take: RENDER could be setting up for a major move, but the direction still needs confirmation. Watch volume, weekly candle closes, and whether buyers can reclaim resistance.
Are we witnessing the beginning of a RENDER comeback, or is another dip coming first? 👇
🚀 BULLISH 📈 or 🐻 BEARISH 📉?
#RENDER $RENDER
1
129

·
--
🟢 Buy the dip $RENDER | RENDER/USDT
Signals: 15m·RSI oversold rebound, 4h·bottom fractal, 4h·520 golden cross, 1d·MACD histogram turning stronger
Filled: 8.91 @ 1.682 (≈15 U)
Account max LTV 81.8%|Spot dip-buying, collateral only increases and never decreases
#RENDER #quantitative trading
Automated copy-trading record, not investment advice.
🟢 Buy the dip $RENDER | RENDER/USDT
Signals: 15m·RSI oversold rebound, 4h·bottom fractal, 4h·520 golden cross, 1d·MACD histogram turning stronger
Filled: 8.91 @ 1.682 (≈15 U)
Account max LTV 81.8%|Spot dip-buying, collateral only increases and never decreases
#RENDER #quantitative trading
Automated copy-trading record, not investment advice.
Signals: 15m·RSI oversold rebound, 4h·bottom fractal, 4h·520 golden cross, 1d·MACD histogram turning stronger
Filled: 8.91 @ 1.682 (≈15 U)
Account max LTV 81.8%|Spot dip-buying, collateral only increases and never decreases
#RENDER #quantitative trading
Automated copy-trading record, not investment advice.

·
--
🚨 $RENDER: MAKE-OR-BREAK PRICE ZONE — BREAKOUT OR FAKEOUT? 💥
The market is holding its breath as $RENDER this token approaches the extremely important psychological resistance level at $1.69. Buyers and sellers are fiercely battling over every price level, while a surge in trading volume suggests a major move may be imminent. If demand continues to dominate and decisively breaks through this resistance, the path will open toward higher targets. On the other hand, a rejection here could send the price back down to retest the strong support zone below.
I’m preparing orders for either a breakout or a liquidity sweep. What’s the most noteworthy thing about $RENDER this week? Share your thoughts!
#BinanceSquare #RENDER #Crypto
(Just my personal opinion, not investment advice — DYOR)
🚨 $RENDER : MAKE-OR-BREAK PRICE ZONE — BREAKOUT OR FAKEOUT? 💥
The market is holding its breath as $RENDER this token approaches the extremely important psychological resistance level at $1.69. Buyers and sellers are fiercely battling over every price level, while a surge in trading volume suggests a major move may be imminent. If demand continues to dominate and decisively breaks through this resistance, the path will open toward higher targets. On the other hand, a rejection here could send the price back down to retest the strong support zone below.
I’m preparing orders for either a breakout or a liquidity sweep. What’s the most noteworthy thing about $RENDER this week? Share your thoughts!
#BinanceSquare #RENDER #Crypto
(Just my personal opinion, not investment advice — DYOR)
The market is holding its breath as $RENDER this token approaches the extremely important psychological resistance level at $1.69. Buyers and sellers are fiercely battling over every price level, while a surge in trading volume suggests a major move may be imminent. If demand continues to dominate and decisively breaks through this resistance, the path will open toward higher targets. On the other hand, a rejection here could send the price back down to retest the strong support zone below.
I’m preparing orders for either a breakout or a liquidity sweep. What’s the most noteworthy thing about $RENDER this week? Share your thoughts!
#BinanceSquare #RENDER #Crypto
(Just my personal opinion, not investment advice — DYOR)
235
Log in to explore more content
Join global crypto users on Binance Square
⚡️ Get latest and useful information about crypto.
💬 Trusted by the world’s largest crypto exchange.
👍 Discover real insights from verified creators.
Email / Phone number
Trending Topics
1
#EarningsSeason
6.6M views
33,204 Discussing
2
#USMidtermElections
89,341 views
1,163 Discussing
3
#StrategySTRCReaches$99.95ForFirstTimeIn165Days
1,036 views
36 Discussing
4
#BinanceWillListPredictPREDICT
14,603 views
407 Discussing
5
#SwitzerlandFirstSpotBitcoinETFExpectedToTradeInNovember
918 views
50 Discussing
6
#StrategyReports$21BQ3OperatingProfit
860 views
37 Discussing
7
#Strategy三季度营业利润210亿美元
14,254 views
52 Discussing
8
#TwoAddressesHoldingAbout1.28BUSDTFrozen
5,407 views
211 Discussing
9
#FirstDigitalBlacklistsAttackerAddressHoldingAbout3.4MFDUSD
274 views
13 Discussing
10
#BitcoinDropsBelow$80K
62,963 views
162 Discussing