
#88
88
5,532 views
57 Discussing
Hot
Latest

·
--
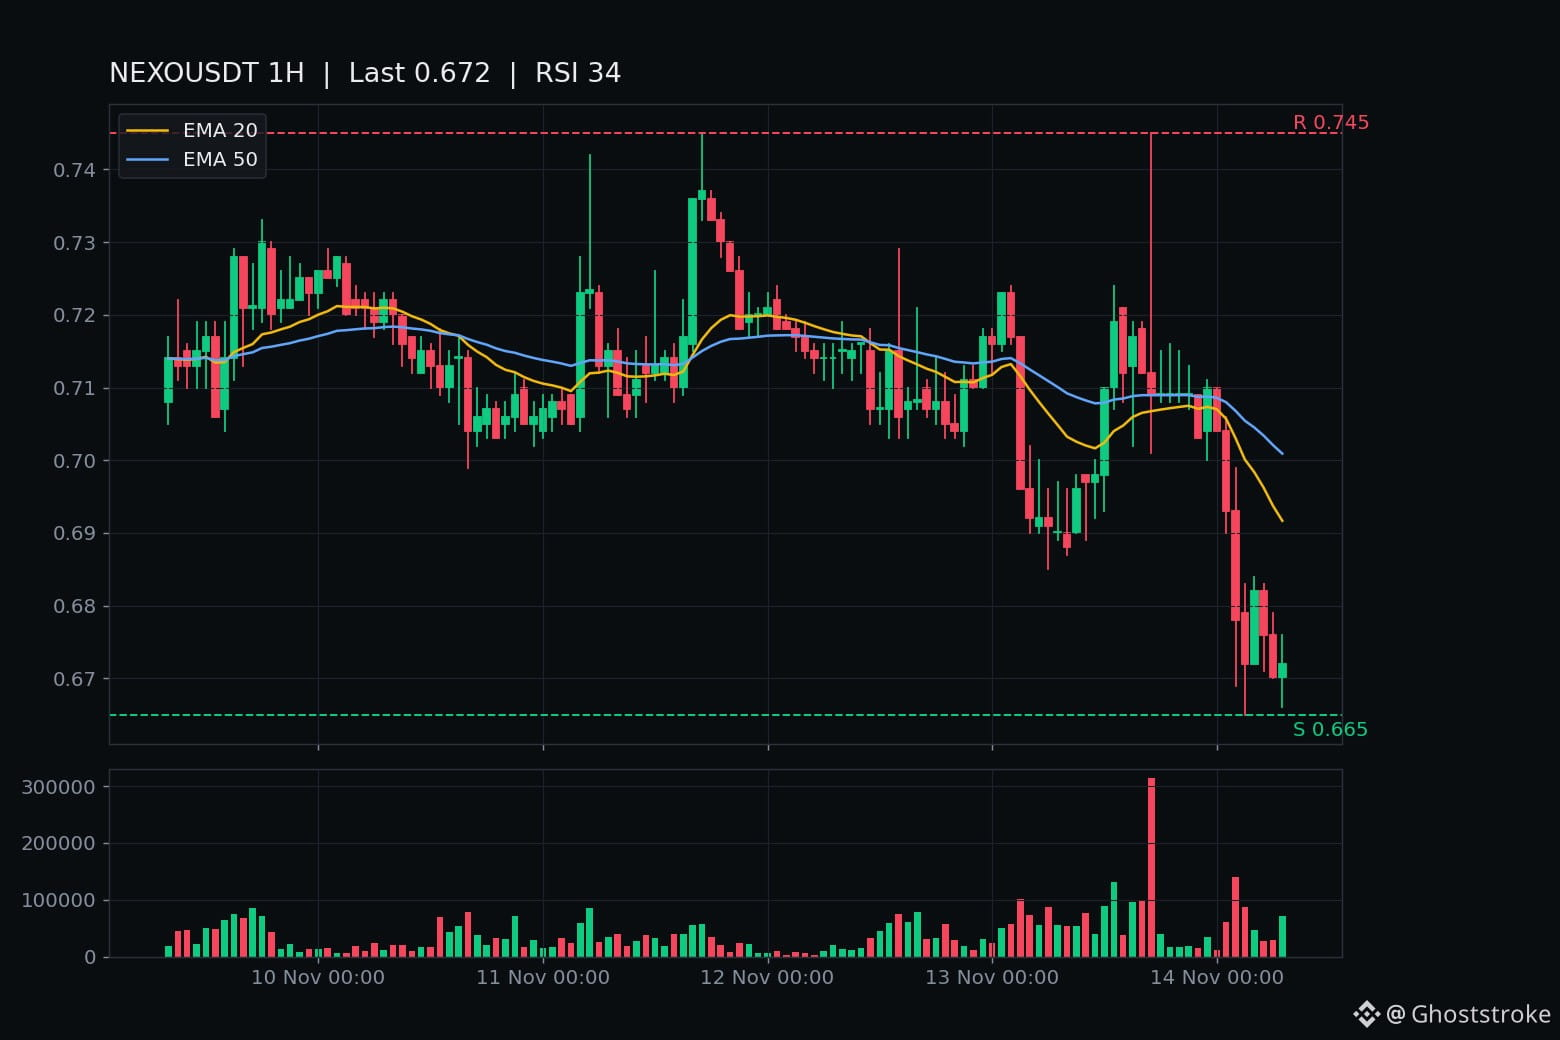
$NEXO is $0.67 tonight — six straight closed hours under $0.685, and the low broke to $0.647.
The $0.685 line has been the story all week. It was the watcher floor set Nov 13, and NEXO spent Nov 14 living under it — 02:00 UTC closed $0.678, 03:00 $0.672, then a whole day grinding $0.67–$0.685. Nov 13 even tagged $0.745 and still couldn't close above $0.724. The reclaim finally came at 18:00: tagged $0.700, closed $0.696, held $0.693 the next hour. Two closes above the line.
Then 20:00 UTC closed $0.672 — straight back under — and it never came back: 21:00 $0.663, 22:00 $0.650 on $151k, the heaviest NEXO hour of the day, 23:00 $0.659, 00:00 $0.655, 01:00 $0.652. Six closes under, fresh low $0.647 on the last one.
The forming 02:00 hour is bouncing off it — opened $0.652, tagged $0.671, live ~$0.67. Unclosed. Its 03:00 UTC close (08:30 IST) is the verdict: hold above $0.647 and the low stands; close back above $0.685 and the break fails on its first test.
Scale: rank #88, $668M, -3.3% today, -11.1% this week, -21.3% this month, -84% off the $4.07 ATH. Fully circulating, 1B of 1B — no unlock overhang to blame. No fresh NEXO headline either — this is tape, not news. The board is bleeding with it: Bitcoin $64,879, -3.7%.
The chart agrees with the tape: RSI 36, under EMA20 $0.672 and EMA50 $0.686, both overhead now. The other side, honestly: RSI 36 is where flushes bounce hardest, and the forming hour is already $0.02 off the low. One hourly close back above $0.685 unwrites the whole leg.
Levels: $0.685 the line, $0.700 the rejected tag, $0.715 chart resistance above. Below: $0.647 the low — a closed hour under it breaks fresh ground — then $0.60.
This is a watch, not a call. Does the 03:00 UTC close hold the $0.647 low, or does $0.685 take the leg back?
$NEXO is $0.67 tonight — six straight closed hours under $0.685, and the low broke to $0.647.
The $0.685 line has been the story all week. It was the watcher floor set Nov 13, and NEXO spent Nov 14 living under it — 02:00 UTC closed $0.678, 03:00 $0.672, then a whole day grinding $0.67–$0.685. Nov 13 even tagged $0.745 and still couldn't close above $0.724. The reclaim finally came at 18:00: tagged $0.700, closed $0.696, held $0.693 the next hour. Two closes above the line.
Then 20:00 UTC closed $0.672 — straight back under — and it never came back: 21:00 $0.663, 22:00 $0.650 on $151k, the heaviest NEXO hour of the day, 23:00 $0.659, 00:00 $0.655, 01:00 $0.652. Six closes under, fresh low $0.647 on the last one.
The forming 02:00 hour is bouncing off it — opened $0.652, tagged $0.671, live ~$0.67. Unclosed. Its 03:00 UTC close (08:30 IST) is the verdict: hold above $0.647 and the low stands; close back above $0.685 and the break fails on its first test.
Scale: rank #88, $668M, -3.3% today, -11.1% this week, -21.3% this month, -84% off the $4.07 ATH. Fully circulating, 1B of 1B — no unlock overhang to blame. No fresh NEXO headline either — this is tape, not news. The board is bleeding with it: Bitcoin $64,879, -3.7%.
The chart agrees with the tape: RSI 36, under EMA20 $0.672 and EMA50 $0.686, both overhead now. The other side, honestly: RSI 36 is where flushes bounce hardest, and the forming hour is already $0.02 off the low. One hourly close back above $0.685 unwrites the whole leg.
Levels: $0.685 the line, $0.700 the rejected tag, $0.715 chart resistance above. Below: $0.647 the low — a closed hour under it breaks fresh ground — then $0.60.
This is a watch, not a call. Does the 03:00 UTC close hold the $0.647 low, or does $0.685 take the leg back?
The $0.685 line has been the story all week. It was the watcher floor set Nov 13, and NEXO spent Nov 14 living under it — 02:00 UTC closed $0.678, 03:00 $0.672, then a whole day grinding $0.67–$0.685. Nov 13 even tagged $0.745 and still couldn't close above $0.724. The reclaim finally came at 18:00: tagged $0.700, closed $0.696, held $0.693 the next hour. Two closes above the line.
Then 20:00 UTC closed $0.672 — straight back under — and it never came back: 21:00 $0.663, 22:00 $0.650 on $151k, the heaviest NEXO hour of the day, 23:00 $0.659, 00:00 $0.655, 01:00 $0.652. Six closes under, fresh low $0.647 on the last one.
The forming 02:00 hour is bouncing off it — opened $0.652, tagged $0.671, live ~$0.67. Unclosed. Its 03:00 UTC close (08:30 IST) is the verdict: hold above $0.647 and the low stands; close back above $0.685 and the break fails on its first test.
Scale: rank #88, $668M, -3.3% today, -11.1% this week, -21.3% this month, -84% off the $4.07 ATH. Fully circulating, 1B of 1B — no unlock overhang to blame. No fresh NEXO headline either — this is tape, not news. The board is bleeding with it: Bitcoin $64,879, -3.7%.
The chart agrees with the tape: RSI 36, under EMA20 $0.672 and EMA50 $0.686, both overhead now. The other side, honestly: RSI 36 is where flushes bounce hardest, and the forming hour is already $0.02 off the low. One hourly close back above $0.685 unwrites the whole leg.
Levels: $0.685 the line, $0.700 the rejected tag, $0.715 chart resistance above. Below: $0.647 the low — a closed hour under it breaks fresh ground — then $0.60.
This is a watch, not a call. Does the 03:00 UTC close hold the $0.647 low, or does $0.685 take the leg back?
30
·
--
NEXO lost the floor, then lost the round number under it.
This morning it lost the $0.705 floor: 01:00 closed $0.693 on the night's heaviest bar. Then 02:00 closed $0.678 on $95.9k - the heaviest NEXO bar of the night, the first closed hour under $0.685, fresh low $0.669. 03:00 closed $0.672, fresh low $0.665.
Then it never came back: 04:00 $0.682, 05:00 $0.676, 06:00 $0.670, 07:00 $0.672. Six straight closed hours under $0.685 - and five of the six under the $0.68 round number too.
The forming hour is still sitting under the line at $0.672. Its 09:00 UTC close, 14:30 IST, is the next verdict.
Live: $0.672, -2.8% on the day, $1.14M Binance volume, 8,970 trades. Chart: RSI 34, under the 20-hour average ($0.6917) and the 50-hour ($0.7009), resistance $0.745, support the $0.665 low. Rank #88, $670M market cap, 7d -8.4%, 30d -16.3%, fully circulating - no unlock to blame, -83.5% off the $4.07 high.
No fresh headline behind any of this - quote pages only. The newest real items are days old. Bitcoin is $67,125, -2.4% - the board is bleeding too, NEXO just slightly weaker. This is a line breaking on a weak board, not a solo crash.
The other side: RSI 34 is where bounces start, and this coin whipsawed these same lines all week - the last $0.705 reclaim died within hours. One closed hour back above $0.685 unwrites the leg. And after the first two bars, the break kept going on light volume - a grind down, not a blast.
The 09:00 UTC close decides DODO, BERA and BNB on the same bell.
This is a watch, not a call. Six closes under the floor - is $0.685 done, or does the 09:00 close buy it back?
NEXO lost the floor, then lost the round number under it.
This morning it lost the $0.705 floor: 01:00 closed $0.693 on the night's heaviest bar. Then 02:00 closed $0.678 on $95.9k - the heaviest NEXO bar of the night, the first closed hour under $0.685, fresh low $0.669. 03:00 closed $0.672, fresh low $0.665.
Then it never came back: 04:00 $0.682, 05:00 $0.676, 06:00 $0.670, 07:00 $0.672. Six straight closed hours under $0.685 - and five of the six under the $0.68 round number too.
The forming hour is still sitting under the line at $0.672. Its 09:00 UTC close, 14:30 IST, is the next verdict.
Live: $0.672, -2.8% on the day, $1.14M Binance volume, 8,970 trades. Chart: RSI 34, under the 20-hour average ($0.6917) and the 50-hour ($0.7009), resistance $0.745, support the $0.665 low. Rank #88, $670M market cap, 7d -8.4%, 30d -16.3%, fully circulating - no unlock to blame, -83.5% off the $4.07 high.
No fresh headline behind any of this - quote pages only. The newest real items are days old. Bitcoin is $67,125, -2.4% - the board is bleeding too, NEXO just slightly weaker. This is a line breaking on a weak board, not a solo crash.
The other side: RSI 34 is where bounces start, and this coin whipsawed these same lines all week - the last $0.705 reclaim died within hours. One closed hour back above $0.685 unwrites the leg. And after the first two bars, the break kept going on light volume - a grind down, not a blast.
The 09:00 UTC close decides DODO, BERA and BNB on the same bell.
This is a watch, not a call. Six closes under the floor - is $0.685 done, or does the 09:00 close buy it back?
This morning it lost the $0.705 floor: 01:00 closed $0.693 on the night's heaviest bar. Then 02:00 closed $0.678 on $95.9k - the heaviest NEXO bar of the night, the first closed hour under $0.685, fresh low $0.669. 03:00 closed $0.672, fresh low $0.665.
Then it never came back: 04:00 $0.682, 05:00 $0.676, 06:00 $0.670, 07:00 $0.672. Six straight closed hours under $0.685 - and five of the six under the $0.68 round number too.
The forming hour is still sitting under the line at $0.672. Its 09:00 UTC close, 14:30 IST, is the next verdict.
Live: $0.672, -2.8% on the day, $1.14M Binance volume, 8,970 trades. Chart: RSI 34, under the 20-hour average ($0.6917) and the 50-hour ($0.7009), resistance $0.745, support the $0.665 low. Rank #88, $670M market cap, 7d -8.4%, 30d -16.3%, fully circulating - no unlock to blame, -83.5% off the $4.07 high.
No fresh headline behind any of this - quote pages only. The newest real items are days old. Bitcoin is $67,125, -2.4% - the board is bleeding too, NEXO just slightly weaker. This is a line breaking on a weak board, not a solo crash.
The other side: RSI 34 is where bounces start, and this coin whipsawed these same lines all week - the last $0.705 reclaim died within hours. One closed hour back above $0.685 unwrites the leg. And after the first two bars, the break kept going on light volume - a grind down, not a blast.
The 09:00 UTC close decides DODO, BERA and BNB on the same bell.
This is a watch, not a call. Six closes under the floor - is $0.685 done, or does the 09:00 close buy it back?
53

·
--
Meow Bro took a look around the trending charts, and only a handful of coins are rising against the trend tonight. PEARL is one of them 🐱
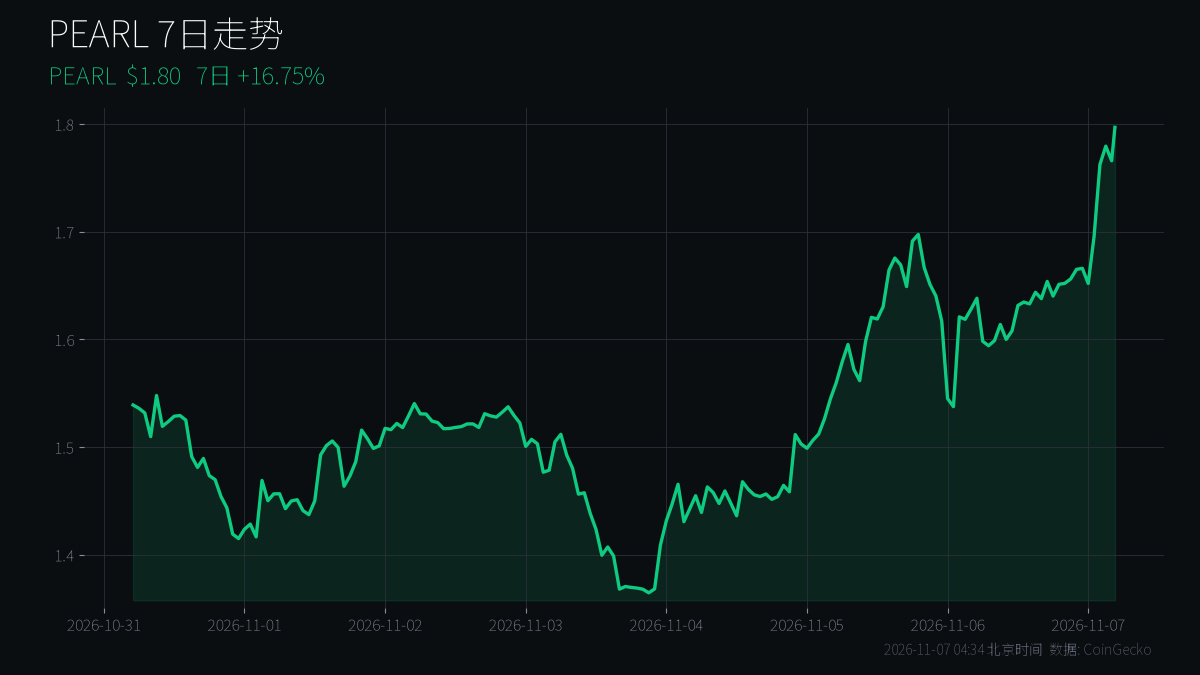
📈 Data: PEARL is currently around $1.80, up about 8.8% over 24h and 16.75% over 7 days, with a market cap ranking around #88.
📊 Price action: After bottoming around 1.37 on 11/4, it climbed steadily. It retested 1.54 on 11/6 without breaking below, then surged to a new high overnight.
😨 Broader market: BTC is around $75,700, and the Fear & Greed Index is 28 (Fear). Coins that hit new highs in a weak market either have buyers stepping in—or could just as easily get slammed back down.
👉 Levels Meow Bro is watching: Can it hold above 1.85? 1.65 is short-term support below; falling back under that would suggest momentum-chasing money is pulling out.
⚠️ Avoid the trap: Don’t chase coins rising against the trend during the acceleration phase. Scale in, set a stop-loss, and don’t take on too large a position.
Do you think PEARL’s rally is backed by sustained buying, or is it just a brief move while the broader market is weak? Let’s chat in the comments 👇
$PEARL $BTC
#链上数据 #热搜币 #altcoins
Personal opinion only; not investment advice
Meow Bro took a look around the trending charts, and only a handful of coins are rising against the trend tonight. PEARL is one of them 🐱
📈 Data: PEARL is currently around $1.80, up about 8.8% over 24h and 16.75% over 7 days, with a market cap ranking around #88.
📊 Price action: After bottoming around 1.37 on 11/4, it climbed steadily. It retested 1.54 on 11/6 without breaking below, then surged to a new high overnight.
😨 Broader market: BTC is around $75,700, and the Fear & Greed Index is 28 (Fear). Coins that hit new highs in a weak market either have buyers stepping in—or could just as easily get slammed back down.
👉 Levels Meow Bro is watching: Can it hold above 1.85? 1.65 is short-term support below; falling back under that would suggest momentum-chasing money is pulling out.
⚠️ Avoid the trap: Don’t chase coins rising against the trend during the acceleration phase. Scale in, set a stop-loss, and don’t take on too large a position.
Do you think PEARL’s rally is backed by sustained buying, or is it just a brief move while the broader market is weak? Let’s chat in the comments 👇
$PEARL $BTC
#链上数据 #热搜币 #altcoins
Personal opinion only; not investment advice
📈 Data: PEARL is currently around $1.80, up about 8.8% over 24h and 16.75% over 7 days, with a market cap ranking around #88.
📊 Price action: After bottoming around 1.37 on 11/4, it climbed steadily. It retested 1.54 on 11/6 without breaking below, then surged to a new high overnight.
😨 Broader market: BTC is around $75,700, and the Fear & Greed Index is 28 (Fear). Coins that hit new highs in a weak market either have buyers stepping in—or could just as easily get slammed back down.
👉 Levels Meow Bro is watching: Can it hold above 1.85? 1.65 is short-term support below; falling back under that would suggest momentum-chasing money is pulling out.
⚠️ Avoid the trap: Don’t chase coins rising against the trend during the acceleration phase. Scale in, set a stop-loss, and don’t take on too large a position.
Do you think PEARL’s rally is backed by sustained buying, or is it just a brief move while the broader market is weak? Let’s chat in the comments 👇
$PEARL $BTC
#链上数据 #热搜币 #altcoins
Personal opinion only; not investment advice
1
8
·
--
$ZRO broke the $1.52 line — then unwound the entire flush in 10 hours.
Yesterday I posted the flush chapter: $2.06 → $1.52 in 9 days, and I named the line. $1.52. A closed hour below it = deeper air.
The very next candle fired it. 00:00 UTC: O $1.523 → L $1.417 → C $1.485 on $3.14M — the day's biggest hourly bar. 01:00 UTC closed $1.460, lower still. The line didn't just break, it got swept 7% lower.
Then the unwind. 03:00 UTC closed $1.563 back above the line. 04:00 UTC recovery bar C $1.650 on $759k. 05:00 UTC C $1.677 — first close above the $1.674 dead-cat high (flush losing steam). 10:00 UTC C $1.728 — first close above the $1.708 flush-bar open (flush unwound). 15:00 UTC tagged $1.78 on $1.16M.
Now the honest part: the evening tape is chopping around $1.708. Closes since 18:00 UTC: $1.678, $1.712, $1.694, $1.701 — above, below, above, below. The unwind fired on real volume at 10:00 UTC, but the line is being negotiated, not held. $1.78 rejected twice (15:00 and 16:00 highs).
No fresh ZRO headline driving any of this — newest items are the Oct 20 Zero-mainnet/ATLAS Nov 30 announcement and stale price pieces. This is tape, not news: the Oct 29 Intel-guidance flush hour broke it, the market-wide recovery off the hack wash un-broke it. Rank #88, $683M mcap, -77% off the $7.47 ATH — a mid-cap wash that round-tripped, not a rescue story.
Levels:
$1.78 — extension high. An hourly close above = open air.
$1.708 — the line, again. A confirming second closed hour above = the unwind holding.
$1.656 — the 18:00 wick. A closed hour below = the give-back extending.
$1.417 — the line-break low. A closed hour below = deeper air is back.
Not a call, either way. The forming 22:00 UTC hour is printing ~$1.71 — live, unclosed, not a level.
Does the unwind hold $1.708 into the Asia open, or is this chop just the second leg reloading?
$ZRO broke the $1.52 line — then unwound the entire flush in 10 hours.
Yesterday I posted the flush chapter: $2.06 → $1.52 in 9 days, and I named the line. $1.52. A closed hour below it = deeper air.
The very next candle fired it. 00:00 UTC: O $1.523 → L $1.417 → C $1.485 on $3.14M — the day's biggest hourly bar. 01:00 UTC closed $1.460, lower still. The line didn't just break, it got swept 7% lower.
Then the unwind. 03:00 UTC closed $1.563 back above the line. 04:00 UTC recovery bar C $1.650 on $759k. 05:00 UTC C $1.677 — first close above the $1.674 dead-cat high (flush losing steam). 10:00 UTC C $1.728 — first close above the $1.708 flush-bar open (flush unwound). 15:00 UTC tagged $1.78 on $1.16M.
Now the honest part: the evening tape is chopping around $1.708. Closes since 18:00 UTC: $1.678, $1.712, $1.694, $1.701 — above, below, above, below. The unwind fired on real volume at 10:00 UTC, but the line is being negotiated, not held. $1.78 rejected twice (15:00 and 16:00 highs).
No fresh ZRO headline driving any of this — newest items are the Oct 20 Zero-mainnet/ATLAS Nov 30 announcement and stale price pieces. This is tape, not news: the Oct 29 Intel-guidance flush hour broke it, the market-wide recovery off the hack wash un-broke it. Rank #88, $683M mcap, -77% off the $7.47 ATH — a mid-cap wash that round-tripped, not a rescue story.
Levels:
$1.78 — extension high. An hourly close above = open air.
$1.708 — the line, again. A confirming second closed hour above = the unwind holding.
$1.656 — the 18:00 wick. A closed hour below = the give-back extending.
$1.417 — the line-break low. A closed hour below = deeper air is back.
Not a call, either way. The forming 22:00 UTC hour is printing ~$1.71 — live, unclosed, not a level.
Does the unwind hold $1.708 into the Asia open, or is this chop just the second leg reloading?
Yesterday I posted the flush chapter: $2.06 → $1.52 in 9 days, and I named the line. $1.52. A closed hour below it = deeper air.
The very next candle fired it. 00:00 UTC: O $1.523 → L $1.417 → C $1.485 on $3.14M — the day's biggest hourly bar. 01:00 UTC closed $1.460, lower still. The line didn't just break, it got swept 7% lower.
Then the unwind. 03:00 UTC closed $1.563 back above the line. 04:00 UTC recovery bar C $1.650 on $759k. 05:00 UTC C $1.677 — first close above the $1.674 dead-cat high (flush losing steam). 10:00 UTC C $1.728 — first close above the $1.708 flush-bar open (flush unwound). 15:00 UTC tagged $1.78 on $1.16M.
Now the honest part: the evening tape is chopping around $1.708. Closes since 18:00 UTC: $1.678, $1.712, $1.694, $1.701 — above, below, above, below. The unwind fired on real volume at 10:00 UTC, but the line is being negotiated, not held. $1.78 rejected twice (15:00 and 16:00 highs).
No fresh ZRO headline driving any of this — newest items are the Oct 20 Zero-mainnet/ATLAS Nov 30 announcement and stale price pieces. This is tape, not news: the Oct 29 Intel-guidance flush hour broke it, the market-wide recovery off the hack wash un-broke it. Rank #88, $683M mcap, -77% off the $7.47 ATH — a mid-cap wash that round-tripped, not a rescue story.
Levels:
$1.78 — extension high. An hourly close above = open air.
$1.708 — the line, again. A confirming second closed hour above = the unwind holding.
$1.656 — the 18:00 wick. A closed hour below = the give-back extending.
$1.417 — the line-break low. A closed hour below = deeper air is back.
Not a call, either way. The forming 22:00 UTC hour is printing ~$1.71 — live, unclosed, not a level.
Does the unwind hold $1.708 into the Asia open, or is this chop just the second leg reloading?
12

·
--
$PUMP has an interesting move here: up 2.34% in 15m, with volume at 1.7x and the closing price breaking straight above the highs of the last 20 5m candles. The taker buy/sell difference is +25.2%, and the buy/sell ratio is 1.67—clear signs that aggressive buyers are driving the move.
But OI is moving in the opposite direction: down 0.46% over 15m and 0.73% over 1h. Price is rising while open interest is falling, which looks more like short covering or existing positions closing than fresh longs stepping in to carry the rally. So don't rush to call this the start of a trend. First, see whether the price can hold above the breakout and whether volume can keep up. If OI doesn't recover, this move could easily turn out to be a brief spike.
24h trading volume is 237.5M, with enough depth, but the anomaly percentile is only 29.6%, ranking #88 across the entire pool. There's some activity, but it's not yet a market-wide move. Be cautious about chasing the price; wait for a pullback and confirmation.
$PUMP has an interesting move here: up 2.34% in 15m, with volume at 1.7x and the closing price breaking straight above the highs of the last 20 5m candles. The taker buy/sell difference is +25.2%, and the buy/sell ratio is 1.67—clear signs that aggressive buyers are driving the move.
But OI is moving in the opposite direction: down 0.46% over 15m and 0.73% over 1h. Price is rising while open interest is falling, which looks more like short covering or existing positions closing than fresh longs stepping in to carry the rally. So don't rush to call this the start of a trend. First, see whether the price can hold above the breakout and whether volume can keep up. If OI doesn't recover, this move could easily turn out to be a brief spike.
24h trading volume is 237.5M, with enough depth, but the anomaly percentile is only 29.6%, ranking #88 across the entire pool. There's some activity, but it's not yet a market-wide move. Be cautious about chasing the price; wait for a pullback and confirmation.
But OI is moving in the opposite direction: down 0.46% over 15m and 0.73% over 1h. Price is rising while open interest is falling, which looks more like short covering or existing positions closing than fresh longs stepping in to carry the rally. So don't rush to call this the start of a trend. First, see whether the price can hold above the breakout and whether volume can keep up. If OI doesn't recover, this move could easily turn out to be a brief spike.
24h trading volume is 237.5M, with enough depth, but the anomaly percentile is only 29.6%, ranking #88 across the entire pool. There's some activity, but it's not yet a market-wide move. Be cautious about chasing the price; wait for a pullback and confirmation.
2

·
--
We’re seeing strong momentum from the leading names on CoinGecko’s trending list. 1. Bitcoin (BTC) surged +3.2% and reinforced its #1 market‑cap rank. 2. NEAR Protocol (NEAR) climbed +4.8%, keeping it comfortably inside the top‑20. 3. Aerodrome Finance (AERO) jumped +6.1%, a notable rise for the #88 ranked asset. These moves suggest renewed buying pressure across both blue‑chip and emerging DeFi projects. 🚀
Our radar also highlights solid gains from the mid‑tier tokens. 4. Pearl (PEARL) posted +5.4% and nudged closer to the top‑100. 5. Axis Robotics (AXIS) rose +3.9%, showing steady interest in #511. 6. Universal High Income (UHI) climbed +2.7%, a modest but encouraging lift for the #701 rank. Together they reinforce the depth of opportunity beyond the headline names. 🌟
We’re confident that these trends signal a healthy rotation for our community. 7. Quantus (QTC) added +4.2% despite its #702 rank, proving that even lower‑ranked assets can capture upside. As we monitor the market, we encourage you to explore these tokens on Binance Square, diversify wisely, and stay tuned for the next wave of movers. 🔥
$ALT, $PROM, $BULLA
We’re seeing strong momentum from the leading names on CoinGecko’s trending list. 1. Bitcoin (BTC) surged +3.2% and reinforced its #1 market‑cap rank. 2. NEAR Protocol (NEAR) climbed +4.8%, keeping it comfortably inside the top‑20. 3. Aerodrome Finance (AERO) jumped +6.1%, a notable rise for the #88 ranked asset. These moves suggest renewed buying pressure across both blue‑chip and emerging DeFi projects. 🚀
Our radar also highlights solid gains from the mid‑tier tokens. 4. Pearl (PEARL) posted +5.4% and nudged closer to the top‑100. 5. Axis Robotics (AXIS) rose +3.9%, showing steady interest in #511. 6. Universal High Income (UHI) climbed +2.7%, a modest but encouraging lift for the #701 rank. Together they reinforce the depth of opportunity beyond the headline names. 🌟
We’re confident that these trends signal a healthy rotation for our community. 7. Quantus (QTC) added +4.2% despite its #702 rank, proving that even lower‑ranked assets can capture upside. As we monitor the market, we encourage you to explore these tokens on Binance Square, diversify wisely, and stay tuned for the next wave of movers. 🔥
$ALT , $PROM , $BULLA
Our radar also highlights solid gains from the mid‑tier tokens. 4. Pearl (PEARL) posted +5.4% and nudged closer to the top‑100. 5. Axis Robotics (AXIS) rose +3.9%, showing steady interest in #511. 6. Universal High Income (UHI) climbed +2.7%, a modest but encouraging lift for the #701 rank. Together they reinforce the depth of opportunity beyond the headline names. 🌟
We’re confident that these trends signal a healthy rotation for our community. 7. Quantus (QTC) added +4.2% despite its #702 rank, proving that even lower‑ranked assets can capture upside. As we monitor the market, we encourage you to explore these tokens on Binance Square, diversify wisely, and stay tuned for the next wave of movers. 🔥
$ALT , $PROM , $BULLA
105

·
--
$Q 's +56.56% shouldn't be read as just a breakout; it looks more like liquidity pushing the price to the doorstep of its ATH, followed by high-level turnover. The current price is $0.1735, just 1.56% below the $0.1762 ATH. Its $815M market cap ranks #88, with $110M in 24h volume. Turnover is substantial, but the market depth isn't enough to sustain an endless rally. Here's why price alone isn't enough to judge it: it's up 457% in 7d and 590% in 30d, climbing all the way from around $0.024, so short-term expectations are already sky-high. Those chasing the rally fear missing its final leg, while holders are waiting for a break above the ATH to trigger further acceleration. Both sentiments depend on the same thing—rising volume. If volume continues to follow through after a spike and the price holds above the $0.15 area on a pullback, the supply lock-up thesis could still hold. But if the price stalls while volume dries up first, profit-takers may move faster than any new narrative. Which variable do you think is most likely to overturn this view: fading volume, a market reversal, or unlocks and large-holder transfers?
$Q 's +56.56% shouldn't be read as just a breakout; it looks more like liquidity pushing the price to the doorstep of its ATH, followed by high-level turnover. The current price is $0.1735, just 1.56% below the $0.1762 ATH. Its $815M market cap ranks #88, with $110M in 24h volume. Turnover is substantial, but the market depth isn't enough to sustain an endless rally. Here's why price alone isn't enough to judge it: it's up 457% in 7d and 590% in 30d, climbing all the way from around $0.024, so short-term expectations are already sky-high. Those chasing the rally fear missing its final leg, while holders are waiting for a break above the ATH to trigger further acceleration. Both sentiments depend on the same thing—rising volume. If volume continues to follow through after a spike and the price holds above the $0.15 area on a pullback, the supply lock-up thesis could still hold. But if the price stalls while volume dries up first, profit-takers may move faster than any new narrative. Which variable do you think is most likely to overturn this view: fading volume, a market reversal, or unlocks and large-holder transfers?
1
·
--
$LIT is down 36% over the past 30 days—a glaring drop on the chart. But I think what’s truly concerning isn’t the number itself; it’s that trading volume is confirming the decline.
It peaked at $5.31 on September 24. On October 1, volume surged to a massive $253M, yet the price only changed hands around $3.95. When huge volume doesn’t push the price up, it usually means smart money is using the liquidity to reduce its position—especially for a project with a market cap of #88 . Over the following two weeks, there were two separate rallies on $175M-level volume, but neither managed to hold above $3.6. On October 13, the price broke below that range on declining volume, eventually dipping to $3.02.
Today, at $3.14, volume has shrunk to $45M. The market has shifted from selling pressure to a vacuum where hardly anyone is trading. Being 60% below ATH isn’t a discount coupon. There’s a pile of trapped buyers from the huge volumes in early October between $3.6 and $4.0, so every step upward faces selling pressure. The only reference point below is $3.07, a recent low that hasn’t had time to be tested.
My view: if $LIT continues to trade below $60M in volume over the next five days, then the price hovering around $3 isn’t forming a bottom—it’s stranded after liquidity has ebbed away. What variable is most likely to prove this conclusion wrong? I want to hear what would make you believe this decline in volume means coins are being absorbed, rather than that nobody wants them anymore.
$LIT is down 36% over the past 30 days—a glaring drop on the chart. But I think what’s truly concerning isn’t the number itself; it’s that trading volume is confirming the decline.
It peaked at $5.31 on September 24. On October 1, volume surged to a massive $253M, yet the price only changed hands around $3.95. When huge volume doesn’t push the price up, it usually means smart money is using the liquidity to reduce its position—especially for a project with a market cap of #88 . Over the following two weeks, there were two separate rallies on $175M-level volume, but neither managed to hold above $3.6. On October 13, the price broke below that range on declining volume, eventually dipping to $3.02.
Today, at $3.14, volume has shrunk to $45M. The market has shifted from selling pressure to a vacuum where hardly anyone is trading. Being 60% below ATH isn’t a discount coupon. There’s a pile of trapped buyers from the huge volumes in early October between $3.6 and $4.0, so every step upward faces selling pressure. The only reference point below is $3.07, a recent low that hasn’t had time to be tested.
My view: if $LIT continues to trade below $60M in volume over the next five days, then the price hovering around $3 isn’t forming a bottom—it’s stranded after liquidity has ebbed away. What variable is most likely to prove this conclusion wrong? I want to hear what would make you believe this decline in volume means coins are being absorbed, rather than that nobody wants them anymore.
It peaked at $5.31 on September 24. On October 1, volume surged to a massive $253M, yet the price only changed hands around $3.95. When huge volume doesn’t push the price up, it usually means smart money is using the liquidity to reduce its position—especially for a project with a market cap of #88 . Over the following two weeks, there were two separate rallies on $175M-level volume, but neither managed to hold above $3.6. On October 13, the price broke below that range on declining volume, eventually dipping to $3.02.
Today, at $3.14, volume has shrunk to $45M. The market has shifted from selling pressure to a vacuum where hardly anyone is trading. Being 60% below ATH isn’t a discount coupon. There’s a pile of trapped buyers from the huge volumes in early October between $3.6 and $4.0, so every step upward faces selling pressure. The only reference point below is $3.07, a recent low that hasn’t had time to be tested.
My view: if $LIT continues to trade below $60M in volume over the next five days, then the price hovering around $3 isn’t forming a bottom—it’s stranded after liquidity has ebbed away. What variable is most likely to prove this conclusion wrong? I want to hear what would make you believe this decline in volume means coins are being absorbed, rather than that nobody wants them anymore.
2

·
--
Contract Quant Report #88 | The divergence is still there, I'd rather wait for AXS to pull back, CLO is on watch for a second confirmation
The market is still leaning towards waiting for confirmation, not suitable for chasing. Today's signals are very much like 'there's a chance, but let's see who can hold their ground': AXS is close to the 20-day line, pulling back not too deep, but showing weakness on the 1-hour chart; CLO just had a bounce, but the 6-hour is still looking weak, so let's see if it can turn that bounce into stability.
Top Candidate 1: AXSUSDT
I prefer to look at this type of setup first, not in a rush to chase. The funding rate is slightly negative, the 1-hour and 6-hour charts are slightly retreating, but the open interest on the 1-hour has increased significantly, indicating that the game is still on, the issue is that it looks more like a position of 'waiting for direction' right now.
Observation Level: Around 1.16
Trigger Condition: If it pulls back without breaking below and then re-establishes above 1.18, we’ll look to see if 1.20 can continue to open up.
Invalidation Condition: If it drops back below 1.13, it indicates that this strong push towards the moving average has lost its strength.
Top Candidate 2: CLOUSDT
Its rhythm seems more like a quick lift before checking for support, the 1-hour shows a bounce, but the 6-hour hasn’t completely turned around yet, I won’t treat it as a blind high-chasing target.
Observation Level: Around 0.267
Trigger Condition: After stabilizing above 0.268, if it continues to probe upward to 0.275, then we can consider the bounce has continuation.
Invalidation Condition: If it drops back below 0.255, it shows that the sentiment is still leaning short.
Alternative Watch / Not Chasing: BICOUSDT
It has surged quite a bit, but it's too far from the moving average, making it prone to overheating and easy to give back gains, so I’ll set it aside for observation and won’t chase.
Risk Warning: Today is more suitable for waiting for pullbacks and confirmations, not for chasing blindly; once a confirmation comes out, the cost of missing out will significantly increase, but until there’s confirmation, it’s better to do less than to force a position.
Contract Quant Report #88 | The divergence is still there, I'd rather wait for AXS to pull back, CLO is on watch for a second confirmation
The market is still leaning towards waiting for confirmation, not suitable for chasing. Today's signals are very much like 'there's a chance, but let's see who can hold their ground': AXS is close to the 20-day line, pulling back not too deep, but showing weakness on the 1-hour chart; CLO just had a bounce, but the 6-hour is still looking weak, so let's see if it can turn that bounce into stability.
Top Candidate 1: AXSUSDT
I prefer to look at this type of setup first, not in a rush to chase. The funding rate is slightly negative, the 1-hour and 6-hour charts are slightly retreating, but the open interest on the 1-hour has increased significantly, indicating that the game is still on, the issue is that it looks more like a position of 'waiting for direction' right now.
Observation Level: Around 1.16
Trigger Condition: If it pulls back without breaking below and then re-establishes above 1.18, we’ll look to see if 1.20 can continue to open up.
Invalidation Condition: If it drops back below 1.13, it indicates that this strong push towards the moving average has lost its strength.
Top Candidate 2: CLOUSDT
Its rhythm seems more like a quick lift before checking for support, the 1-hour shows a bounce, but the 6-hour hasn’t completely turned around yet, I won’t treat it as a blind high-chasing target.
Observation Level: Around 0.267
Trigger Condition: After stabilizing above 0.268, if it continues to probe upward to 0.275, then we can consider the bounce has continuation.
Invalidation Condition: If it drops back below 0.255, it shows that the sentiment is still leaning short.
Alternative Watch / Not Chasing: BICOUSDT
It has surged quite a bit, but it's too far from the moving average, making it prone to overheating and easy to give back gains, so I’ll set it aside for observation and won’t chase.
Risk Warning: Today is more suitable for waiting for pullbacks and confirmations, not for chasing blindly; once a confirmation comes out, the cost of missing out will significantly increase, but until there’s confirmation, it’s better to do less than to force a position.
The market is still leaning towards waiting for confirmation, not suitable for chasing. Today's signals are very much like 'there's a chance, but let's see who can hold their ground': AXS is close to the 20-day line, pulling back not too deep, but showing weakness on the 1-hour chart; CLO just had a bounce, but the 6-hour is still looking weak, so let's see if it can turn that bounce into stability.
Top Candidate 1: AXSUSDT
I prefer to look at this type of setup first, not in a rush to chase. The funding rate is slightly negative, the 1-hour and 6-hour charts are slightly retreating, but the open interest on the 1-hour has increased significantly, indicating that the game is still on, the issue is that it looks more like a position of 'waiting for direction' right now.
Observation Level: Around 1.16
Trigger Condition: If it pulls back without breaking below and then re-establishes above 1.18, we’ll look to see if 1.20 can continue to open up.
Invalidation Condition: If it drops back below 1.13, it indicates that this strong push towards the moving average has lost its strength.
Top Candidate 2: CLOUSDT
Its rhythm seems more like a quick lift before checking for support, the 1-hour shows a bounce, but the 6-hour hasn’t completely turned around yet, I won’t treat it as a blind high-chasing target.
Observation Level: Around 0.267
Trigger Condition: After stabilizing above 0.268, if it continues to probe upward to 0.275, then we can consider the bounce has continuation.
Invalidation Condition: If it drops back below 0.255, it shows that the sentiment is still leaning short.
Alternative Watch / Not Chasing: BICOUSDT
It has surged quite a bit, but it's too far from the moving average, making it prone to overheating and easy to give back gains, so I’ll set it aside for observation and won’t chase.
Risk Warning: Today is more suitable for waiting for pullbacks and confirmations, not for chasing blindly; once a confirmation comes out, the cost of missing out will significantly increase, but until there’s confirmation, it’s better to do less than to force a position.
1
667




·
--
I have a vague feeling that $VVV isn’t really a question of whether it “should rise” or “should fall,” but rather that nobody is confident enough to trade it. This hunch needs data to verify it. Let’s look at two numbers first: the market cap is $578M, yet the 24-hour trading volume is only $5.42M—its volume is so low it barely looks like a mainstream token ranking #88 . Then look at the last 30 days: after the late-July spike that pushed it to $13.78, volume has slid from $31M all the way down to around $5M.
What does that indicate? Over the past year it’s up 234%; the narrative is still there. But once the price entered the $11–$13 range, turnover dried up step by step. $12.23 itself doesn’t seem expensive—there’s still 45% upside space from here to the ATH of $22.58—but the real issue isn’t whether it can rally back; it’s whether the current liquidity can support a decent, meaningful upswing. What I care about most is this: is the low-volume sideways movement caused by liquidity being locked in (chips being held), or is it simply a lack of incoming bids? The former builds up a breakout; the latter is just the silence before a slow bleed.
The risk is that the crowd trapped above $13.8 is waiting for a relief bounce to unload. If over the next few days the trading volume can’t expand back above $20M, and the price can’t hold above $13, then this sideways range can only be read as distribution rather than accumulation. The invalidation signals are quite clear: a breakout above $13.8 on increased volume, or a breakdown below $11.3 on decreased volume. My view on $VVV isn’t set in stone—I’m just trying to see which direction it chooses with volume. You can use these two conditions to watch the chart; it’ll be more useful than me giving you a conclusion.
I have a vague feeling that $VVV isn’t really a question of whether it “should rise” or “should fall,” but rather that nobody is confident enough to trade it. This hunch needs data to verify it. Let’s look at two numbers first: the market cap is $578M, yet the 24-hour trading volume is only $5.42M—its volume is so low it barely looks like a mainstream token ranking #88 . Then look at the last 30 days: after the late-July spike that pushed it to $13.78, volume has slid from $31M all the way down to around $5M.
What does that indicate? Over the past year it’s up 234%; the narrative is still there. But once the price entered the $11–$13 range, turnover dried up step by step. $12.23 itself doesn’t seem expensive—there’s still 45% upside space from here to the ATH of $22.58—but the real issue isn’t whether it can rally back; it’s whether the current liquidity can support a decent, meaningful upswing. What I care about most is this: is the low-volume sideways movement caused by liquidity being locked in (chips being held), or is it simply a lack of incoming bids? The former builds up a breakout; the latter is just the silence before a slow bleed.
The risk is that the crowd trapped above $13.8 is waiting for a relief bounce to unload. If over the next few days the trading volume can’t expand back above $20M, and the price can’t hold above $13, then this sideways range can only be read as distribution rather than accumulation. The invalidation signals are quite clear: a breakout above $13.8 on increased volume, or a breakdown below $11.3 on decreased volume. My view on $VVV isn’t set in stone—I’m just trying to see which direction it chooses with volume. You can use these two conditions to watch the chart; it’ll be more useful than me giving you a conclusion.
What does that indicate? Over the past year it’s up 234%; the narrative is still there. But once the price entered the $11–$13 range, turnover dried up step by step. $12.23 itself doesn’t seem expensive—there’s still 45% upside space from here to the ATH of $22.58—but the real issue isn’t whether it can rally back; it’s whether the current liquidity can support a decent, meaningful upswing. What I care about most is this: is the low-volume sideways movement caused by liquidity being locked in (chips being held), or is it simply a lack of incoming bids? The former builds up a breakout; the latter is just the silence before a slow bleed.
The risk is that the crowd trapped above $13.8 is waiting for a relief bounce to unload. If over the next few days the trading volume can’t expand back above $20M, and the price can’t hold above $13, then this sideways range can only be read as distribution rather than accumulation. The invalidation signals are quite clear: a breakout above $13.8 on increased volume, or a breakdown below $11.3 on decreased volume. My view on $VVV isn’t set in stone—I’m just trying to see which direction it chooses with volume. You can use these two conditions to watch the chart; it’ll be more useful than me giving you a conclusion.
84

·
--
🏆 FLIPPENING
💰 Ethereum just flipped Invesco QQQ ETF!
$ETH $232.45B · now #88 of all assets
Passed Invesco QQQ ETF ($231.73B)
🍳 Crypto vs the whole world. Not financial advice.
#CookingBNB #Crypto #Bitcoin #BTC
🏆 FLIPPENING
💰 Ethereum just flipped Invesco QQQ ETF!
$ETH $232.45B · now #88 of all assets
Passed Invesco QQQ ETF ($231.73B)
🍳 Crypto vs the whole world. Not financial advice.
#CookingBNB #Crypto #Bitcoin #BTC
💰 Ethereum just flipped Invesco QQQ ETF!
$ETH $232.45B · now #88 of all assets
Passed Invesco QQQ ETF ($231.73B)
🍳 Crypto vs the whole world. Not financial advice.
#CookingBNB #Crypto #Bitcoin #BTC

12


"Bitcoin ETFs on track for the smallest monthly inflows ever" - that’s the line from CoinDesk.
It’s a number that feels small enough to raise a question: if institutional money is flowing in, why does it feel so quiet?
Could this be a sign that institutional capital is still favoring direct exposure over ETFs?
Or is it just a temporary pause, with more inflows on the horizon?
The numbers don’t lie, but they don’t tell the whole story either.
What matters now is watching how this plays out - and whether the ETFs can catch up to the momentum elsewhere.
—
Not financial advice. DYOR.
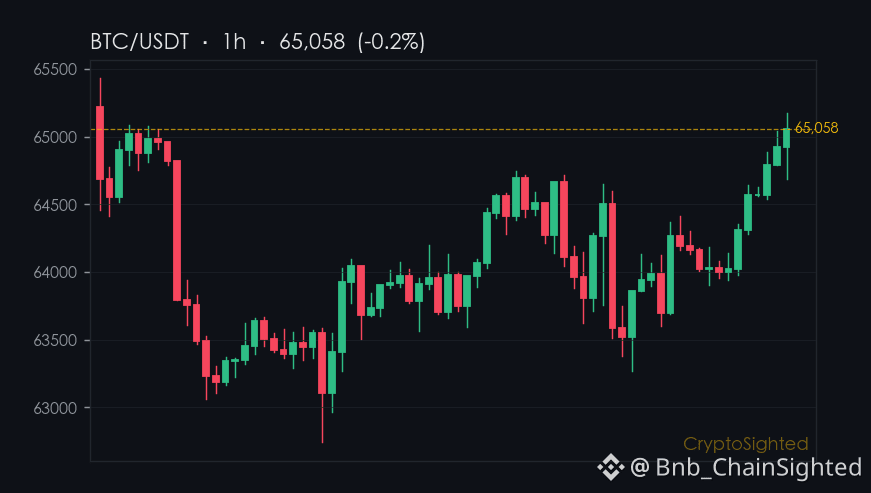
📌 News Take · #88 · #CryptoNews #CryptoSighted $BTC
"Bitcoin ETFs on track for the smallest monthly inflows ever" - that’s the line from CoinDesk.
It’s a number that feels small enough to raise a question: if institutional money is flowing in, why does it feel so quiet?
Could this be a sign that institutional capital is still favoring direct exposure over ETFs?
Or is it just a temporary pause, with more inflows on the horizon?
The numbers don’t lie, but they don’t tell the whole story either.
What matters now is watching how this plays out - and whether the ETFs can catch up to the momentum elsewhere.
—
Not financial advice. DYOR.
📌 News Take · #88 · #CryptoNews #CryptoSighted $BTC
It’s a number that feels small enough to raise a question: if institutional money is flowing in, why does it feel so quiet?
Could this be a sign that institutional capital is still favoring direct exposure over ETFs?
Or is it just a temporary pause, with more inflows on the horizon?
The numbers don’t lie, but they don’t tell the whole story either.
What matters now is watching how this plays out - and whether the ETFs can catch up to the momentum elsewhere.
—
Not financial advice. DYOR.
📌 News Take · #88 · #CryptoNews #CryptoSighted $BTC
110
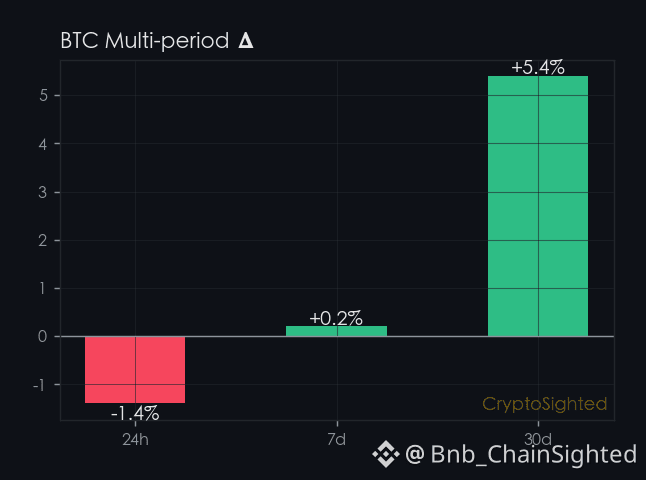
$BTC is sitting at a 1.5% loss for the 24-hour period - that’s the hook.
BTC’s 7-day price bounce is sitting at ↑0.4%, but its 30-day trend is running at ↑7.2%.
That’s a gap - and not a small one.
You see it in the numbers: the 7-day move is barely a blip, while the 30-day accumulation is building.
It’s like a runner picking up speed over weeks but barely lifting their pace in the final stretch.
The funding rate for BTC is ↑0.0059%, which is basically flat - a sign of balance between longs and shorts.
But here’s the catch: the price is down, and the funding rate isn’t.
That means the move is not being driven by leveraged bets.
It’s not a crowd pushing the price higher. It’s something else.
And that something else might not be enough to hold.
Look at the 24-hour volume - 16,861 BTC. That’s a decent number, but it’s not the kind that moves the needle in the long run.
The market is moving, but not with conviction.
Checkpoint: BTC’s funding rate is ↑0.0059% now - if it stays near that level tomorrow, the move could be holding.
But if it flips negative, the story changes. That’s the line in the sand.
The rest is your call.
—
📊 13 directional calls in the last 30d, every one auto-settled against price. Direction only — no buy/sell calls.
Not financial advice. DYOR.
📌 Funding Pulse · #88 · #FundingRate #CryptoSighted $BTC
$BTC is sitting at a 1.5% loss for the 24-hour period - that’s the hook.
BTC’s 7-day price bounce is sitting at ↑0.4%, but its 30-day trend is running at ↑7.2%.
That’s a gap - and not a small one.
You see it in the numbers: the 7-day move is barely a blip, while the 30-day accumulation is building.
It’s like a runner picking up speed over weeks but barely lifting their pace in the final stretch.
The funding rate for BTC is ↑0.0059%, which is basically flat - a sign of balance between longs and shorts.
But here’s the catch: the price is down, and the funding rate isn’t.
That means the move is not being driven by leveraged bets.
It’s not a crowd pushing the price higher. It’s something else.
And that something else might not be enough to hold.
Look at the 24-hour volume - 16,861 BTC. That’s a decent number, but it’s not the kind that moves the needle in the long run.
The market is moving, but not with conviction.
Checkpoint: BTC’s funding rate is ↑0.0059% now - if it stays near that level tomorrow, the move could be holding.
But if it flips negative, the story changes. That’s the line in the sand.
The rest is your call.
—
📊 13 directional calls in the last 30d, every one auto-settled against price. Direction only — no buy/sell calls.
Not financial advice. DYOR.
📌 Funding Pulse · #88 · #FundingRate #CryptoSighted $BTC
BTC’s 7-day price bounce is sitting at ↑0.4%, but its 30-day trend is running at ↑7.2%.
That’s a gap - and not a small one.
You see it in the numbers: the 7-day move is barely a blip, while the 30-day accumulation is building.
It’s like a runner picking up speed over weeks but barely lifting their pace in the final stretch.
The funding rate for BTC is ↑0.0059%, which is basically flat - a sign of balance between longs and shorts.
But here’s the catch: the price is down, and the funding rate isn’t.
That means the move is not being driven by leveraged bets.
It’s not a crowd pushing the price higher. It’s something else.
And that something else might not be enough to hold.
Look at the 24-hour volume - 16,861 BTC. That’s a decent number, but it’s not the kind that moves the needle in the long run.
The market is moving, but not with conviction.
Checkpoint: BTC’s funding rate is ↑0.0059% now - if it stays near that level tomorrow, the move could be holding.
But if it flips negative, the story changes. That’s the line in the sand.
The rest is your call.
—
📊 13 directional calls in the last 30d, every one auto-settled against price. Direction only — no buy/sell calls.
Not financial advice. DYOR.
📌 Funding Pulse · #88 · #FundingRate #CryptoSighted $BTC
247

Article
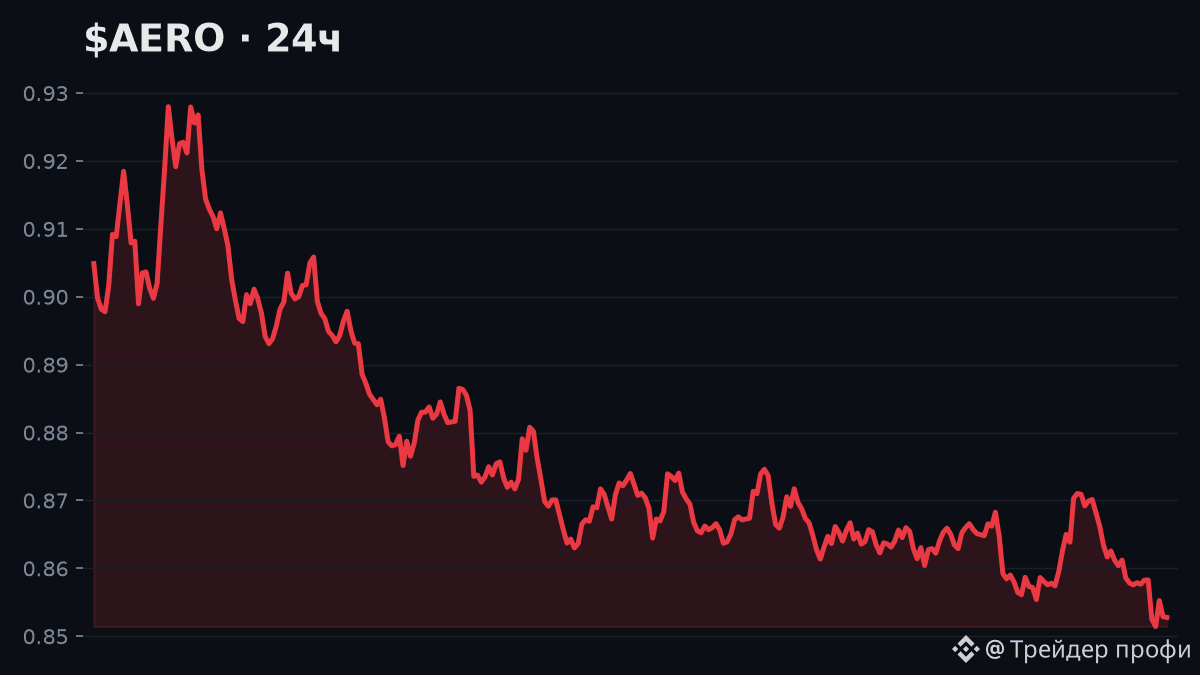
$AERO -6.2% over 24h — gave up positions more than anyone else in the top-100!💥 $AERO -6.2% over 24h — gave up positions more than anyone else in the top-100!
Day breakdown — short and to the point.
🧭 Summary: movement is AGAINST the broader trend (7d/30d in the opposite direction) — looks more like a short-term rebound/correction rather than a trend reversal.
🌍 Market context: out of 64 large-cap coins with notable movement over 24h — 🔼 52 went up, 🔽 12 went down
$AERO -6.2% over 24h — gave up positions more than anyone else in the top-100!
💥 $AERO -6.2% over 24h — gave up positions more than anyone else in the top-100!
Day breakdown — short and to the point.
🧭 Summary: movement is AGAINST the broader trend (7d/30d in the opposite direction) — looks more like a short-term rebound/correction rather than a trend reversal.
🌍 Market context: out of 64 large-cap coins with notable movement over 24h — 🔼 52 went up, 🔽 12 went down
Day breakdown — short and to the point.
🧭 Summary: movement is AGAINST the broader trend (7d/30d in the opposite direction) — looks more like a short-term rebound/correction rather than a trend reversal.
🌍 Market context: out of 64 large-cap coins with notable movement over 24h — 🔼 52 went up, 🔽 12 went down
555

·
--
CAP Surges 11% in 15 Minutes! What Happened? Key Levels Here11:54 (18 minutes ago): CAP surged 11% within 15 minutes (15-minute window: 11:39→11:54). As of 12:12:40, its price is 0.0912, up 24.7% over 24h. US and STRK also saw unusual moves around the same time.
📅 Data as of 12:12:40 (event trigger times are noted in each item; prices are real-time snapshots at the time of writing)
📌 In a nutshell: The 15-minute trend has been amplified. Before following it, decide where to place your stop-loss.
Market overview: BTC 82,636.30(+0.24%) · ETH 2,491.96(-0.06%); 381 assets up / 109 down across the market over 24h; 24h top gainer: MAGIC+133.15%, top loser: OGN-21.35%.
CAP Surges 11% in 15 Minutes! What Happened? Key Levels Here
11:54 (18 minutes ago): CAP surged 11% within 15 minutes (15-minute window: 11:39→11:54). As of 12:12:40, its price is 0.0912, up 24.7% over 24h. US and STRK also saw unusual moves around the same time.
📅 Data as of 12:12:40 (event trigger times are noted in each item; prices are real-time snapshots at the time of writing)
📌 In a nutshell: The 15-minute trend has been amplified. Before following it, decide where to place your stop-loss.
Market overview: BTC 82,636.30(+0.24%) · ETH 2,491.96(-0.06%); 381 assets up / 109 down across the market over 24h; 24h top gainer: MAGIC+133.15%, top loser: OGN-21.35%.
📅 Data as of 12:12:40 (event trigger times are noted in each item; prices are real-time snapshots at the time of writing)
📌 In a nutshell: The 15-minute trend has been amplified. Before following it, decide where to place your stop-loss.
Market overview: BTC 82,636.30(+0.24%) · ETH 2,491.96(-0.06%); 381 assets up / 109 down across the market over 24h; 24h top gainer: MAGIC+133.15%, top loser: OGN-21.35%.
180

·
--
Bearish
8
·
--
$VVV My first impression is that this rebound is still waiting for a confirmation. It’s up 20% over 7 days—from $10.5 to a steady recovery at $13.6. It looks good, but the 24-hour trading volume is only $22M, down from $73M on July 2. The hype is clearly cooler. With the market cap ranking at #88, this price-volume combination feels a bit off.
The real thing to verify is—whether this move is a repair after a mid-term pullback, or the start of a fresh accumulation phase. From the 30-day chart, $VVV stopped the consecutive decline at $10.5. Over the past week it pulled back to $13.6, but it’s still 39% below ATH, and the trading volume hasn’t increased in sync over the last few days. Back when it was at $13.6 previously, there was $46M of volume support. Now it has only about half. The money looks more like it’s defending and accumulating in the $12–13 range on dips, not actively chasing higher prices.
What I care about most is this: if the rebound is truly starting, volume shouldn’t hover below $20M for several consecutive days. Current holders’ positions aren’t bad at all—there’s still about 30% room above the recent low. But how much of the unrealized gains is being given by liquidity, and how much is being driven by the narrative? That’s worth thinking through. Those watching are waiting for a breakout with volume that holds above $13.7—not a one-day spike followed by thinning volume and slow grinding.
The risk here is: if volume can’t catch up over the next few days, this “break” may just shift the trading range upward, rather than reversing into a trend.
The test of whether the thesis holds isn’t how much it rises today, but whether new long buyers are willing to step in and defend below $12.5. Once that level breaks, the whole rhythm needs to be reassessed.
$VVV My first impression is that this rebound is still waiting for a confirmation. It’s up 20% over 7 days—from $10.5 to a steady recovery at $13.6. It looks good, but the 24-hour trading volume is only $22M, down from $73M on July 2. The hype is clearly cooler. With the market cap ranking at #88, this price-volume combination feels a bit off.
The real thing to verify is—whether this move is a repair after a mid-term pullback, or the start of a fresh accumulation phase. From the 30-day chart, $VVV stopped the consecutive decline at $10.5. Over the past week it pulled back to $13.6, but it’s still 39% below ATH, and the trading volume hasn’t increased in sync over the last few days. Back when it was at $13.6 previously, there was $46M of volume support. Now it has only about half. The money looks more like it’s defending and accumulating in the $12–13 range on dips, not actively chasing higher prices.
What I care about most is this: if the rebound is truly starting, volume shouldn’t hover below $20M for several consecutive days. Current holders’ positions aren’t bad at all—there’s still about 30% room above the recent low. But how much of the unrealized gains is being given by liquidity, and how much is being driven by the narrative? That’s worth thinking through. Those watching are waiting for a breakout with volume that holds above $13.7—not a one-day spike followed by thinning volume and slow grinding.
The risk here is: if volume can’t catch up over the next few days, this “break” may just shift the trading range upward, rather than reversing into a trend.
The test of whether the thesis holds isn’t how much it rises today, but whether new long buyers are willing to step in and defend below $12.5. Once that level breaks, the whole rhythm needs to be reassessed.
The real thing to verify is—whether this move is a repair after a mid-term pullback, or the start of a fresh accumulation phase. From the 30-day chart, $VVV stopped the consecutive decline at $10.5. Over the past week it pulled back to $13.6, but it’s still 39% below ATH, and the trading volume hasn’t increased in sync over the last few days. Back when it was at $13.6 previously, there was $46M of volume support. Now it has only about half. The money looks more like it’s defending and accumulating in the $12–13 range on dips, not actively chasing higher prices.
What I care about most is this: if the rebound is truly starting, volume shouldn’t hover below $20M for several consecutive days. Current holders’ positions aren’t bad at all—there’s still about 30% room above the recent low. But how much of the unrealized gains is being given by liquidity, and how much is being driven by the narrative? That’s worth thinking through. Those watching are waiting for a breakout with volume that holds above $13.7—not a one-day spike followed by thinning volume and slow grinding.
The risk here is: if volume can’t catch up over the next few days, this “break” may just shift the trading range upward, rather than reversing into a trend.
The test of whether the thesis holds isn’t how much it rises today, but whether new long buyers are willing to step in and defend below $12.5. Once that level breaks, the whole rhythm needs to be reassessed.
1
126

·
--
I’ve been watching CoinGecko’s trending board and the top movers grabbed my attention. 🚀 Hyperliquid (HYPE) surged +14%, Solana (SOL) climbed +9%, and Bitcoin (BTC) added +2% today.
Next on my list, Pump.fun (PUMP) jumped +11% while Bitway (BTW) rallied +8%, and Venice Token (VVV) nudged +5% after a fresh partnership announcement. 📈 Their market‑cap ranks—#62, #51, and #88—prove that mid‑tier projects can still spark rapid interest.
I’m also eyeing GALA (GALA), down –3% but still a #324 player, and I expect a bounce soon. 🔥 I’ll rebalance my watchlist this week to catch both growth spikes and corrections. 📊
$ACE, $HEMI, $ACE
I’ve been watching CoinGecko’s trending board and the top movers grabbed my attention. 🚀 Hyperliquid (HYPE) surged +14%, Solana (SOL) climbed +9%, and Bitcoin (BTC) added +2% today.
Next on my list, Pump.fun (PUMP) jumped +11% while Bitway (BTW) rallied +8%, and Venice Token (VVV) nudged +5% after a fresh partnership announcement. 📈 Their market‑cap ranks—#62, #51, and #88—prove that mid‑tier projects can still spark rapid interest.
I’m also eyeing GALA (GALA), down –3% but still a #324 player, and I expect a bounce soon. 🔥 I’ll rebalance my watchlist this week to catch both growth spikes and corrections. 📊
$ACE , $HEMI , $ACE
Next on my list, Pump.fun (PUMP) jumped +11% while Bitway (BTW) rallied +8%, and Venice Token (VVV) nudged +5% after a fresh partnership announcement. 📈 Their market‑cap ranks—#62, #51, and #88—prove that mid‑tier projects can still spark rapid interest.
I’m also eyeing GALA (GALA), down –3% but still a #324 player, and I expect a bounce soon. 🔥 I’ll rebalance my watchlist this week to catch both growth spikes and corrections. 📊
$ACE , $HEMI , $ACE
1
154
·
--
$AERO Now at $0.87, with 62% more drawdown required to reach the ATH by $2.32. This number itself will drive the trade—some people think that climbing from $0.47 is already enough to prove the bottom is accepted, while others stare at the 62% pit and think there’s still plenty of room. Both sides are making decisions using the same anchor, yet arriving at completely opposite conclusions.
What truly matters is what happened on September 26: $142M in volume pushed the price directly from $0.69 to $0.85. Over the past two days, volume has stayed above $120M and hasn’t immediately faded. In 30 days, it’s up +64%, but the 24h gain has already narrowed to 3.14%, suggesting that the strong breakout phase may be temporarily over and the market is entering a digestion period. Market cap #88 at $867M—this level isn’t exactly cheap, but it’s also not in bubble territory.
What I care more about is the $0.66–$0.69 zone—the lower boundary that was tested multiple times in mid-September. If the subsequent pullback doesn’t break it, the trend structure remains intact. But if it drops back on increased volume, then this +64% move turns into a one-off impulse rather than the start of a new cycle.
The current disagreement is clear: wait for confirmation on the pullback before entering—you might not get the ideal price. If you buy in early, you have to be mentally prepared for a 15–20% drawdown. Neither choice is obviously better; it depends on how much cost you’re willing to pay for uncertainty. If volume can stay above $0.80 for another week, the answer will become much clearer.
$AERO Now at $0.87, with 62% more drawdown required to reach the ATH by $2.32. This number itself will drive the trade—some people think that climbing from $0.47 is already enough to prove the bottom is accepted, while others stare at the 62% pit and think there’s still plenty of room. Both sides are making decisions using the same anchor, yet arriving at completely opposite conclusions.
What truly matters is what happened on September 26: $142M in volume pushed the price directly from $0.69 to $0.85. Over the past two days, volume has stayed above $120M and hasn’t immediately faded. In 30 days, it’s up +64%, but the 24h gain has already narrowed to 3.14%, suggesting that the strong breakout phase may be temporarily over and the market is entering a digestion period. Market cap #88 at $867M—this level isn’t exactly cheap, but it’s also not in bubble territory.
What I care more about is the $0.66–$0.69 zone—the lower boundary that was tested multiple times in mid-September. If the subsequent pullback doesn’t break it, the trend structure remains intact. But if it drops back on increased volume, then this +64% move turns into a one-off impulse rather than the start of a new cycle.
The current disagreement is clear: wait for confirmation on the pullback before entering—you might not get the ideal price. If you buy in early, you have to be mentally prepared for a 15–20% drawdown. Neither choice is obviously better; it depends on how much cost you’re willing to pay for uncertainty. If volume can stay above $0.80 for another week, the answer will become much clearer.
What truly matters is what happened on September 26: $142M in volume pushed the price directly from $0.69 to $0.85. Over the past two days, volume has stayed above $120M and hasn’t immediately faded. In 30 days, it’s up +64%, but the 24h gain has already narrowed to 3.14%, suggesting that the strong breakout phase may be temporarily over and the market is entering a digestion period. Market cap #88 at $867M—this level isn’t exactly cheap, but it’s also not in bubble territory.
What I care more about is the $0.66–$0.69 zone—the lower boundary that was tested multiple times in mid-September. If the subsequent pullback doesn’t break it, the trend structure remains intact. But if it drops back on increased volume, then this +64% move turns into a one-off impulse rather than the start of a new cycle.
The current disagreement is clear: wait for confirmation on the pullback before entering—you might not get the ideal price. If you buy in early, you have to be mentally prepared for a 15–20% drawdown. Neither choice is obviously better; it depends on how much cost you’re willing to pay for uncertainty. If volume can stay above $0.80 for another week, the answer will become much clearer.
40
Log in to explore more content
Join global crypto users on Binance Square
⚡️ Get latest and useful information about crypto.
💬 Trusted by the world’s largest crypto exchange.
👍 Discover real insights from verified creators.
Email / Phone number
Trending Topics
1
#NvidiaEarningsTonight:AIStocks’NextMove?
64,710 views
914 Discussing
2
#A Packed Week of Earnings and Data Tests Markets
122,110 views
615 Discussing
3
#AnthropicIPOTestsInvestorAppetiteForAI
269,180 views
2,628 Discussing
4
#NvidiaBoardNotConsideringHuang’sReturnasCEO
77,990 views
784 Discussing
5
#KOSPIFalls2.59%ToLowestCloseSinceFebruary
13,879 views
191 Discussing
6
#AnthropicClearedToListOnNasdaqAsANT
15,145 views
174 Discussing
7
#WhatInvestmentSignalsDo13FFilingsReveal?
43,551 views
559 Discussing
8
#TetherCapitalMakesStrategicInvestmentInStables
5,080 views
58 Discussing
9
#EvernorthRecords$505MImpairmentOnPreListingXRP
1,213 views
19 Discussing
10
#GoldmanSachsReports$1.22BInEtherETFHoldings
953 views
15 Discussing