
#583
583
472 views
23 Discussing
Hot
Latest

·
--
🚨 Risk aversion is rising amid the Binance security incident—$NIL , I’m bearish on the daily chart
【View】$NIL (Nillion) → Bearish
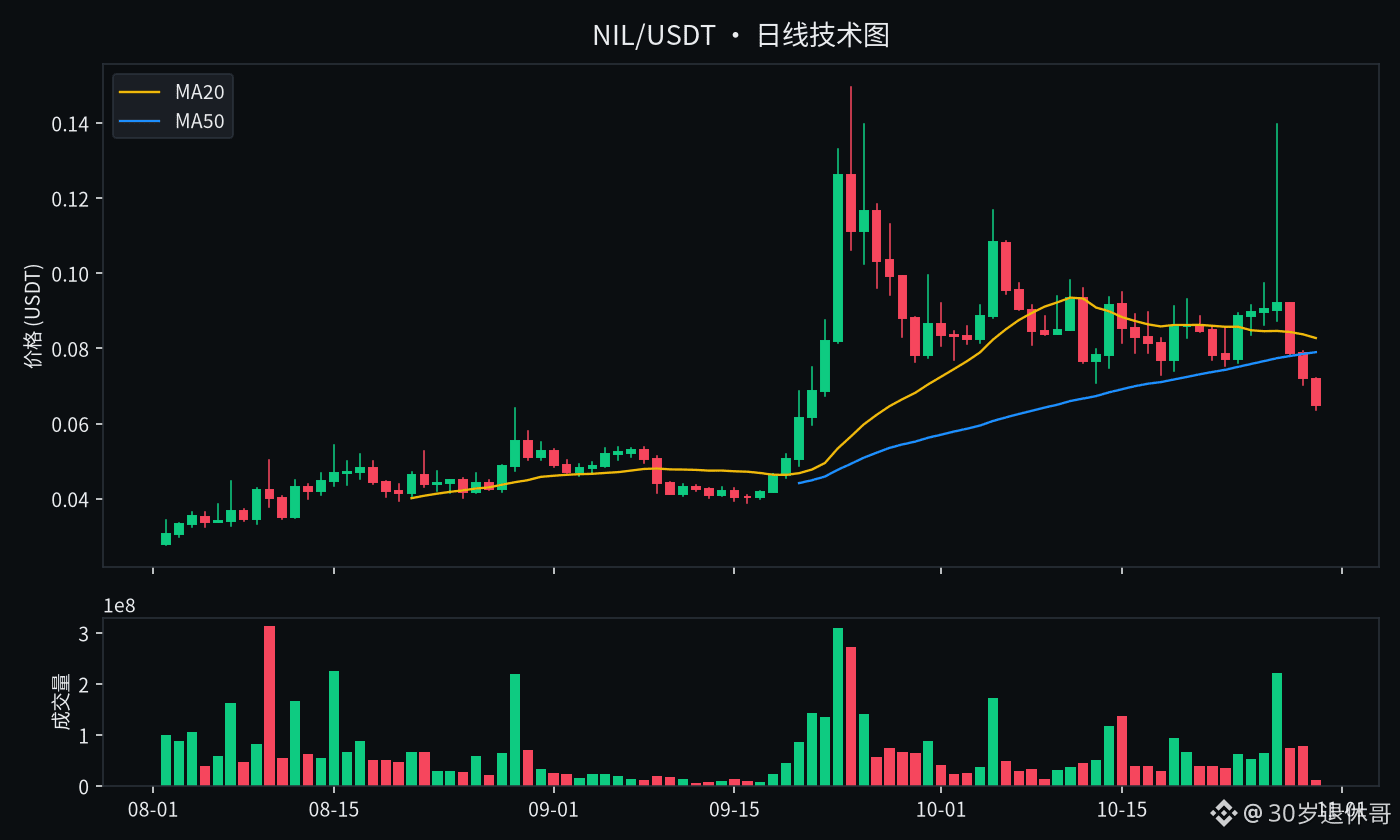
Market cap rank around #583; current price around 0.064950. MA20≈0.082754 and MA50≈0.078998. Price is below the moving averages, and each bounce looks more like an exit window for trapped holders above. In a bearish trend, “buying the dip” can easily turn into “catching a falling knife.” Key levels: resistance≈0.13968, support≈0.063680; invalidation at 0.081512—I’ll admit I’m wrong and turn neutral if price reclaims it decisively. Volume is about 1.2 times the 20-day average; we’ll need to watch volume to tell whether a breakout is real.
Background: CZ also said it “looks like Binance was hacked”; a stablecoin issuer has frozen over $2 billion. The broader market is shedding risk appetite first. I’m only sharing $NIL levels based on the daily chart structure—not making a trade.
📌 Reference levels (daily ATR≈0.009742)
Direction: Short
Entry: 0.064950–0.069821
TP1: 0.053259 TP2: 0.039132 TP3: 0.025006
SL: 0.081512
Key things to watch: whether a bounce to 0.13968 gets rejected, and whether 0.063680 holds.
Are you still holding $NIL ? Can you hold on, or are you ready to admit you’re wrong? Let’s talk in the comments.
⚠️ Disclaimer: This is only my personal opinion, not investment advice. Be aware of the risks.
$BTC $ETH $NIL #看空 #币安安全事件 #WriteToEarn
🚨 Risk aversion is rising amid the Binance security incident—$NIL , I’m bearish on the daily chart
【View】$NIL (Nillion) → Bearish
Market cap rank around #583; current price around 0.064950. MA20≈0.082754 and MA50≈0.078998. Price is below the moving averages, and each bounce looks more like an exit window for trapped holders above. In a bearish trend, “buying the dip” can easily turn into “catching a falling knife.” Key levels: resistance≈0.13968, support≈0.063680; invalidation at 0.081512—I’ll admit I’m wrong and turn neutral if price reclaims it decisively. Volume is about 1.2 times the 20-day average; we’ll need to watch volume to tell whether a breakout is real.
Background: CZ also said it “looks like Binance was hacked”; a stablecoin issuer has frozen over $2 billion. The broader market is shedding risk appetite first. I’m only sharing $NIL levels based on the daily chart structure—not making a trade.
📌 Reference levels (daily ATR≈0.009742)
Direction: Short
Entry: 0.064950–0.069821
TP1: 0.053259 TP2: 0.039132 TP3: 0.025006
SL: 0.081512
Key things to watch: whether a bounce to 0.13968 gets rejected, and whether 0.063680 holds.
Are you still holding $NIL ? Can you hold on, or are you ready to admit you’re wrong? Let’s talk in the comments.
⚠️ Disclaimer: This is only my personal opinion, not investment advice. Be aware of the risks.
$BTC $ETH $NIL #看空 #币安安全事件 #WriteToEarn
【View】$NIL (Nillion) → Bearish
Market cap rank around #583; current price around 0.064950. MA20≈0.082754 and MA50≈0.078998. Price is below the moving averages, and each bounce looks more like an exit window for trapped holders above. In a bearish trend, “buying the dip” can easily turn into “catching a falling knife.” Key levels: resistance≈0.13968, support≈0.063680; invalidation at 0.081512—I’ll admit I’m wrong and turn neutral if price reclaims it decisively. Volume is about 1.2 times the 20-day average; we’ll need to watch volume to tell whether a breakout is real.
Background: CZ also said it “looks like Binance was hacked”; a stablecoin issuer has frozen over $2 billion. The broader market is shedding risk appetite first. I’m only sharing $NIL levels based on the daily chart structure—not making a trade.
📌 Reference levels (daily ATR≈0.009742)
Direction: Short
Entry: 0.064950–0.069821
TP1: 0.053259 TP2: 0.039132 TP3: 0.025006
SL: 0.081512
Key things to watch: whether a bounce to 0.13968 gets rejected, and whether 0.063680 holds.
Are you still holding $NIL ? Can you hold on, or are you ready to admit you’re wrong? Let’s talk in the comments.
⚠️ Disclaimer: This is only my personal opinion, not investment advice. Be aware of the risks.
$BTC $ETH $NIL #看空 #币安安全事件 #WriteToEarn
479

·
--
$INIT just reopened the leg the last post said was dead — $0.16054 closed above $0.15544, and it held for four straight hours.
The give-back from the last post ran its course first: after the 09:00 UTC close under $0.1531, INIT chopped $0.148–$0.150 through midday, then 13:00 UTC closed $0.15306. Then the leg reopened: 14:00 UTC closed $0.15677 above the $0.15544 line, 15:00 held $0.15640, 16:00 closed $0.16054, and 17:00 backed it up at $0.15998. Four straight closes above the line — the first time since the give-back deepened. The forming 18:00 hour trades $0.1647, unclosed, pushing toward the $0.1680 ceiling.
This is still a genuinely tiny coin: rank #583, $34.7M market cap, 210.8M of 1B tokens circulating (21.1%), 88% below its $1.42 all-time high. Binance volume is $3.39M, global volume $14.5M, and the 1h chart is firming, not hot (RSI 59.7, above EMA20 $0.1542 and EMA50 $0.1490).
The lines: an hourly close above $0.1680 means the leg continues; an hourly close back below $0.15544 means it fails again, with $0.1494 then $0.1451 underneath.
No fresh catalyst for this leg itself — the backdrop is unchanged: Initia's chain remains halted after the Oct 23 mint exploit of over 2.6 million dollars, so this is flow trading on a paused chain, not conviction. Not a call, in either direction.
Does the 18:00 hour close above $0.1680, or does $0.15544 take the leg back?
$INIT just reopened the leg the last post said was dead — $0.16054 closed above $0.15544, and it held for four straight hours.
The give-back from the last post ran its course first: after the 09:00 UTC close under $0.1531, INIT chopped $0.148–$0.150 through midday, then 13:00 UTC closed $0.15306. Then the leg reopened: 14:00 UTC closed $0.15677 above the $0.15544 line, 15:00 held $0.15640, 16:00 closed $0.16054, and 17:00 backed it up at $0.15998. Four straight closes above the line — the first time since the give-back deepened. The forming 18:00 hour trades $0.1647, unclosed, pushing toward the $0.1680 ceiling.
This is still a genuinely tiny coin: rank #583, $34.7M market cap, 210.8M of 1B tokens circulating (21.1%), 88% below its $1.42 all-time high. Binance volume is $3.39M, global volume $14.5M, and the 1h chart is firming, not hot (RSI 59.7, above EMA20 $0.1542 and EMA50 $0.1490).
The lines: an hourly close above $0.1680 means the leg continues; an hourly close back below $0.15544 means it fails again, with $0.1494 then $0.1451 underneath.
No fresh catalyst for this leg itself — the backdrop is unchanged: Initia's chain remains halted after the Oct 23 mint exploit of over 2.6 million dollars, so this is flow trading on a paused chain, not conviction. Not a call, in either direction.
Does the 18:00 hour close above $0.1680, or does $0.15544 take the leg back?
The give-back from the last post ran its course first: after the 09:00 UTC close under $0.1531, INIT chopped $0.148–$0.150 through midday, then 13:00 UTC closed $0.15306. Then the leg reopened: 14:00 UTC closed $0.15677 above the $0.15544 line, 15:00 held $0.15640, 16:00 closed $0.16054, and 17:00 backed it up at $0.15998. Four straight closes above the line — the first time since the give-back deepened. The forming 18:00 hour trades $0.1647, unclosed, pushing toward the $0.1680 ceiling.
This is still a genuinely tiny coin: rank #583, $34.7M market cap, 210.8M of 1B tokens circulating (21.1%), 88% below its $1.42 all-time high. Binance volume is $3.39M, global volume $14.5M, and the 1h chart is firming, not hot (RSI 59.7, above EMA20 $0.1542 and EMA50 $0.1490).
The lines: an hourly close above $0.1680 means the leg continues; an hourly close back below $0.15544 means it fails again, with $0.1494 then $0.1451 underneath.
No fresh catalyst for this leg itself — the backdrop is unchanged: Initia's chain remains halted after the Oct 23 mint exploit of over 2.6 million dollars, so this is flow trading on a paused chain, not conviction. Not a call, in either direction.
Does the 18:00 hour close above $0.1680, or does $0.15544 take the leg back?
4
·
--
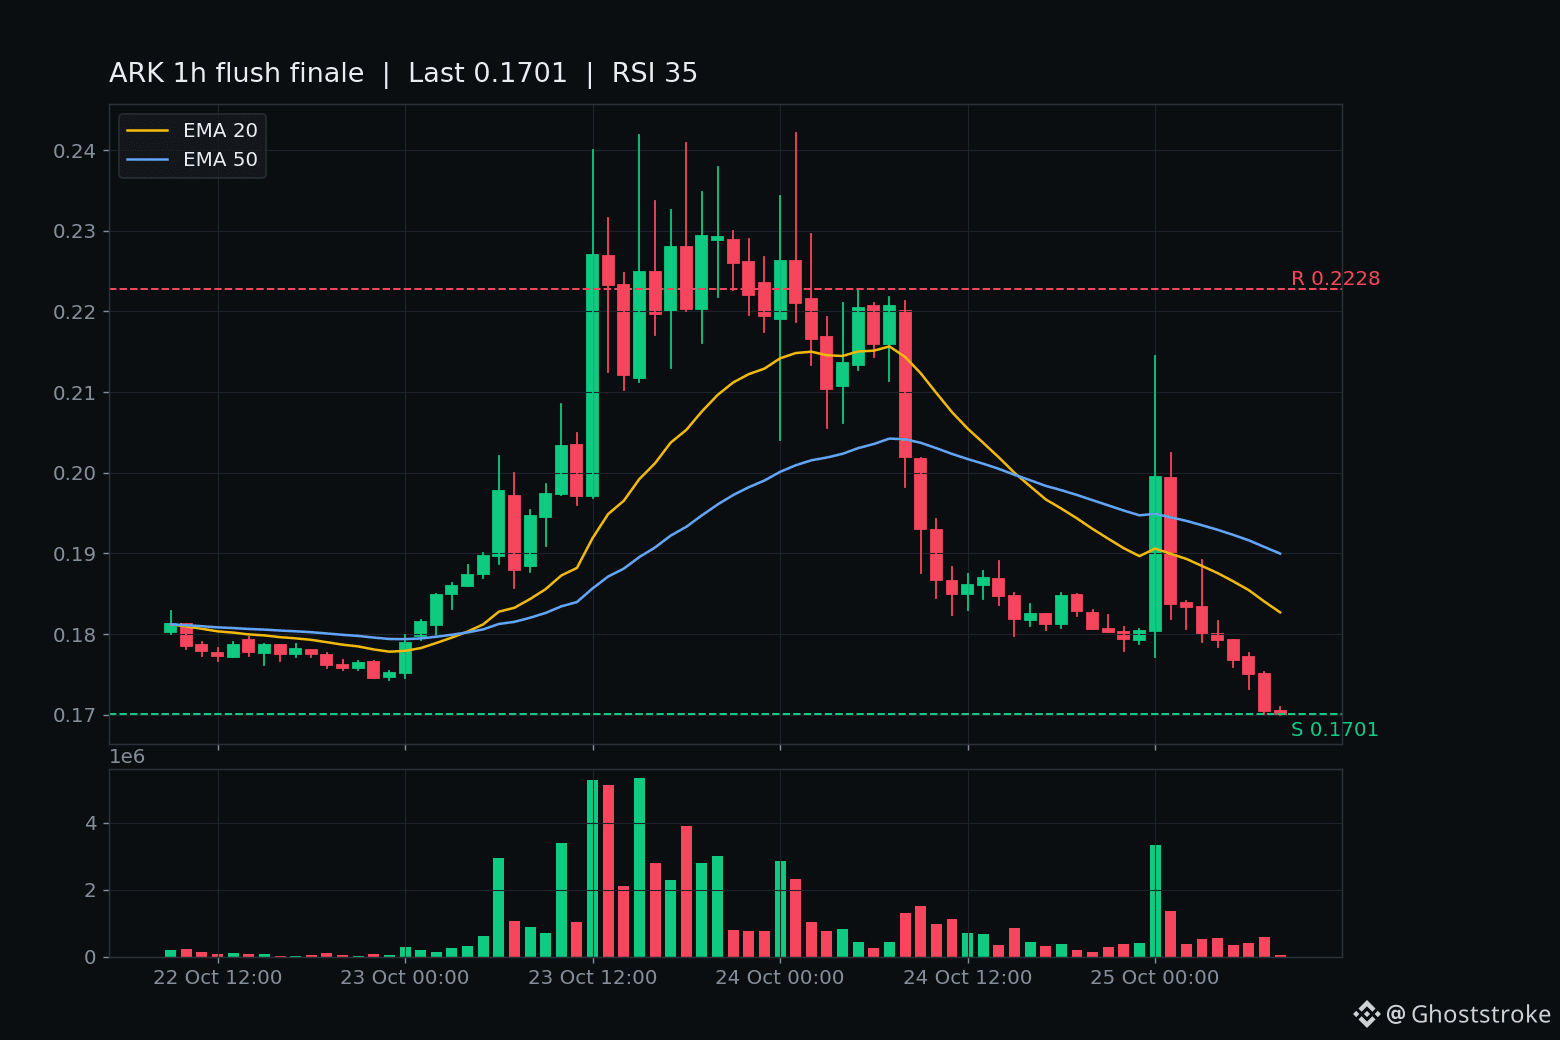
$ARK just lost the base it held for two days — three straight hourly closes under $0.178, and the last one closed at $0.1705.
The tape, closed hourly candles only: overnight it tried the other direction first. The 00:00 UTC candle spiked to $0.2145 on $647k, then closed $0.1995 — and the next hour gave the whole spike back, closing $0.1837. A rejected spike, not a breakout.
Then the grind down: $0.1834, $0.1801, $0.1792. Then the break — 05:00 UTC closed $0.1768, the first close under the $0.178 base. 06:00 UTC closed $0.1750 on $72k. 07:00 UTC closed $0.1705 on $101k, the low $0.1701. Three closes below the line, each lower, volume rising into the fall. The forming hour sits at $0.1701, unclosed — not counted as anything yet.
Live $0.1701, -20.1% in 24 hours, $3.25M Binance volume. ARK is genuinely small: rank #583, $34.4M market cap, 200M of 200M tokens circulating, 98% below its $10.22 all-time high. The 1h chart has RSI 35, price under the EMA20 at $0.1827 and the EMA50 at $0.1900 — falling, not washed out.
No verified fresh catalyst. The October dev reports show Mainsail testnet work continuing, but no launch announcement today — this is still the mid-October testnet-reset front-run unwinding, not news. The September precedent is the warning: the same story spiked 69% to $0.4262, closed the day at $0.2395, then bled to $0.1664 over 18 days.
Levels now: resistance $0.178 — an hourly close back above it and this break has failed — then $0.2021. Support $0.1700, today's low, then $0.1664, the September bleed low, about 2% below here.
Not a call. This is the flush finale the October 23 pump's base was holding back — and at this size, a break on rising volume can run further before it washes out.
Does $0.178 get retaken, or is $0.1664 next?
$ARK just lost the base it held for two days — three straight hourly closes under $0.178, and the last one closed at $0.1705.
The tape, closed hourly candles only: overnight it tried the other direction first. The 00:00 UTC candle spiked to $0.2145 on $647k, then closed $0.1995 — and the next hour gave the whole spike back, closing $0.1837. A rejected spike, not a breakout.
Then the grind down: $0.1834, $0.1801, $0.1792. Then the break — 05:00 UTC closed $0.1768, the first close under the $0.178 base. 06:00 UTC closed $0.1750 on $72k. 07:00 UTC closed $0.1705 on $101k, the low $0.1701. Three closes below the line, each lower, volume rising into the fall. The forming hour sits at $0.1701, unclosed — not counted as anything yet.
Live $0.1701, -20.1% in 24 hours, $3.25M Binance volume. ARK is genuinely small: rank #583, $34.4M market cap, 200M of 200M tokens circulating, 98% below its $10.22 all-time high. The 1h chart has RSI 35, price under the EMA20 at $0.1827 and the EMA50 at $0.1900 — falling, not washed out.
No verified fresh catalyst. The October dev reports show Mainsail testnet work continuing, but no launch announcement today — this is still the mid-October testnet-reset front-run unwinding, not news. The September precedent is the warning: the same story spiked 69% to $0.4262, closed the day at $0.2395, then bled to $0.1664 over 18 days.
Levels now: resistance $0.178 — an hourly close back above it and this break has failed — then $0.2021. Support $0.1700, today's low, then $0.1664, the September bleed low, about 2% below here.
Not a call. This is the flush finale the October 23 pump's base was holding back — and at this size, a break on rising volume can run further before it washes out.
Does $0.178 get retaken, or is $0.1664 next?
The tape, closed hourly candles only: overnight it tried the other direction first. The 00:00 UTC candle spiked to $0.2145 on $647k, then closed $0.1995 — and the next hour gave the whole spike back, closing $0.1837. A rejected spike, not a breakout.
Then the grind down: $0.1834, $0.1801, $0.1792. Then the break — 05:00 UTC closed $0.1768, the first close under the $0.178 base. 06:00 UTC closed $0.1750 on $72k. 07:00 UTC closed $0.1705 on $101k, the low $0.1701. Three closes below the line, each lower, volume rising into the fall. The forming hour sits at $0.1701, unclosed — not counted as anything yet.
Live $0.1701, -20.1% in 24 hours, $3.25M Binance volume. ARK is genuinely small: rank #583, $34.4M market cap, 200M of 200M tokens circulating, 98% below its $10.22 all-time high. The 1h chart has RSI 35, price under the EMA20 at $0.1827 and the EMA50 at $0.1900 — falling, not washed out.
No verified fresh catalyst. The October dev reports show Mainsail testnet work continuing, but no launch announcement today — this is still the mid-October testnet-reset front-run unwinding, not news. The September precedent is the warning: the same story spiked 69% to $0.4262, closed the day at $0.2395, then bled to $0.1664 over 18 days.
Levels now: resistance $0.178 — an hourly close back above it and this break has failed — then $0.2021. Support $0.1700, today's low, then $0.1664, the September bleed low, about 2% below here.
Not a call. This is the flush finale the October 23 pump's base was holding back — and at this size, a break on rising volume can run further before it washes out.
Does $0.178 get retaken, or is $0.1664 next?
3

·
--
CTK Suddenly Plunges 4.8% in 5 Minutes! Panic or Opportunity? A Quick Look at Support LevelsAt 02:01 (2 minutes ago), CTK fell 4.8% within 5 minutes (5-minute window: 01:56→02:01). As of 02:03:13, its current price is 0.1542, up 18.2% over 24h. OGN and SKL also showed unusual moves during the same period.
📅 Data as of 02:03:13 (event trigger times are noted in each item; prices are real-time snapshots taken when this was written)
📌 In a nutshell: Short-term momentum is concentrated, and pullbacks can come quickly—placing staggered orders is steadier than chasing a rally
Market overview: BTC 82,509.60 (-1.48%) · ETH 2,512.19 (-0.94%); across the market, 70 assets rose and 422 fell over 24h; top gainer over 24h: GTC +69.17%; top loser: BOME -25.58%.
CTK Suddenly Plunges 4.8% in 5 Minutes! Panic or Opportunity? A Quick Look at Support Levels
At 02:01 (2 minutes ago), CTK fell 4.8% within 5 minutes (5-minute window: 01:56→02:01). As of 02:03:13, its current price is 0.1542, up 18.2% over 24h. OGN and SKL also showed unusual moves during the same period.
📅 Data as of 02:03:13 (event trigger times are noted in each item; prices are real-time snapshots taken when this was written)
📌 In a nutshell: Short-term momentum is concentrated, and pullbacks can come quickly—placing staggered orders is steadier than chasing a rally
Market overview: BTC 82,509.60 (-1.48%) · ETH 2,512.19 (-0.94%); across the market, 70 assets rose and 422 fell over 24h; top gainer over 24h: GTC +69.17%; top loser: BOME -25.58%.
📅 Data as of 02:03:13 (event trigger times are noted in each item; prices are real-time snapshots taken when this was written)
📌 In a nutshell: Short-term momentum is concentrated, and pullbacks can come quickly—placing staggered orders is steadier than chasing a rally
Market overview: BTC 82,509.60 (-1.48%) · ETH 2,512.19 (-0.94%); across the market, 70 assets rose and 422 fell over 24h; top gainer over 24h: GTC +69.17%; top loser: BOME -25.58%.
·
--
BTR suddenly plunged 11% within 15 minutes! Panic or opportunity? Quick look at support levels00:24 (27 minutes ago) BTR fell 11% within 15 minutes (15-minute window 00:09→00:24). As of 00:52:37, the current price is 0.05119, with 24h +1.2%. Other assets with the same batch of unusual moves include CTK and DYM.
📅 Data as of 00:52:37 (event trigger times are shown in each entry; prices are real-time snapshots at the time of writing)
📌 One-sentence highlight: the 15-minute trend has been magnified; before following the trend, decide where to place your stop-loss
Market overview: BTC 82,596.30(-1.52%) · ETH 2,519.88(-1.18%); in the overall market, 62 coins are up / 429 coins are down in the past 24h; 24h top gainer GTC+59.33%, top loser BOME-25.38%.
BTR suddenly plunged 11% within 15 minutes! Panic or opportunity? Quick look at support levels
00:24 (27 minutes ago) BTR fell 11% within 15 minutes (15-minute window 00:09→00:24). As of 00:52:37, the current price is 0.05119, with 24h +1.2%. Other assets with the same batch of unusual moves include CTK and DYM.
📅 Data as of 00:52:37 (event trigger times are shown in each entry; prices are real-time snapshots at the time of writing)
📌 One-sentence highlight: the 15-minute trend has been magnified; before following the trend, decide where to place your stop-loss
Market overview: BTC 82,596.30(-1.52%) · ETH 2,519.88(-1.18%); in the overall market, 62 coins are up / 429 coins are down in the past 24h; 24h top gainer GTC+59.33%, top loser BOME-25.38%.
📅 Data as of 00:52:37 (event trigger times are shown in each entry; prices are real-time snapshots at the time of writing)
📌 One-sentence highlight: the 15-minute trend has been magnified; before following the trend, decide where to place your stop-loss
Market overview: BTC 82,596.30(-1.52%) · ETH 2,519.88(-1.18%); in the overall market, 62 coins are up / 429 coins are down in the past 24h; 24h top gainer GTC+59.33%, top loser BOME-25.38%.
5
·
--
CTK Surges 8.1% in 5 Minutes! What Happened? Key Levels Here16:16 (25 minutes ago): CTK surged 8.1% in five minutes (5-minute window: 16:11→16:16). As of 16:42:24, its current price is 0.1286, down 3.7% over 24h. DOS and RVN also made notable moves around the same time.
📅 Data as of 16:42:24 (event trigger times are noted for each item; prices are real-time snapshots taken when this was written)
📌 In a nutshell: Short-term momentum is concentrated, and pullbacks can come quickly—placing staggered limit orders is steadier than chasing a rally.
Market overview: BTC 83,670.70 (+0.75%) · ETH 2,557.91 (+2.31%); across the market, 237 assets rose and 251 fell in 24h; top 24h gainer: W +69.41%, top loser: LUMIA -33.84%.
CTK Surges 8.1% in 5 Minutes! What Happened? Key Levels Here
16:16 (25 minutes ago): CTK surged 8.1% in five minutes (5-minute window: 16:11→16:16). As of 16:42:24, its current price is 0.1286, down 3.7% over 24h. DOS and RVN also made notable moves around the same time.
📅 Data as of 16:42:24 (event trigger times are noted for each item; prices are real-time snapshots taken when this was written)
📌 In a nutshell: Short-term momentum is concentrated, and pullbacks can come quickly—placing staggered limit orders is steadier than chasing a rally.
Market overview: BTC 83,670.70 (+0.75%) · ETH 2,557.91 (+2.31%); across the market, 237 assets rose and 251 fell in 24h; top 24h gainer: W +69.41%, top loser: LUMIA -33.84%.
📅 Data as of 16:42:24 (event trigger times are noted for each item; prices are real-time snapshots taken when this was written)
📌 In a nutshell: Short-term momentum is concentrated, and pullbacks can come quickly—placing staggered limit orders is steadier than chasing a rally.
Market overview: BTC 83,670.70 (+0.75%) · ETH 2,557.91 (+2.31%); across the market, 237 assets rose and 251 fell in 24h; top 24h gainer: W +69.41%, top loser: LUMIA -33.84%.
67
·
--
ZEST surges 5.0% in 5 minutes! What happened? Key levels hereAt 11:25 (22 minutes ago), ZEST surged 5.0% within 5 minutes (5-minute window 11:20→11:25). As of 11:47:57, the current price is 0.1899, up 4.4% over 24h. IO also saw an unusual move in the same batch.
📅 Data as of 11:47:57 (event trigger times are noted in each item; prices are live snapshots at the time of writing)
📌 In a nutshell: Short-term momentum is concentrated, and pullbacks can come quickly—placing orders in batches is steadier than chasing highs
Market overview: BTC 83,584.50(+0.81%) · ETH 2,543.87(+1.50%); across the market, 369 rose / 122 fell over 24h; top gainer over 24h: W+65.97%, biggest loser: US-39.45%.
ZEST surges 5.0% in 5 minutes! What happened? Key levels here
At 11:25 (22 minutes ago), ZEST surged 5.0% within 5 minutes (5-minute window 11:20→11:25). As of 11:47:57, the current price is 0.1899, up 4.4% over 24h. IO also saw an unusual move in the same batch.
📅 Data as of 11:47:57 (event trigger times are noted in each item; prices are live snapshots at the time of writing)
📌 In a nutshell: Short-term momentum is concentrated, and pullbacks can come quickly—placing orders in batches is steadier than chasing highs
Market overview: BTC 83,584.50(+0.81%) · ETH 2,543.87(+1.50%); across the market, 369 rose / 122 fell over 24h; top gainer over 24h: W+65.97%, biggest loser: US-39.45%.
📅 Data as of 11:47:57 (event trigger times are noted in each item; prices are live snapshots at the time of writing)
📌 In a nutshell: Short-term momentum is concentrated, and pullbacks can come quickly—placing orders in batches is steadier than chasing highs
Market overview: BTC 83,584.50(+0.81%) · ETH 2,543.87(+1.50%); across the market, 369 rose / 122 fell over 24h; top gainer over 24h: W+65.97%, biggest loser: US-39.45%.
1
·
--
ZEST Surges 14% in 15 Minutes! What Happened? Key Levels to WatchAt 10:42 (4 minutes ago), ZEST surged 14% in 15 minutes (15-minute window: 10:27→10:42). As of 10:47:17, its price is 0.2174, up 18.6% in 24h. US and RLC also made notable moves during the same period.
📅 Data as of 10:47:17 (event trigger times are marked on each item; prices are real-time snapshots from when this was written)
📌 In a nutshell: The 15-minute trend has intensified. Before following it, decide where to place your stop-loss.
Market overview: BTC 83,883.40 (+0.96%) · ETH 2,551.61 (+1.58%); across the market, 299 assets rose and 191 fell in 24h; top gainer: W +59.83%, top loser: US -46.91%.
ZEST Surges 14% in 15 Minutes! What Happened? Key Levels to Watch
At 10:42 (4 minutes ago), ZEST surged 14% in 15 minutes (15-minute window: 10:27→10:42). As of 10:47:17, its price is 0.2174, up 18.6% in 24h. US and RLC also made notable moves during the same period.
📅 Data as of 10:47:17 (event trigger times are marked on each item; prices are real-time snapshots from when this was written)
📌 In a nutshell: The 15-minute trend has intensified. Before following it, decide where to place your stop-loss.
Market overview: BTC 83,883.40 (+0.96%) · ETH 2,551.61 (+1.58%); across the market, 299 assets rose and 191 fell in 24h; top gainer: W +59.83%, top loser: US -46.91%.
📅 Data as of 10:47:17 (event trigger times are marked on each item; prices are real-time snapshots from when this was written)
📌 In a nutshell: The 15-minute trend has intensified. Before following it, decide where to place your stop-loss.
Market overview: BTC 83,883.40 (+0.96%) · ETH 2,551.61 (+1.58%); across the market, 299 assets rose and 191 fell in 24h; top gainer: W +59.83%, top loser: US -46.91%.
·
--
ERA Surges 4.0% in 5 Minutes! What Happened? Key Levels Here13:03 (7 minutes ago) ERA surged 4.0% within 5 minutes (5-minute window: 12:58→13:03). As of 13:11:11, the current price is 0.08174, up 21.9% over 24h. Other tokens showing unusual moves in the same batch include LUMIA and TIA.
📅 Data as of 13:11:11 (see the annotations for each item for event trigger times; prices are real-time snapshots taken at the time of writing)
📌 In a nutshell: Short-term momentum is concentrated, and pullbacks can come quickly—placing staggered limit orders is safer than chasing prices higher.
Market overview: BTC 82,999.90(+0.42%) · ETH 2,506.27(+0.50%); across the market, 194 assets rose and 294 fell in 24h; top gainer over 24h: LUMIA +84.50%; top loser: MAGIC -35.12%.
ERA Surges 4.0% in 5 Minutes! What Happened? Key Levels Here
13:03 (7 minutes ago) ERA surged 4.0% within 5 minutes (5-minute window: 12:58→13:03). As of 13:11:11, the current price is 0.08174, up 21.9% over 24h. Other tokens showing unusual moves in the same batch include LUMIA and TIA.
📅 Data as of 13:11:11 (see the annotations for each item for event trigger times; prices are real-time snapshots taken at the time of writing)
📌 In a nutshell: Short-term momentum is concentrated, and pullbacks can come quickly—placing staggered limit orders is safer than chasing prices higher.
Market overview: BTC 82,999.90(+0.42%) · ETH 2,506.27(+0.50%); across the market, 194 assets rose and 294 fell in 24h; top gainer over 24h: LUMIA +84.50%; top loser: MAGIC -35.12%.
📅 Data as of 13:11:11 (see the annotations for each item for event trigger times; prices are real-time snapshots taken at the time of writing)
📌 In a nutshell: Short-term momentum is concentrated, and pullbacks can come quickly—placing staggered limit orders is safer than chasing prices higher.
Market overview: BTC 82,999.90(+0.42%) · ETH 2,506.27(+0.50%); across the market, 194 assets rose and 294 fell in 24h; top gainer over 24h: LUMIA +84.50%; top loser: MAGIC -35.12%.
3
·
--
OGN surged 12% in 15 minutes! What happened? Key levels here16:08 (just now) OGN saw a 12% surge within 15 minutes (15-minute window 15:53→16:08). As of 16:08:39, the current price is 0.04091, with 24h +6.2%. Other assets in the same batch of unusual activity include ARPA and CAP.
📅 Data updated as of 16:08:39 (event trigger times are shown in each note; prices are real-time snapshots at the time of writing)
📌 One-sentence takeaway: the 15-minute trend has been amplified; before following the trend, decide where your stop-loss will be placed
Market overview: BTC 82,784.40(+0.22%) · ETH 2,495.59(-0.23%); across the market, 346 assets are up / 144 are down in 24h; top 24h gainer LUMIA+53.73%, top loser SENT-16.35%.
OGN surged 12% in 15 minutes! What happened? Key levels here
16:08 (just now) OGN saw a 12% surge within 15 minutes (15-minute window 15:53→16:08). As of 16:08:39, the current price is 0.04091, with 24h +6.2%. Other assets in the same batch of unusual activity include ARPA and CAP.
📅 Data updated as of 16:08:39 (event trigger times are shown in each note; prices are real-time snapshots at the time of writing)
📌 One-sentence takeaway: the 15-minute trend has been amplified; before following the trend, decide where your stop-loss will be placed
Market overview: BTC 82,784.40(+0.22%) · ETH 2,495.59(-0.23%); across the market, 346 assets are up / 144 are down in 24h; top 24h gainer LUMIA+53.73%, top loser SENT-16.35%.
📅 Data updated as of 16:08:39 (event trigger times are shown in each note; prices are real-time snapshots at the time of writing)
📌 One-sentence takeaway: the 15-minute trend has been amplified; before following the trend, decide where your stop-loss will be placed
Market overview: BTC 82,784.40(+0.22%) · ETH 2,495.59(-0.23%); across the market, 346 assets are up / 144 are down in 24h; top 24h gainer LUMIA+53.73%, top loser SENT-16.35%.
10
·
--
MAGIC surges 6.7%! Is it worth chasing this kind of sharp rally?22:50 (just now): MAGIC surged 6.7% at a key time (5-minute window: 22:45→22:50). As of 22:50:46, its price is 0.08684, up 32.7% over 24h. HEI and BULLA also saw moves in the same batch.
📅 Data as of 22:50:46 (event trigger times are noted for each item; prices are live snapshots from the time of writing)
📌 In a nutshell: Moves around key times (candle closes/US market open and close) often involve institutional participation, making their signals more credible.
Market overview: BTC 82,938.80(+0.36%) · ETH 2,488.59(-1.65%); across the market, 106 assets rose and 291 fell over 24h; top gainer: US +120.26%; top loser: SENT -15.31%.
MAGIC surges 6.7%! Is it worth chasing this kind of sharp rally?
22:50 (just now): MAGIC surged 6.7% at a key time (5-minute window: 22:45→22:50). As of 22:50:46, its price is 0.08684, up 32.7% over 24h. HEI and BULLA also saw moves in the same batch.
📅 Data as of 22:50:46 (event trigger times are noted for each item; prices are live snapshots from the time of writing)
📌 In a nutshell: Moves around key times (candle closes/US market open and close) often involve institutional participation, making their signals more credible.
Market overview: BTC 82,938.80(+0.36%) · ETH 2,488.59(-1.65%); across the market, 106 assets rose and 291 fell over 24h; top gainer: US +120.26%; top loser: SENT -15.31%.
📅 Data as of 22:50:46 (event trigger times are noted for each item; prices are live snapshots from the time of writing)
📌 In a nutshell: Moves around key times (candle closes/US market open and close) often involve institutional participation, making their signals more credible.
Market overview: BTC 82,938.80(+0.36%) · ETH 2,488.59(-1.65%); across the market, 106 assets rose and 291 fell over 24h; top gainer: US +120.26%; top loser: SENT -15.31%.
79

·
--
We're excited to share the latest trending tokens on CoinGecko 🚀. Our community is always looking for new and exciting projects to explore. We're seeing a mix of established and newer tokens gaining traction, with market cap ranks ranging from #1 to #583.
Tokens like Bitcoin (BTC) and Solana (SOL) are holding strong, while others like Taiko (TAIKO) and Morpho (MORPHO) are making waves 🌟. We're also seeing notable market cap ranks from Lighter (LIT) at #102 and Venice Token (VVV) at #92.
We're confident that our community will find value in these trending tokens 💡. As we continue to monitor the market, we're eager to see how these tokens will perform in the future 📈.
$POND, $TLM, $TAIKO
We're excited to share the latest trending tokens on CoinGecko 🚀. Our community is always looking for new and exciting projects to explore. We're seeing a mix of established and newer tokens gaining traction, with market cap ranks ranging from #1 to #583.
Tokens like Bitcoin (BTC) and Solana (SOL) are holding strong, while others like Taiko (TAIKO) and Morpho (MORPHO) are making waves 🌟. We're also seeing notable market cap ranks from Lighter (LIT) at #102 and Venice Token (VVV) at #92.
We're confident that our community will find value in these trending tokens 💡. As we continue to monitor the market, we're eager to see how these tokens will perform in the future 📈.
$POND, $TLM , $TAIKO
Tokens like Bitcoin (BTC) and Solana (SOL) are holding strong, while others like Taiko (TAIKO) and Morpho (MORPHO) are making waves 🌟. We're also seeing notable market cap ranks from Lighter (LIT) at #102 and Venice Token (VVV) at #92.
We're confident that our community will find value in these trending tokens 💡. As we continue to monitor the market, we're eager to see how these tokens will perform in the future 📈.
$POND, $TLM , $TAIKO
25

·
--
BLESS LEADS THE CHARGE AMONG TOP GAINERS TODAY 🚀💸
The $BLESS price is experiencing a significant uptrend, driven by a surge in macro asset accumulation and a successful breach of a key order block resistance level 🚀. This move is further reinforced by the coin's ability to hold above the mid-range zone of ~$0.01394, indicating a shift in market sentiment towards $BLESS 📈. Momentum is accelerating, with $BLESS price action showing signs of continuation 📊.
The current price of $0.01772 represents a 24-hour change of 82.49%, with $414.53M in 24-hour volume, suggesting strong bullish momentum 📈. As $BLESS continues to trend on CoinGecko, ranking #583, it is likely that the coin will attract more attention from retail investors, potentially driving the price higher 🚀.
Levels to monitor:
Watching support around $0.009708
Structure suggests resistance near $0.01812
Mid range area: $0.01394
DYOR
Follow for Updates
#BLESS #GENERAL_ALTCOIN #CryptoTrending #BinanceSquare
BLESS LEADS THE CHARGE AMONG TOP GAINERS TODAY 🚀💸
The $BLESS price is experiencing a significant uptrend, driven by a surge in macro asset accumulation and a successful breach of a key order block resistance level 🚀. This move is further reinforced by the coin's ability to hold above the mid-range zone of ~$0.01394, indicating a shift in market sentiment towards $BLESS 📈. Momentum is accelerating, with $BLESS price action showing signs of continuation 📊.
The current price of $0.01772 represents a 24-hour change of 82.49%, with $414.53M in 24-hour volume, suggesting strong bullish momentum 📈. As $BLESS continues to trend on CoinGecko, ranking #583, it is likely that the coin will attract more attention from retail investors, potentially driving the price higher 🚀.
Levels to monitor:
Watching support around $0.009708
Structure suggests resistance near $0.01812
Mid range area: $0.01394
DYOR
Follow for Updates
#BLESS #GENERAL_ALTCOIN #CryptoTrending #BinanceSquare
The $BLESS price is experiencing a significant uptrend, driven by a surge in macro asset accumulation and a successful breach of a key order block resistance level 🚀. This move is further reinforced by the coin's ability to hold above the mid-range zone of ~$0.01394, indicating a shift in market sentiment towards $BLESS 📈. Momentum is accelerating, with $BLESS price action showing signs of continuation 📊.
The current price of $0.01772 represents a 24-hour change of 82.49%, with $414.53M in 24-hour volume, suggesting strong bullish momentum 📈. As $BLESS continues to trend on CoinGecko, ranking #583, it is likely that the coin will attract more attention from retail investors, potentially driving the price higher 🚀.
Levels to monitor:
Watching support around $0.009708
Structure suggests resistance near $0.01812
Mid range area: $0.01394
DYOR
Follow for Updates
#BLESS #GENERAL_ALTCOIN #CryptoTrending #BinanceSquare
138
Log in to explore more content
Join global crypto users on Binance Square
⚡️ Get latest and useful information about crypto.
💬 Trusted by the world’s largest crypto exchange.
👍 Discover real insights from verified creators.
Email / Phone number
Trending Topics
1
#BinanceReopensWithdrawalsForMoreAssets
22,628 views
644 Discussing
2
#AppleReportsMixedResults
15,279 views
480 Discussing
3
#BinanceHourlyDepositsExceedWithdrawals
3,717 views
154 Discussing
4
#PalantirSlides3PercentOn$2BRevenue
181 views
9 Discussing
5
#USMidtermElections
716,460 views
3,887 Discussing
6
#USOctoberNFP-AreRateCutsStillPossible
111,445 views
925 Discussing
7
#Verify1to1BinanceReserves
100,179 views
688 Discussing
8
#SBIFirstHalfCryptoRevenueFalls30.1%
574 views
19 Discussing
9
#NEARVoteApprovesCutInMaxAnnualIssuanceTo1.6%
4,153 views
31 Discussing
10
#BinanceRestores28FiatWithdrawals
251,758 views
1,353 Discussing