

#3
3
960,865 views
2,827 Discussing
Hot
Latest

·
--
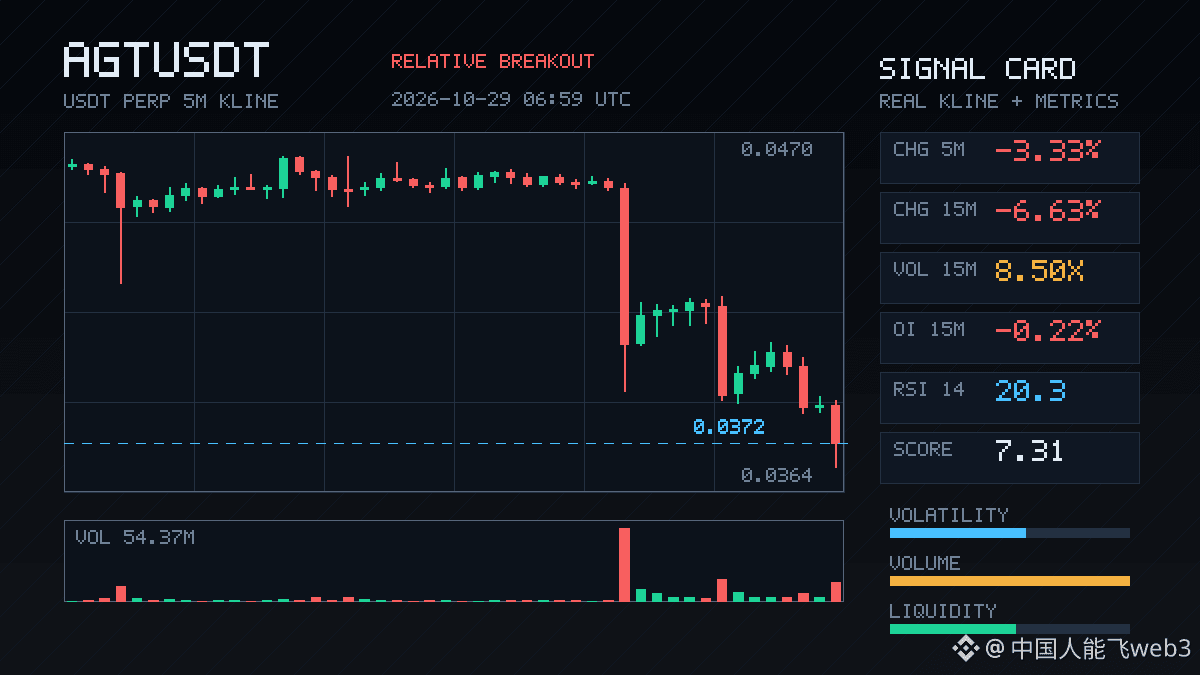
$AGT dropped 6.63% in just 15 minutes, on 8.5x volume, and closed below the lower end of its recent 20-bar 5m range. Aggressive trade delta was -18%, the buy/sell ratio was 0.70, and the selling pressure is real. OI edged down over 15m, with notional down 711K, while hourly notional fell 4.5%. The structure clearly points to longs deleveraging or getting stopped out—not fresh shorts opening. The anomaly percentile is 96.2%, ranking #3 across the entire pool. 24h volume is 36M. With this much volume behind the selloff and no sign of buying support yet, don’t rush to buy the dip.
$AGT dropped 6.63% in just 15 minutes, on 8.5x volume, and closed below the lower end of its recent 20-bar 5m range. Aggressive trade delta was -18%, the buy/sell ratio was 0.70, and the selling pressure is real. OI edged down over 15m, with notional down 711K, while hourly notional fell 4.5%. The structure clearly points to longs deleveraging or getting stopped out—not fresh shorts opening. The anomaly percentile is 96.2%, ranking #3 across the entire pool. 24h volume is 36M. With this much volume behind the selloff and no sign of buying support yet, don’t rush to buy the dip.

·
--
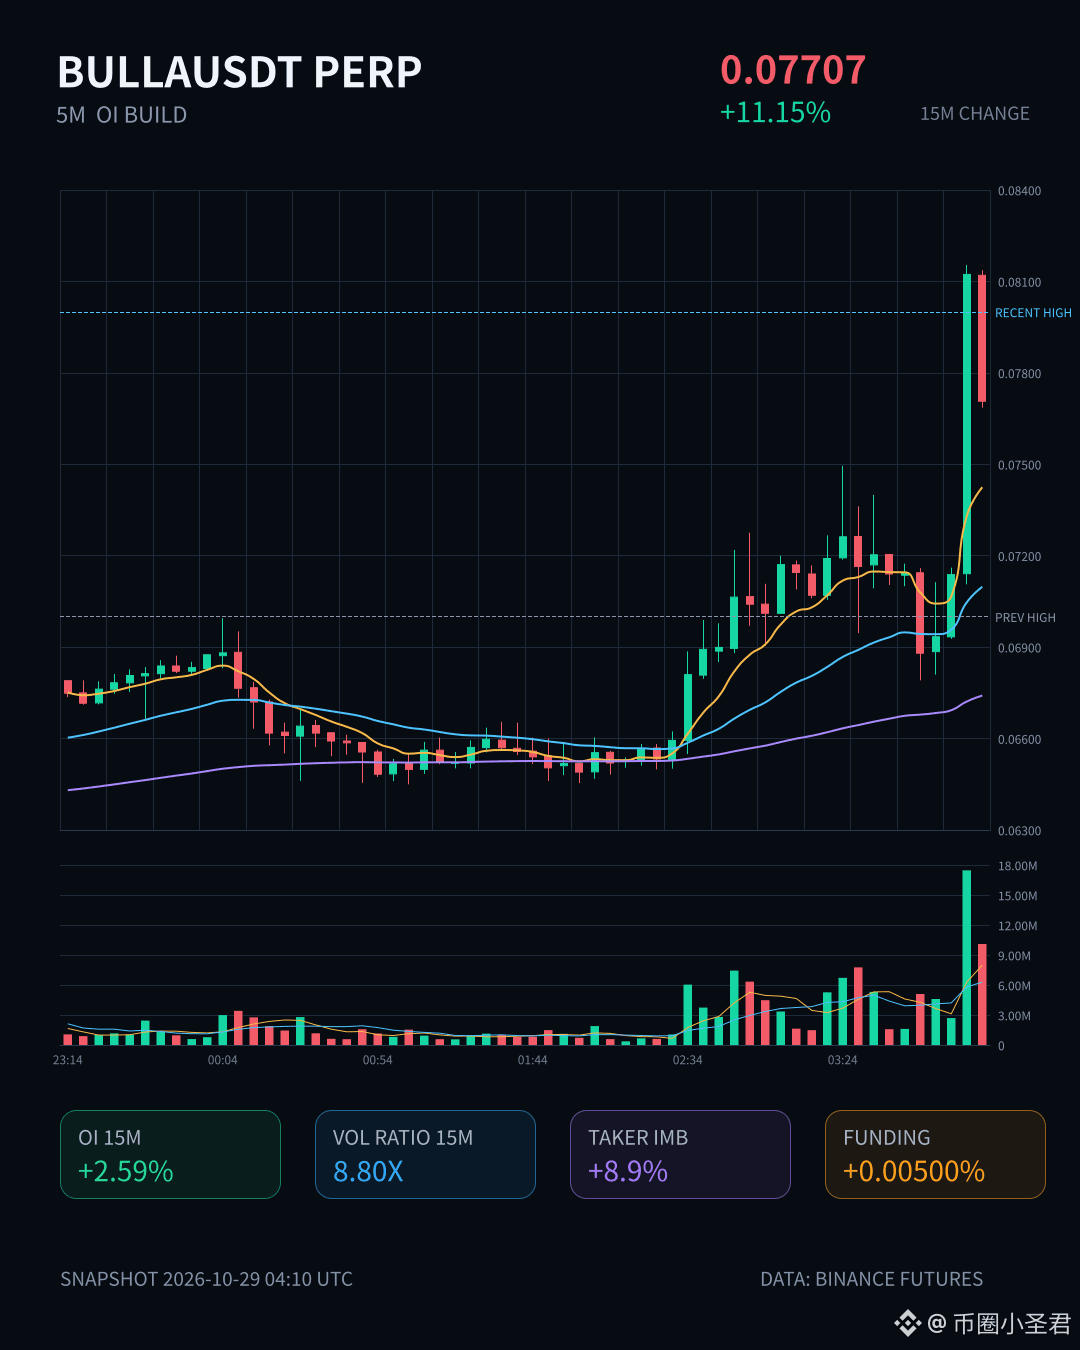
$BULLA These 15 minutes have been intense: the price jumped 11 points, volume surged to 8.8x, and OI moved up in tandem. 15-minute futures open interest rose 2.59%, with a notional change of 1.57M; the 1-hour figure is also climbing. This pattern of rising prices and rising open interest looks more like new leveraged longs entering the market than a simple short squeeze.
OI's anomaly percentile is 96%, ranking #4 across the entire pool, while the notional change ranks #3. It's already hugging the extreme end of its historical range. The taker buy/sell ratio is 1.20, with a taker volume delta of 8.9%—buyers are firmly in control. The 24-hour trading volume is 93M, and market depth confirms that volume is above normal.
At these levels, be careful about chasing longs as leverage builds up and raises the risk of a squeeze. If you haven't gotten in, don't rush into FOMO either—first see whether this wave of new long positions can hold.
1

·
--
$EVAA just put on a strong showing over the past 24 hours, climbing +29.8% to secure the #3 spot among Binance Futures perpetual markets. Moves of this size show real capital shifting into the asset, but the real test is whether current interest can hold steady.
• Price is sitting at $1.4381 after the sharp push.
• 24h volume hit $534.3M, running flat at 0.0x compared to the 7-day average.
• Funding rate stands at +0.036%, showing balanced positioning between longs and shorts.
Watch how price behaves around these levels to see if momentum can sustain itself without fresh volume expansion.
Are you expecting a continuation or a cooling-off period here?
⚠️ Data-driven analysis, not financial advice. DYOR.
103
·
--
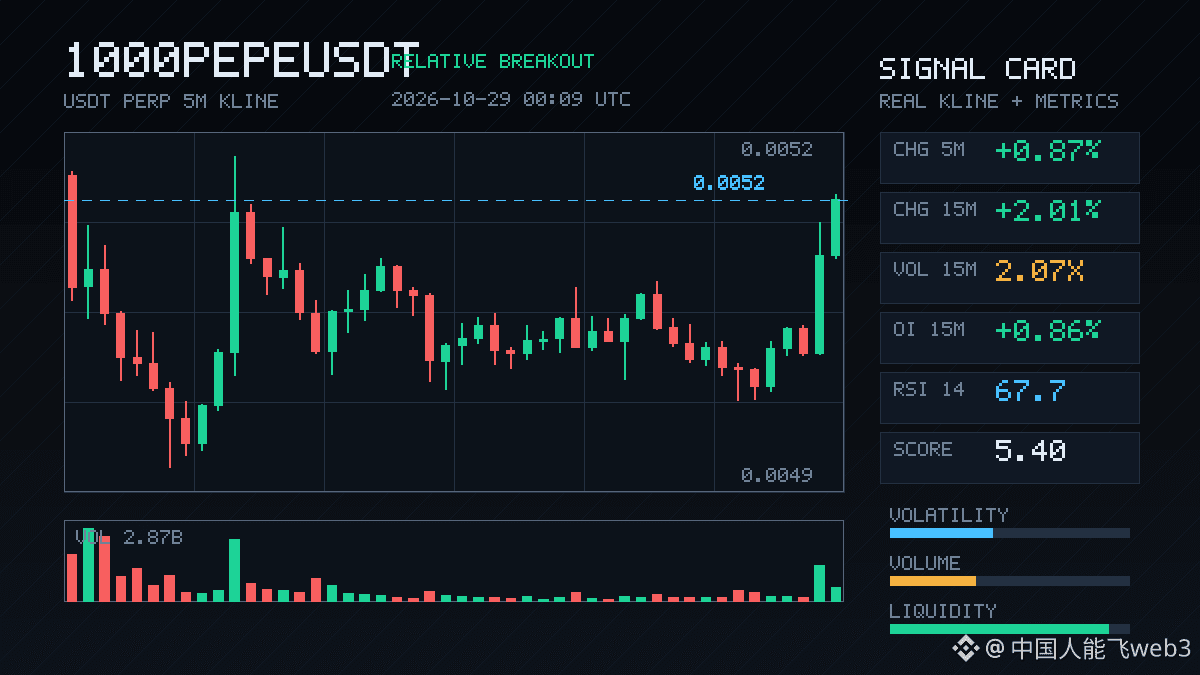
$1000PEPE is showing some serious action. It’s up 2% over 15m, with volume surging to more than 2x its usual level. Crucially, OI is rising in tandem—up 0.86% over both 15m and 1h, with over $2 million in notional value flowing in. This doesn’t look like short covering; it looks more like new leveraged longs actively building positions.
Price just closed above the upper end of the last 20 or so 5m candles. Active trade delta is +8.4%, and the buy/sell ratio is 1.18, showing buyers are in control. OI’s abnormality percentile is 95.6%, ranking #3 across the entire pool—an unusually strong move even compared with the rest of the market.
24h trading volume is $540 million, and liquidity is solid. This kind of price, volume, and OI moving together could be a sign of a breakout—or a one-off pump designed to lure in buyers. Watch whether price can hold above the top of this range. Whether to chase it is up to you—don’t get carried away.
25

·
--

Article
Cryptocurrency System (1): A Simple Understanding of Bitcoin’s MechanismsIf you want to pursue arbitrage related to DEXs (such as cross-chain arbitrage, DeFi, or DEX/CEX arbitrage), a thorough understanding of on-chain protocols is essential. This series starts with classic Bitcoin and explains the protocols behind mainstream chains, from the basics to more advanced concepts.
When you transfer money to someone through a banking app, the most obvious result is that both parties’ balances change. What makes this possible is the ledger maintained by the bank: who paid how much and who received how much. Bitcoin also aims to keep a ledger; the challenge is that it has no bank.
In this scenario, we can start by asking a simpler question: What problems must a ledger system solve? How do banks solve them? If we remove the bank, which problems can still be solved, and which ones get stuck? Blockchain was designed precisely for the problems that get stuck. Once we’ve clarified the concepts, we’ll use pseudocode to build a toy blockchain and fully understand Bitcoin’s core mechanisms.
Cryptocurrency System (1): A Simple Understanding of Bitcoin’s Mechanisms
If you want to pursue arbitrage related to DEXs (such as cross-chain arbitrage, DeFi, or DEX/CEX arbitrage), a thorough understanding of on-chain protocols is essential. This series starts with classic Bitcoin and explains the protocols behind mainstream chains, from the basics to more advanced concepts.
When you transfer money to someone through a banking app, the most obvious result is that both parties’ balances change. What makes this possible is the ledger maintained by the bank: who paid how much and who received how much. Bitcoin also aims to keep a ledger; the challenge is that it has no bank.
In this scenario, we can start by asking a simpler question: What problems must a ledger system solve? How do banks solve them? If we remove the bank, which problems can still be solved, and which ones get stuck? Blockchain was designed precisely for the problems that get stuck. Once we’ve clarified the concepts, we’ll use pseudocode to build a toy blockchain and fully understand Bitcoin’s core mechanisms.
168

·
--
🔥 $XRP $BTC $ETH Ripple Wins US Bank License Boosting XRP Ecosystem | #️⃣ Trending #3
📌 Key facts:
• The OCC granted Ripple final approval to establish Ripple National Trust Bank, enabling federally regulated management of RLUSD reserves and...
• Ripple expanded partnerships with BNY Mellon and Robinhood, while Moody's awarded RLUSD an A2/P-1 rating, pushing RLUSD market cap past $2.6...
📊 Market analysis & trading logic:
When a trending topic hits, the market typically prices it in within 24-48 hours. The edge isn't in the news itself — it's in positioning before the crowd reacts. My approach: identify the narrative, check on-chain data for confirmation, and enter when the risk-reward favors the contrarian side. Avoid FOMO entries after the initial pump.
Would love to hear from @RektCapital and @CryptoCapo on this 🔥
🔍 Trending searches: MINA | NEAR | BANK | DOGE | LTC
💬 What's your price target for this? Let's debate 👇
👉 Follow me for daily alpha — quality over quantity, always with analysis!
💬 Comment your thoughts — I reply to everyone!
#XRP #Ripple #Crypto #Blockchain
179
·
--
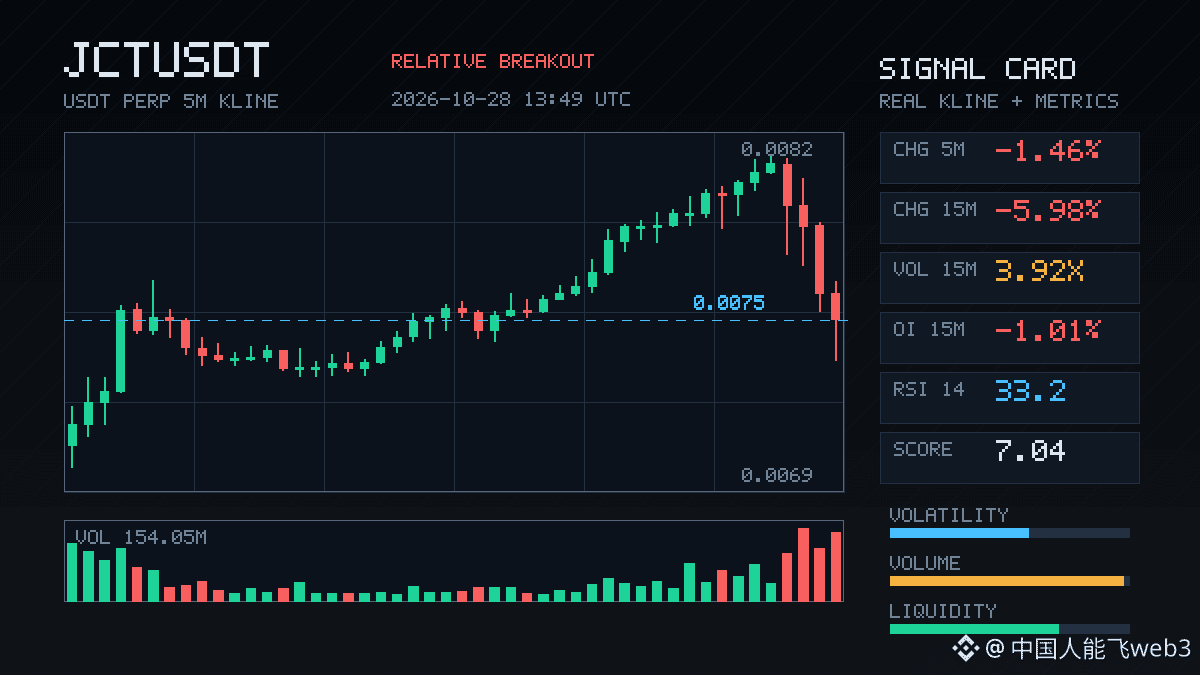
$JCT This sell-off was pretty decisive: down 5.98% in 15m, with volume hitting 3.92 times normal levels, and the close breaking below the lows of the last 20 or so 5m candles. But the interesting thing is that OI is falling too—15m contracts down 1.01%, notional down 2.61M, and 1h notional down 1.29M. This looks more like longs deleveraging and stop-losses getting swept than fresh shorts piling in to drive the price down.
The OI anomaly percentile is 96.4%, ranking #5 across the pool for anomalies and #3 for notional change. It’s been carrying through for several consecutive periods, and order book depth confirms it too. The taker volume delta is -5.6%, with a buy/sell ratio of 0.89. There’s real selling pressure, but positions are shrinking.
With this kind of setup, I generally wouldn’t rush to chase shorts. Once leverage has been cleared out, a bounce becomes more likely. First, let’s see whether price can reclaim the lower end of this range. If it can’t, then we’ll reassess.

·
--
🔥 BINANCE TOP 3 PUMPS - TODAY 28 OCT 2026 🔥BTC $80,882 on Binance Spot (+1.58%) - Back above $80K before FED! 🚀
#1 $AIN +121% on Binance Spot 🤯 Trending #1 on Binance Square
#2 $BTW (Bitway) +45.23% 💥 Spot gainer
#3 $IRYS +200.98% on Binance Futures - Crazy move ⚡
Bonus Binance Gainers:
$BTR +52.22% Futures
$ACU +23.73%
$HAEDAL setup - Entry $0.02863 TP $0.0445
Market: 92% GREEN, Shorts liquidated $74M, Longs $25M
Trade on Binance now? Use low leverage before Fed 2 PM ET!
#✓
{future}(AINUSDT)
{future}(BTWUSDT)
{future}(IRYSUSDT)
🔥 BINANCE TOP 3 PUMPS - TODAY 28 OCT 2026 🔥
BTC $80,882 on Binance Spot (+1.58%) - Back above $80K before FED! 🚀
#1 $AIN +121% on Binance Spot 🤯 Trending #1 on Binance Square
#2 $BTW (Bitway) +45.23% 💥 Spot gainer
#3 $IRYS +200.98% on Binance Futures - Crazy move ⚡
Bonus Binance Gainers:
$BTR +52.22% Futures
$ACU +23.73%
$HAEDAL setup - Entry $0.02863 TP $0.0445
Market: 92% GREEN, Shorts liquidated $74M, Longs $25M
Trade on Binance now? Use low leverage before Fed 2 PM ET!
#✓
1
859

·
--
$GRASS This drop is interesting—the price broke below the lows of the past 20 five-minute candles, volume surged to 1.74x, but OI fell 0.46% in an hour, with notional value shrinking by 370,000 U. This is a classic case of price falling as positions are closed: longs are cutting their own exposure, rather than shorts mounting a strong attack.
The aggressive trade delta is still +13.2%, and the buy/sell ratio is 1.30. Buying actually picked up during the drop. Given that OI is at an unusually high 96th percentile, this divergence looks more like positions changing hands amid leveraged traders being flushed out than a one-way collapse. Funding rates are still in a high recent percentile, suggesting plenty of longs piled in earlier. It ranks #3 for anomalies across the entire pool, and 24-hour volume of 26.9M isn't particularly high—this is exactly the kind of level where false breakouts are most likely.
First, let's see whether this deleveraging move can hold below the bottom of the range. If it can't, then we'll reassess.
·
--
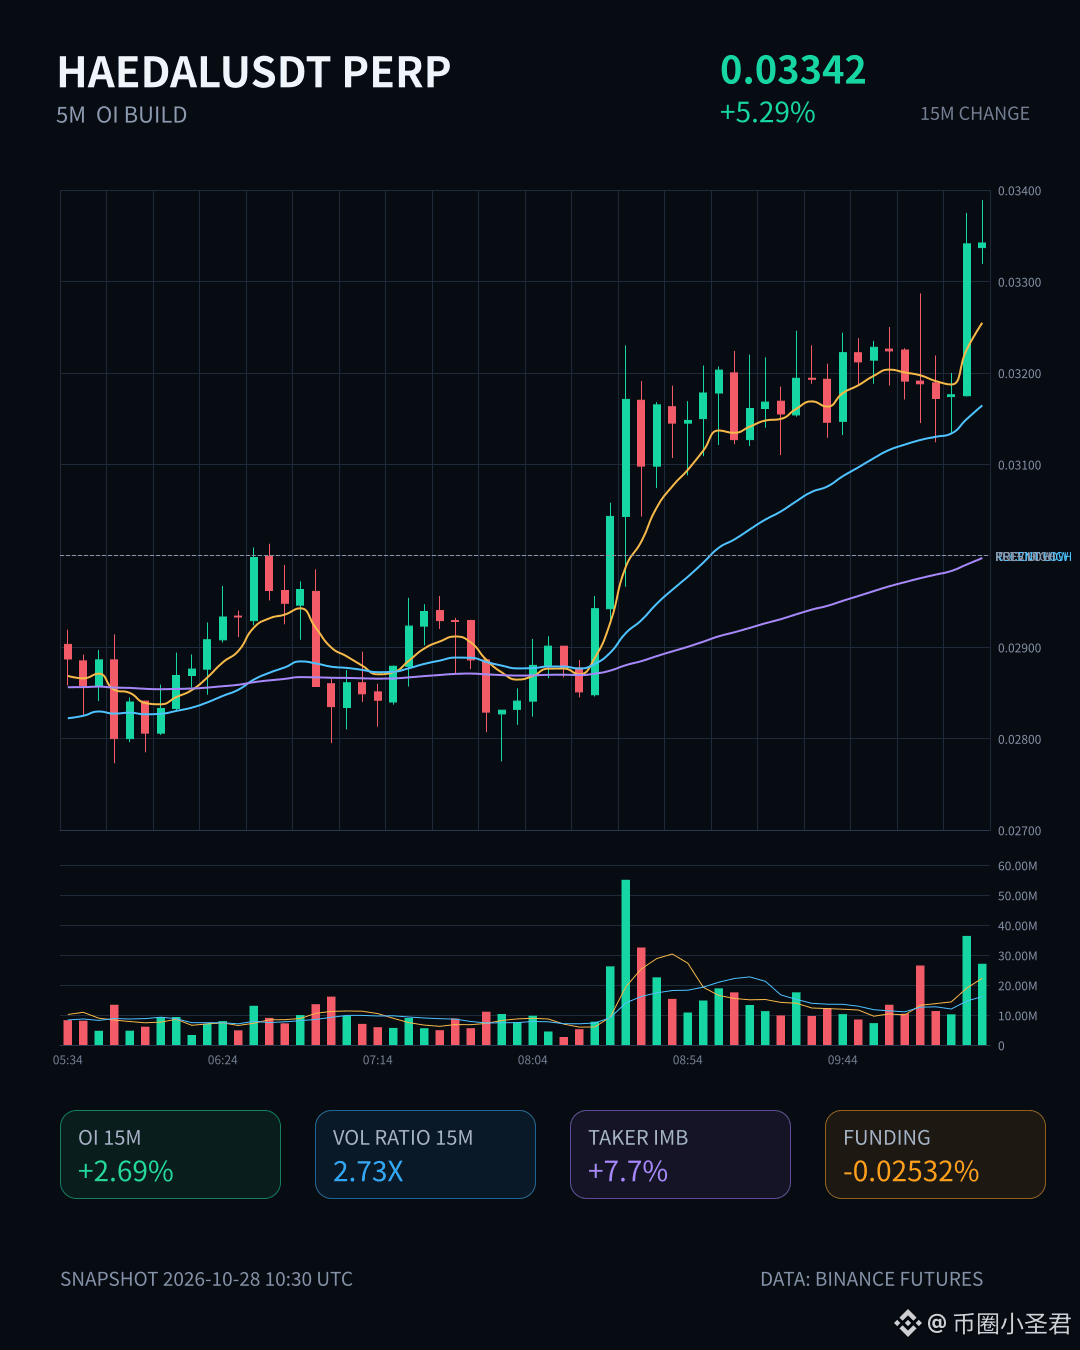
$HAEDAL This 15-minute move is a bit too sharp: up 5.29%, with volume at 2.73x. OI rose 4.41% in an hour and 2.69% over 15 minutes, strongly suggesting new leveraged longs are entering. OI is at the 96th percentile for abnormal activity, ranking #3 across the entire pool, and notional change is also near the top. The funding rate has reached a high percentile recently. The taker buy/sell ratio is 1.17—bullish, but not extreme. This kind of setup can easily get pushed further in the trend’s direction, but leverage is piling up quickly, so pullbacks can come just as fast. Be cautious about chasing highs.
$HAEDAL This 15-minute move is a bit too sharp: up 5.29%, with volume at 2.73x. OI rose 4.41% in an hour and 2.69% over 15 minutes, strongly suggesting new leveraged longs are entering. OI is at the 96th percentile for abnormal activity, ranking #3 across the entire pool, and notional change is also near the top. The funding rate has reached a high percentile recently. The taker buy/sell ratio is 1.17—bullish, but not extreme. This kind of setup can easily get pushed further in the trend’s direction, but leverage is piling up quickly, so pullbacks can come just as fast. Be cautious about chasing highs.

·
--
$1000PEPE’s move is pretty interesting. The price is up 1.51%—not a huge jump—but OI is up +2.12% over 15m and +2.84% over 1h. Its anomaly percentile has hit 98.6%, ranking #3 across the entire pool. Leveraged longs are piling in, adding exposure over several consecutive periods. Volume is 2.43× normal, with a buy/sell ratio of 1.30, showing a clear bias toward aggressive buying. This setup could be the prelude to a new leg up, or a warning sign that longs are dangerously crowded. It’s nearing historical extremes, so be cautious about chasing the rally—you don’t want to be the last one in.
$1000PEPE’s move is pretty interesting. The price is up 1.51%—not a huge jump—but OI is up +2.12% over 15m and +2.84% over 1h. Its anomaly percentile has hit 98.6%, ranking #3 across the entire pool. Leveraged longs are piling in, adding exposure over several consecutive periods. Volume is 2.43× normal, with a buy/sell ratio of 1.30, showing a clear bias toward aggressive buying. This setup could be the prelude to a new leg up, or a warning sign that longs are dangerously crowded. It’s nearing historical extremes, so be cautious about chasing the rally—you don’t want to be the last one in.
6
·
--
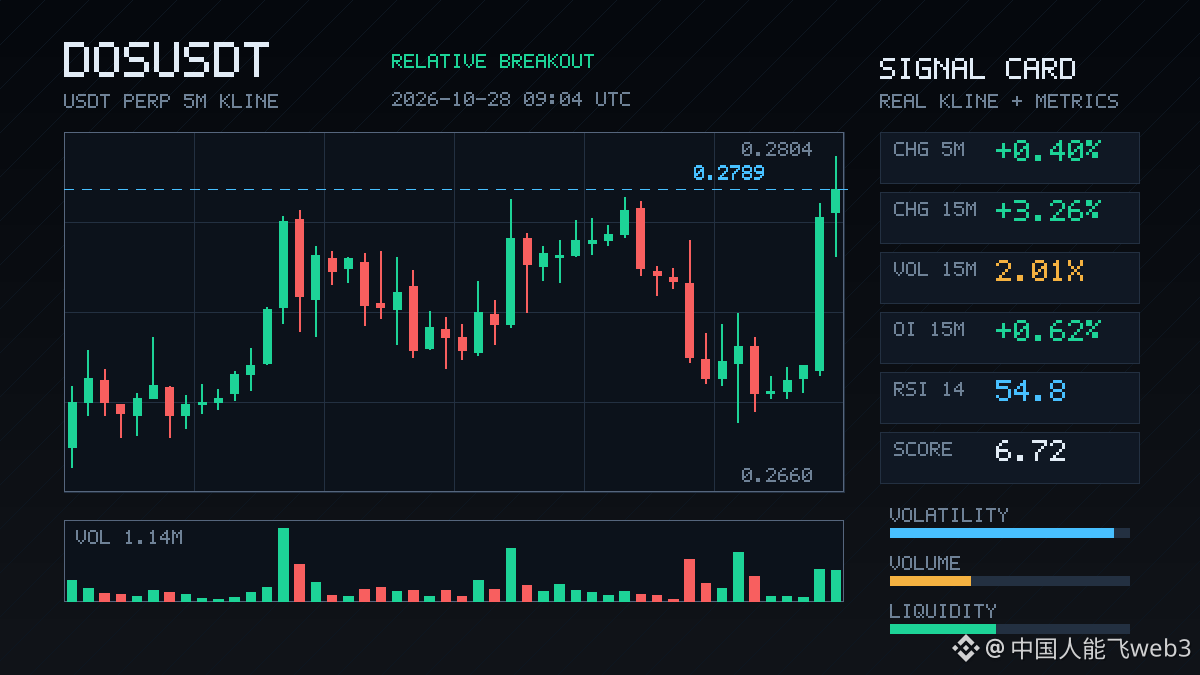
$DOS has something going on here. It surged 3.26% in 15m, with volume reaching 2.01x and the taker buy/sell ratio at 2.84—buyers are clearly rushing in. The key point is that OI also rose 0.62% over 15m, adding a nominal +242K. Price and open interest are moving up together, which looks more like new leveraged longs entering than a hollow short squeeze.
The closing price has broken above the highs of nearly 20 recent 5m candles. OI is at the 99th percentile for unusual readings, ranking #3 across the entire pool—a level this extreme is rare. OI is still slightly down on the 1h timeframe, suggesting this leverage has only just come in and the move is likely to be short-lived and fast-paced.
24h trading volume is just over 20M, and market depth isn't very strong. That makes it easy to push the price up, but pullbacks can be quick too. Watch whether it can hold above the top of this range; if it can't, this may turn out to be a one-off spike.
3

·
--
$AGT is losing momentum pretty quickly 👀
$AGT is currently down 36.31% and falls into the #3 Loser group.
If the price doesn’t reclaim the lost levels soon, each bounce could become another test for buyers.
This is definitely worth keeping an eye on.
$AGT is losing momentum pretty quickly 👀
$AGT is currently down 36.31% and falls into the #3 Loser group.
If the price doesn’t reclaim the lost levels soon, each bounce could become another test for buyers.
This is definitely worth keeping an eye on.
$AGT is currently down 36.31% and falls into the #3 Loser group.
If the price doesn’t reclaim the lost levels soon, each bounce could become another test for buyers.
This is definitely worth keeping an eye on.
1
26
·
--
$EVAA This wave of longs is building up leverage pretty aggressively. Up 3.32% over 15m, with OI rising in tandem by 3.34%; over 1h, it's up even more, by 5.31%. Price and open interest are moving together—a classic sign of leveraged longs building positions, not shorts being squeezed out.
The OI anomaly percentile is 97.2%, ranking #3 across the entire pool. The funding rate is also in a high percentile recently, and this has persisted for several consecutive periods. The aggressive trade delta is 6.8%, with a buy/sell ratio of 1.14, so buyers are definitely applying pressure.
The structure looks fine, but price is already near a historically extreme range. I generally wouldn't chase the first candle at this level; I'd wait to see if OI stops expanding. Either it keeps accelerating upward and breaks away, or a liquidation wick hits—either could happen quickly.
3

·
--
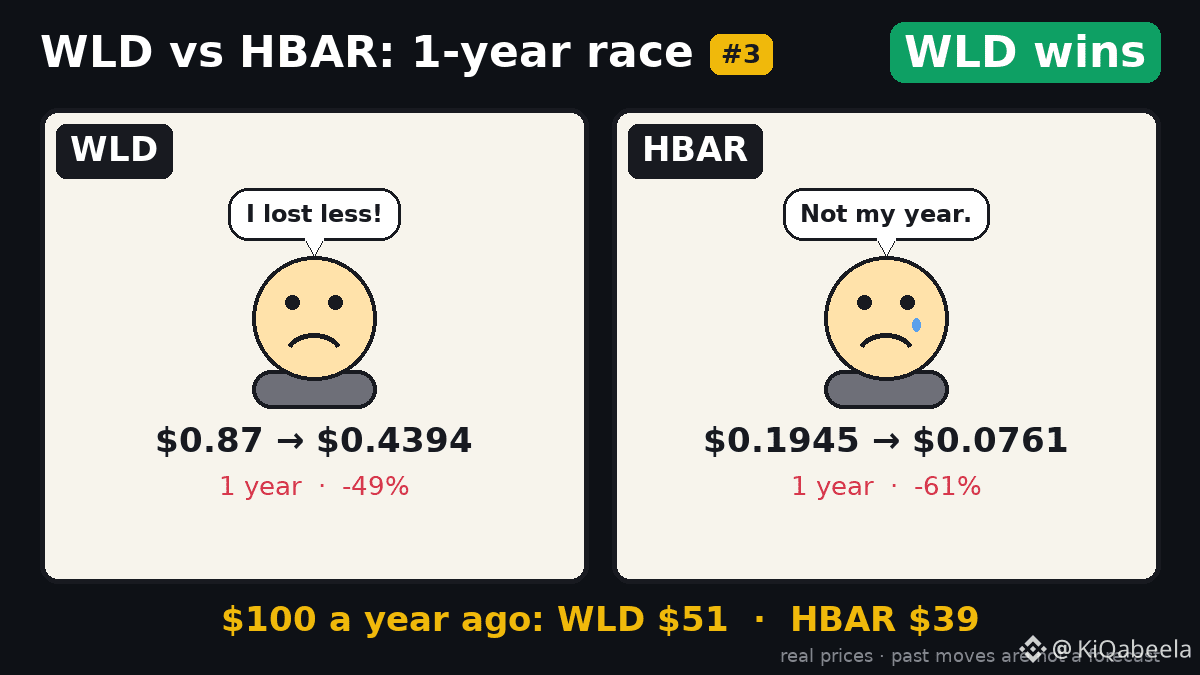
$100 → $51 vs $39: WLD beats HBAR in 2025‑26.
WLD fell 49% to $0.4394, turning a $100 stake into $51. HBAR dropped 61% to $0.0761, leaving $100 at $39. The gap shows WLD held more value over the year.
Past moves say nothing about the next ones.
💬 Which?
🎨 Coin vs Coin #3 · a new one every morning
$WLD
WLD fell 49% to $0.4394, turning a $100 stake into $51. HBAR dropped 61% to $0.0761, leaving $100 at $39. The gap shows WLD held more value over the year.
Past moves say nothing about the next ones.
💬 Which?
🎨 Coin vs Coin #3 · a new one every morning
$WLD
36
·
--
$HAEDAL is making a serious move. It surged 15% in 15 minutes, with volume expanding to 4.25x and a Z-score of 6.22—this is no ordinary intraday spike. OI is rising in tandem: +2.27% over 15 minutes and +2.58% over 1 hour. Notional change is also near the top, with an anomaly percentile of 98%, ranking #3 across the entire pool. This looks more like fresh leveraged longs driving the move than shorts covering. Price closed above the range of the last 20 five-minute candles; aggressive trade imbalance is 23.2%, and the buy/sell ratio is 1.60, showing a clear directional bias. 24-hour trading volume is 87.91M, and depth is keeping pace. Whether or not to chase is another question, but this is worth keeping an eye on—don’t wait for a pullback to ask what happened.
$HAEDAL is making a serious move. It surged 15% in 15 minutes, with volume expanding to 4.25x and a Z-score of 6.22—this is no ordinary intraday spike. OI is rising in tandem: +2.27% over 15 minutes and +2.58% over 1 hour. Notional change is also near the top, with an anomaly percentile of 98%, ranking #3 across the entire pool. This looks more like fresh leveraged longs driving the move than shorts covering. Price closed above the range of the last 20 five-minute candles; aggressive trade imbalance is 23.2%, and the buy/sell ratio is 1.60, showing a clear directional bias. 24-hour trading volume is 87.91M, and depth is keeping pace. Whether or not to chase is another question, but this is worth keeping an eye on—don’t wait for a pullback to ask what happened.
3
·
--
$CT This 15m surge of 3.49% on 4.1x volume is pretty interesting. The key is that OI has been anomalous across multiple consecutive periods: +1.07% over 15m and +1.14% over 1h. Notional changes were around 3% in both periods, placing it at the 95.8th percentile and anomaly #3 across the entire pool. Price rising alongside OI is a textbook sign of new leveraged longs entering—not the sort of false heat you get from short covering.
Price has already broken above the top of the range from nearly 20 recent 5m candles. The aggressive trade differential is 1.7%, and the buy/sell ratio is 1.03: buyers have a slight edge, but nothing close to an imbalance. 24h trading volume is 40.9M; at this size, a notional change of only 170K suggests the pool isn’t crowded yet. But the anomaly percentile is already in the extreme zone, not far from historical extremes.
The continuation across multiple periods is key. A one-day pulse is easy to glance at and move on from; this has staying power and is worth watching. However, OI is already at the 95.8th percentile, so be careful chasing higher: leverage buildup can make the move reflexive. A sustained breakout depends on volume holding up. $CT
47
·
--
$APR just put on a show in the last 24h, surging +49.1% to grab the #3 spot among top movers on Binance Futures. This sharp markup signals strong momentum and aggressive short-term attention pouring into the asset. Let's see if this buying pressure can sustain itself above current levels.
• Price is currently holding at $0.048280.
• 24h quote volume hit $186.4M, moving alongside a 7-day average baseline.
• Funding rate sits at +0.019%, showing a balanced positioning without extreme leverage tilt.
Watch to see if the price manages to defend its recent breakout area or starts fading back into the range.
Are you playing this breakout or staying on the sidelines?
⚠️ Data-driven analysis, not financial advice. DYOR.
91
·
--
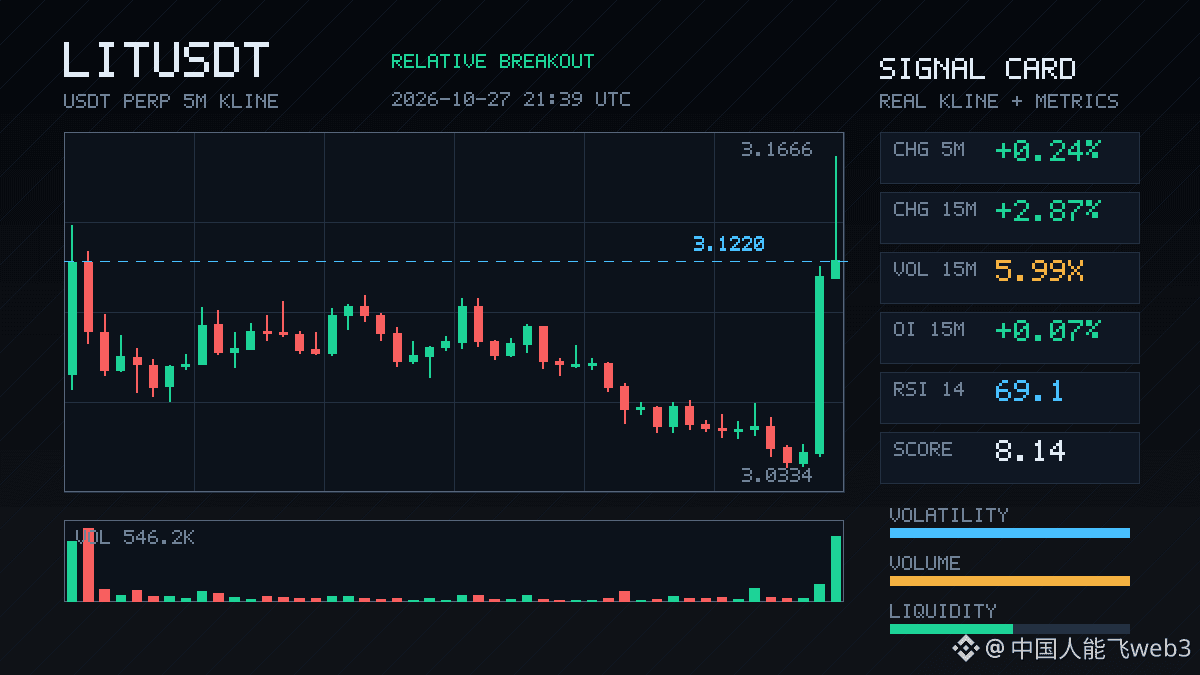
$LIT has made quite a move on the 15m chart. A 2.87% gain isn't huge, but volume is up 5.99x and the Z-score is 5.15, so this isn't just random fluctuation. The OI percentile has hit 100%, ranking #3 among all assets for unusual activity. Price and open interest are rising together, which looks more like new leveraged longs entering than short covering. The 5m candle also closed above the range high of nearly the last 20 candles, with an 8.1% net difference between aggressive buyers and sellers. The funding rate is also at a high percentile for the recent period, so short-term sentiment is definitely heating up. With just $33M in 24h trading volume, if this continues, limited market depth could amplify volatility through slippage. Think carefully before chasing it, and don't use leverage when sentiment is at its most overheated.
$LIT has made quite a move on the 15m chart. A 2.87% gain isn't huge, but volume is up 5.99x and the Z-score is 5.15, so this isn't just random fluctuation. The OI percentile has hit 100%, ranking #3 among all assets for unusual activity. Price and open interest are rising together, which looks more like new leveraged longs entering than short covering. The 5m candle also closed above the range high of nearly the last 20 candles, with an 8.1% net difference between aggressive buyers and sellers. The funding rate is also at a high percentile for the recent period, so short-term sentiment is definitely heating up. With just $33M in 24h trading volume, if this continues, limited market depth could amplify volatility through slippage. Think carefully before chasing it, and don't use leverage when sentiment is at its most overheated.
2
·
--
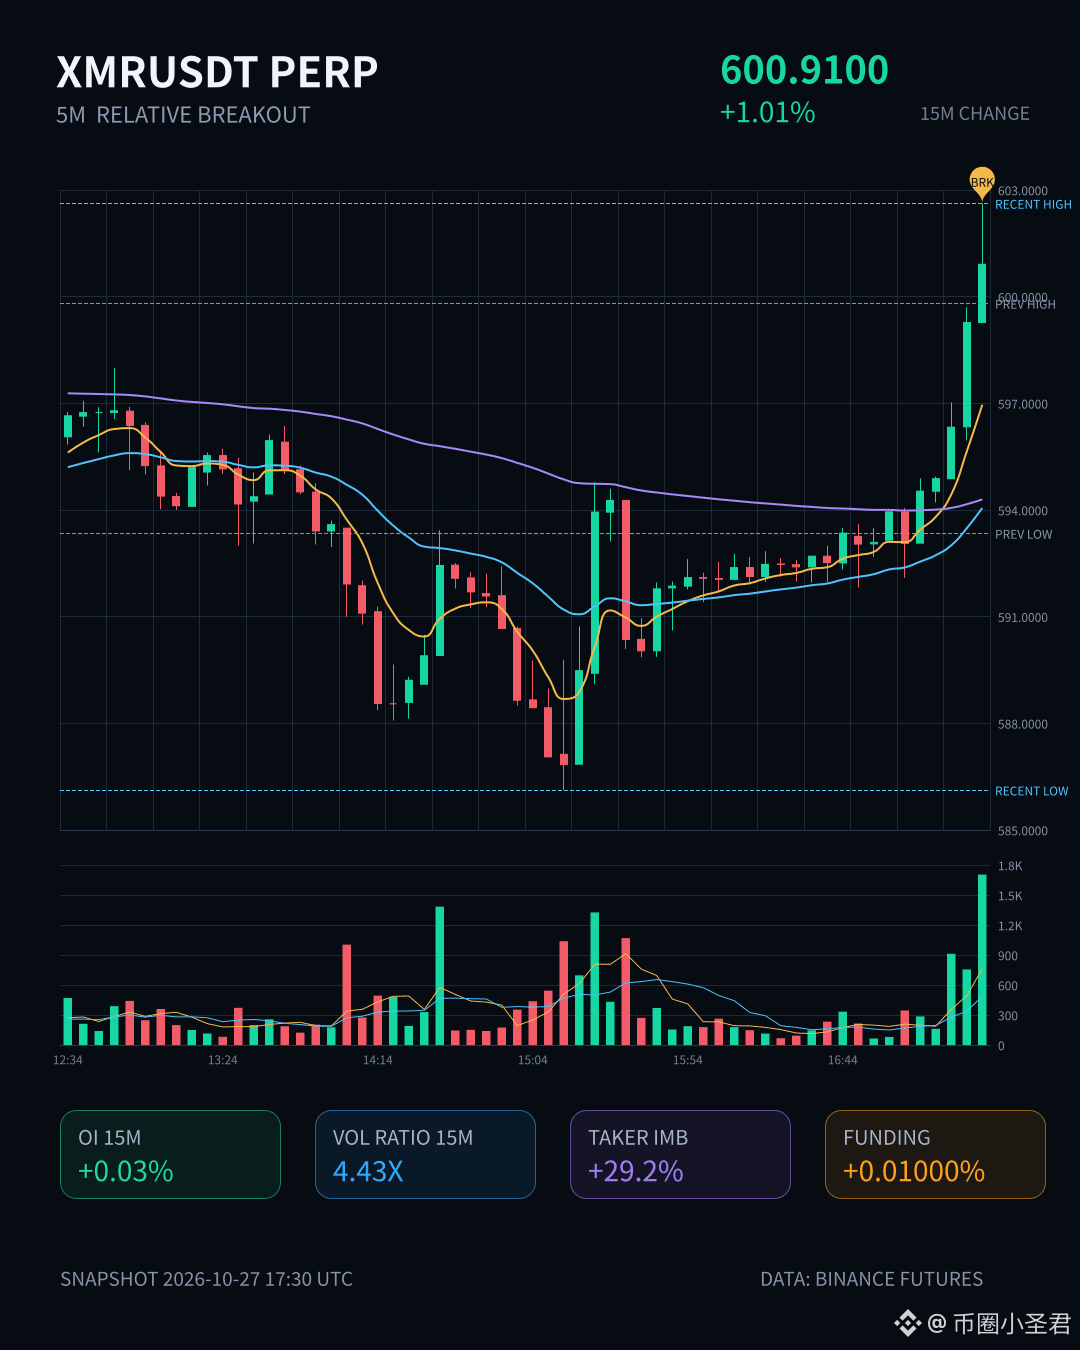
$XMR This move is pretty interesting. It surged 1.01% in 15m, with volume reaching 4.43 times the norm, a buy/sell ratio of 1.82, and an aggressive trade imbalance of 29.2%—clearly driven by aggressive buying.
More importantly, OI rose along with it: +0.03% over 15m and +0.26% over 1h. The notional change is modest, but its anomaly percentile has already hit 96%, ranking #3 across the pool. Price up and open interest up—that’s a classic sign of new leveraged longs entering, not a short-covering bounce.
The closing price has just broken above the upper end of the last 20 5m candles, suggesting it has held above the recent range boundary. 24h trading volume is 58.73M, market depth has also been confirmed, and volume is above normal.
The move has persisted across multiple timeframes, and the notional change also ranks near the top across the pool (#14)—this isn’t a one-candle spike; funds are steadily building positions. However, OI has climbed into an extreme range, so keep an eye out for a reversal squeeze if leverage gets too crowded. If you’re chasing the move, don’t go too heavy.
6
Log in to explore more content
Join global crypto users on Binance Square
⚡️ Get latest and useful information about crypto.
💬 Trusted by the world’s largest crypto exchange.
👍 Discover real insights from verified creators.
Email / Phone number
Trending Topics
1
#CanMicrosoftDeliverOnAI
624,461 views
4,090 Discussing
2
#CanGoogleDefindItsCore
382,110 views
2,862 Discussing
3
#FedWatch
16.1M views
37,219 Discussing
4
#BitcoinCore32.1RaisesPeerConnectionLimit
2,367 views
70 Discussing
5
#EarningsSeason
6.1M views
30,304 Discussing
6
#BitcoinCoreIdentifiesThreeVulnerabilities
12,159 views
240 Discussing
7
#RippleExpects$900MAnnualizedProductRevenueRunRate
1,497 views
10 Discussing
8
#GoogleToPreviewCryptoCustodySecuritySystem
3,672 views
90 Discussing
9
#FedToBeginShrinkingRateSettingCalendarIn2027
4,642 views
58 Discussing
10
#StrategyShareholdersApproveDailyDividends
4,204 views
79 Discussing