
交易中成长
139 Posts

交易中成长
Report
Block User
Rule No.1: Never lose money. Rule No.2: Never forget rule No.1.
Open Trade
High-Frequency Trader
2.2 Years
9 Following
41 Followers
55 Liked
Posts
Portfolio
·
--
Chan theory basics: divergence.
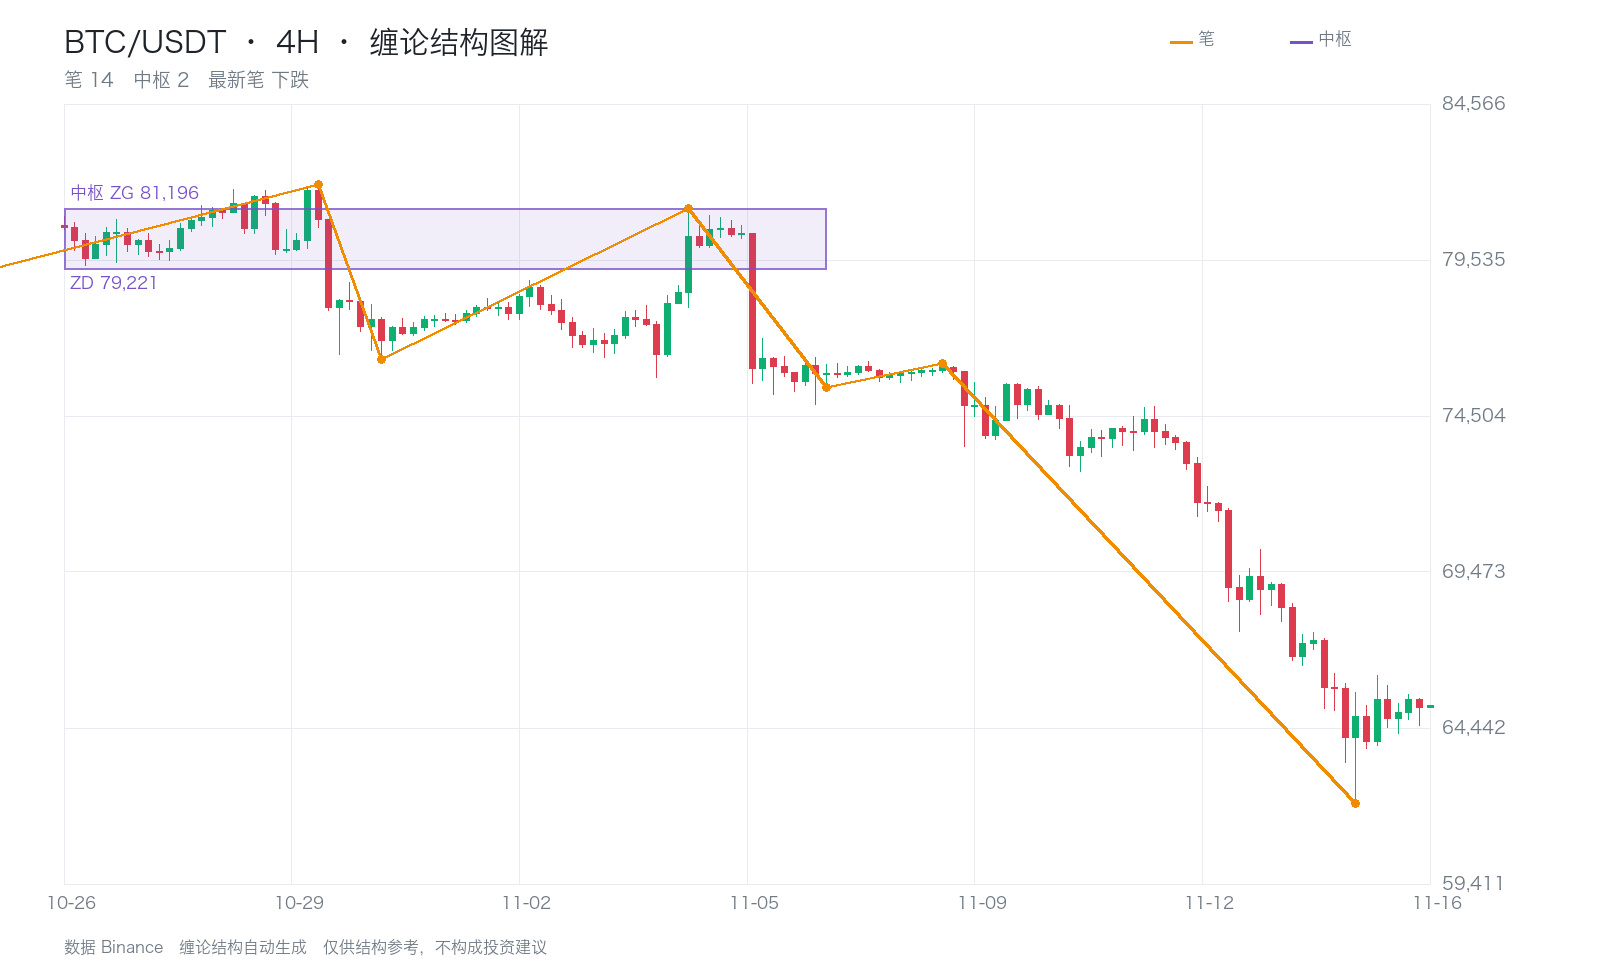
Divergence occurs when, in two consecutive price movements in the same direction, the second move is noticeably weaker than the first. It is identified by comparing MACD histogram area and price movement; only when divergence appears should a reversal be considered.
Compare this with the current BTC 4-hour chart: the central zone is 79,221–81,196, and the price is below it.
Matching the concept to the chart here and now is far more useful than memorizing a definition.
$BTC $ETH #缠论 #WhaleAccumulation
Chan theory basics: divergence.
Divergence occurs when, in two consecutive price movements in the same direction, the second move is noticeably weaker than the first. It is identified by comparing MACD histogram area and price movement; only when divergence appears should a reversal be considered.
Compare this with the current BTC 4-hour chart: the central zone is 79,221–81,196, and the price is below it.
Matching the concept to the chart here and now is far more useful than memorizing a definition.
$BTC $ETH #缠论 #WhaleAccumulation
Divergence occurs when, in two consecutive price movements in the same direction, the second move is noticeably weaker than the first. It is identified by comparing MACD histogram area and price movement; only when divergence appears should a reversal be considered.
Compare this with the current BTC 4-hour chart: the central zone is 79,221–81,196, and the price is below it.
Matching the concept to the chart here and now is far more useful than memorizing a definition.
$BTC $ETH #缠论 #WhaleAccumulation
116
·
--
Chan Theory Basics: The Central Zone.
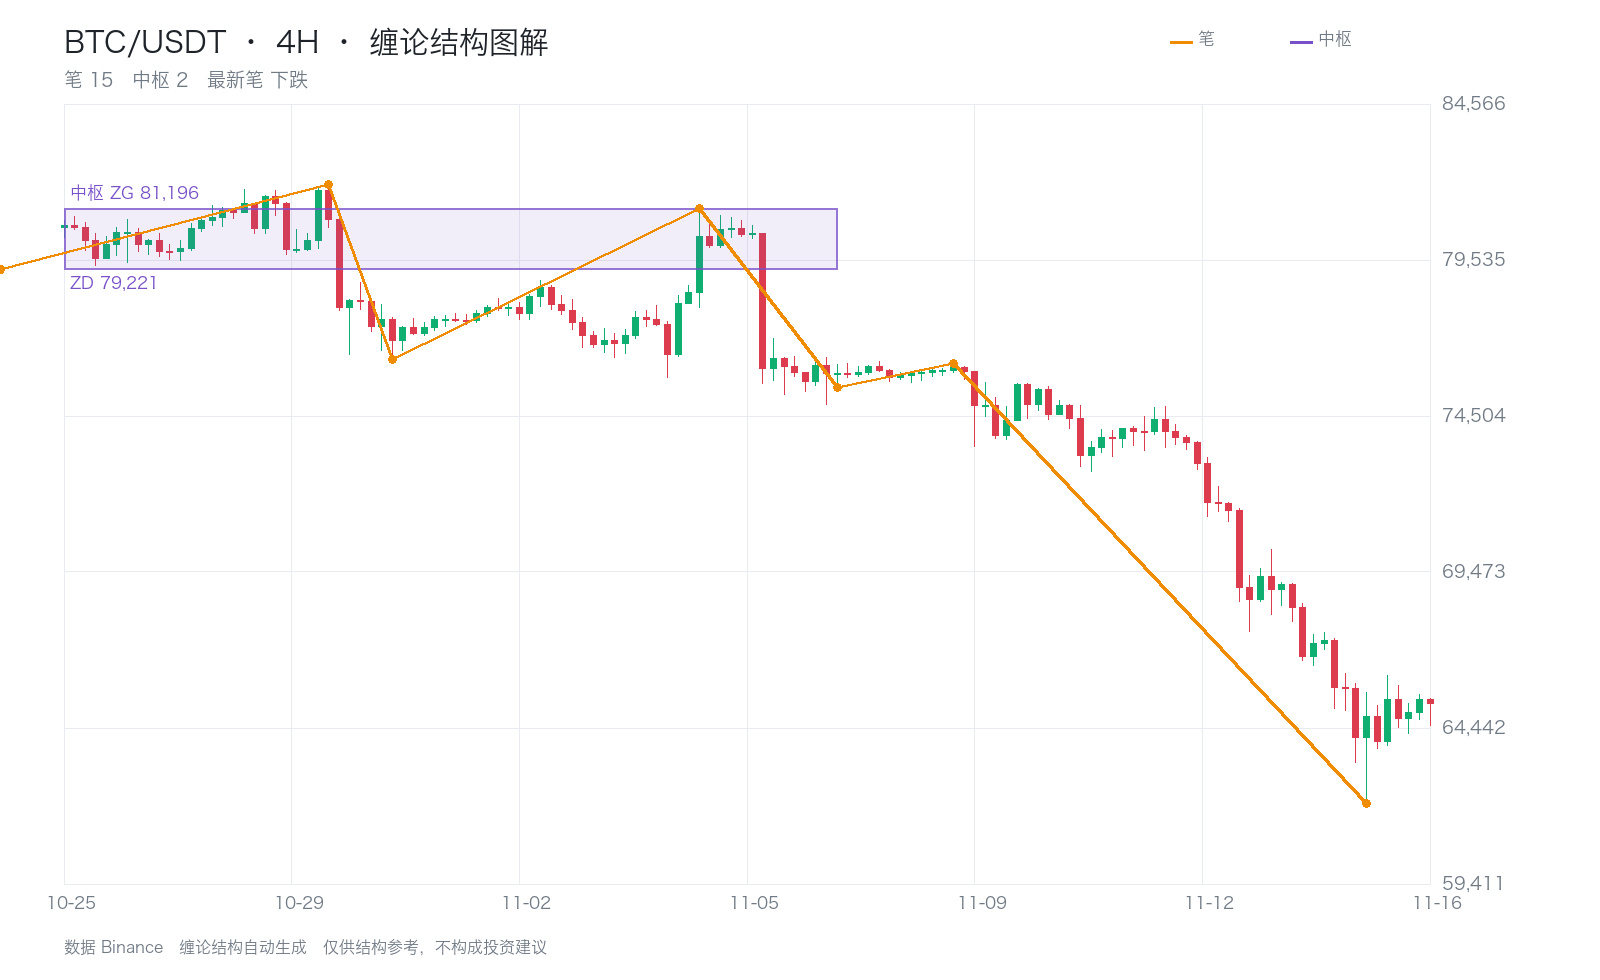
The central zone is the price range where three consecutive movements of the next lower degree overlap, bounded by ZG (the upper edge) and ZD (the lower edge). When price is inside the central zone, it is ranging; a trend only comes into play once price leaves the zone.
Compare this with the current BTC 4-hour chart: the central zone is 79,221–81,196, and price is below it.
Matching the concept to the current chart is far more useful than memorizing definitions.
$BTC $ETH #缠论 #WhaleAccumulation
Chan Theory Basics: The Central Zone.
The central zone is the price range where three consecutive movements of the next lower degree overlap, bounded by ZG (the upper edge) and ZD (the lower edge). When price is inside the central zone, it is ranging; a trend only comes into play once price leaves the zone.
Compare this with the current BTC 4-hour chart: the central zone is 79,221–81,196, and price is below it.
Matching the concept to the current chart is far more useful than memorizing definitions.
$BTC $ETH #缠论 #WhaleAccumulation
The central zone is the price range where three consecutive movements of the next lower degree overlap, bounded by ZG (the upper edge) and ZD (the lower edge). When price is inside the central zone, it is ranging; a trend only comes into play once price leaves the zone.
Compare this with the current BTC 4-hour chart: the central zone is 79,221–81,196, and price is below it.
Matching the concept to the current chart is far more useful than memorizing definitions.
$BTC $ETH #缠论 #WhaleAccumulation
104
·
--
Chan Theory Basics: The Third Sell Point.
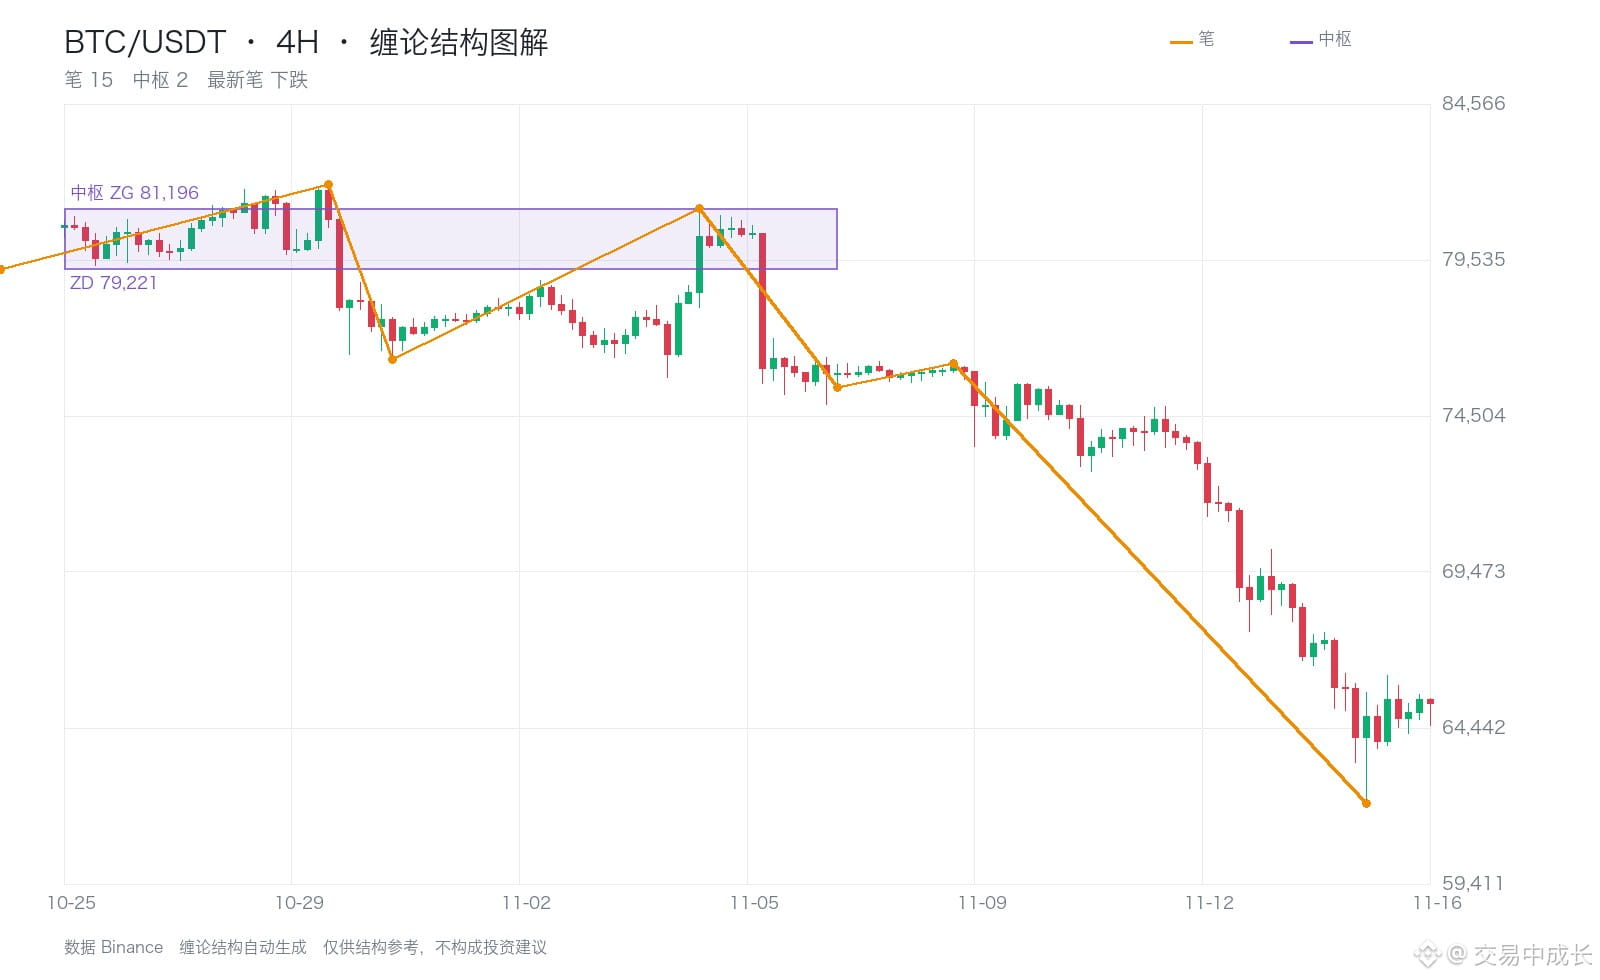
The third sell point forms when, after breaking below the central zone, the first rebound fails to return to it. Its significance is that the central zone determines the entry point, while the stop-loss is near its upper boundary—meaning limited downside and plenty of room for profit.
Compare this with the current 4-hour BTC chart: the central zone is 79,221–81,196, and the price is below it.
Relating the concept to the chart right now is far more useful than memorizing a definition.
$BTC $ETH #缠论 #Whale Accumulation
Chan Theory Basics: The Third Sell Point.
The third sell point forms when, after breaking below the central zone, the first rebound fails to return to it. Its significance is that the central zone determines the entry point, while the stop-loss is near its upper boundary—meaning limited downside and plenty of room for profit.
Compare this with the current 4-hour BTC chart: the central zone is 79,221–81,196, and the price is below it.
Relating the concept to the chart right now is far more useful than memorizing a definition.
$BTC $ETH #缠论 #Whale Accumulation
The third sell point forms when, after breaking below the central zone, the first rebound fails to return to it. Its significance is that the central zone determines the entry point, while the stop-loss is near its upper boundary—meaning limited downside and plenty of room for profit.
Compare this with the current 4-hour BTC chart: the central zone is 79,221–81,196, and the price is below it.
Relating the concept to the chart right now is far more useful than memorizing a definition.
$BTC $ETH #缠论 #Whale Accumulation
116
·
--
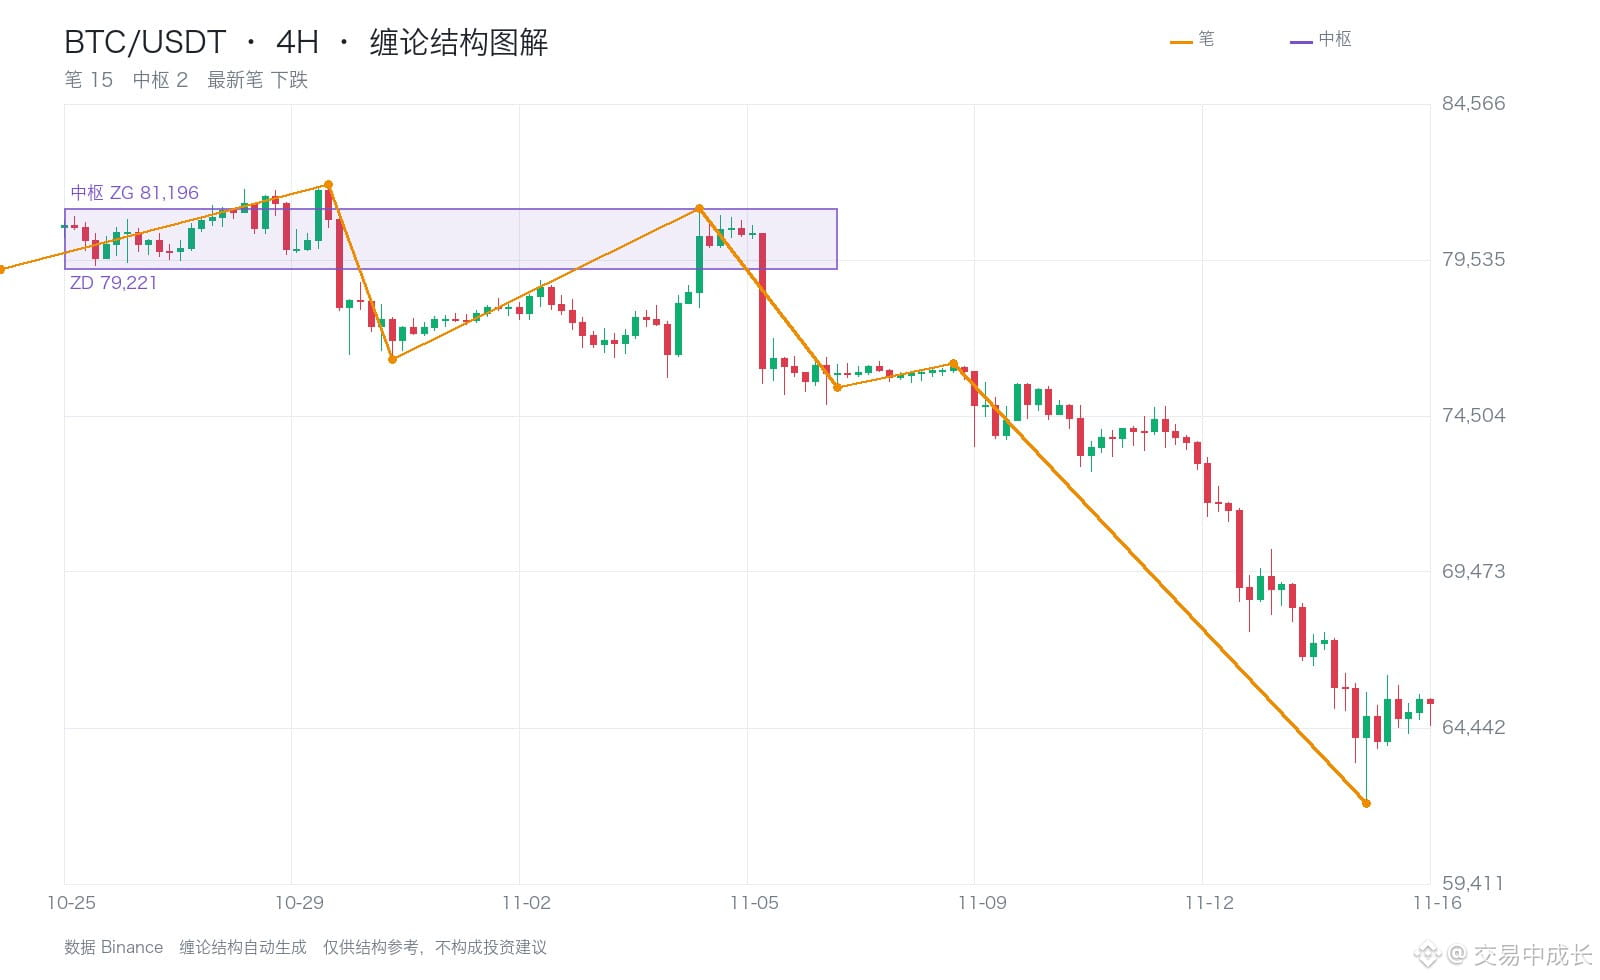
BTC 4h structure update, current price: 65,236.
The current-level pivot zone is 79,221–81,196, and the price is below it.
The latest leg is downward, and no confirmed reversal fractal has appeared yet.
The 4-hour chart has moved out of the pivot, while the daily chart is still within it—this is a lower-timeframe decline near the lower edge of a higher-timeframe consolidation.
In Chan theory, the lower edge of the pivot is the bull-bear dividing line: if price breaks below it and fails to reclaim it, that forms a third sell point; only after it climbs back into the pivot can we talk about a rebound.
$BTC $ETH #缠论 #Whale accumulation
BTC 4h structure update, current price: 65,236.
The current-level pivot zone is 79,221–81,196, and the price is below it.
The latest leg is downward, and no confirmed reversal fractal has appeared yet.
The 4-hour chart has moved out of the pivot, while the daily chart is still within it—this is a lower-timeframe decline near the lower edge of a higher-timeframe consolidation.
In Chan theory, the lower edge of the pivot is the bull-bear dividing line: if price breaks below it and fails to reclaim it, that forms a third sell point; only after it climbs back into the pivot can we talk about a rebound.
$BTC $ETH #缠论 #Whale accumulation
The current-level pivot zone is 79,221–81,196, and the price is below it.
The latest leg is downward, and no confirmed reversal fractal has appeared yet.
The 4-hour chart has moved out of the pivot, while the daily chart is still within it—this is a lower-timeframe decline near the lower edge of a higher-timeframe consolidation.
In Chan theory, the lower edge of the pivot is the bull-bear dividing line: if price breaks below it and fails to reclaim it, that forms a third sell point; only after it climbs back into the pivot can we talk about a rebound.
$BTC $ETH #缠论 #Whale accumulation
4
·
--
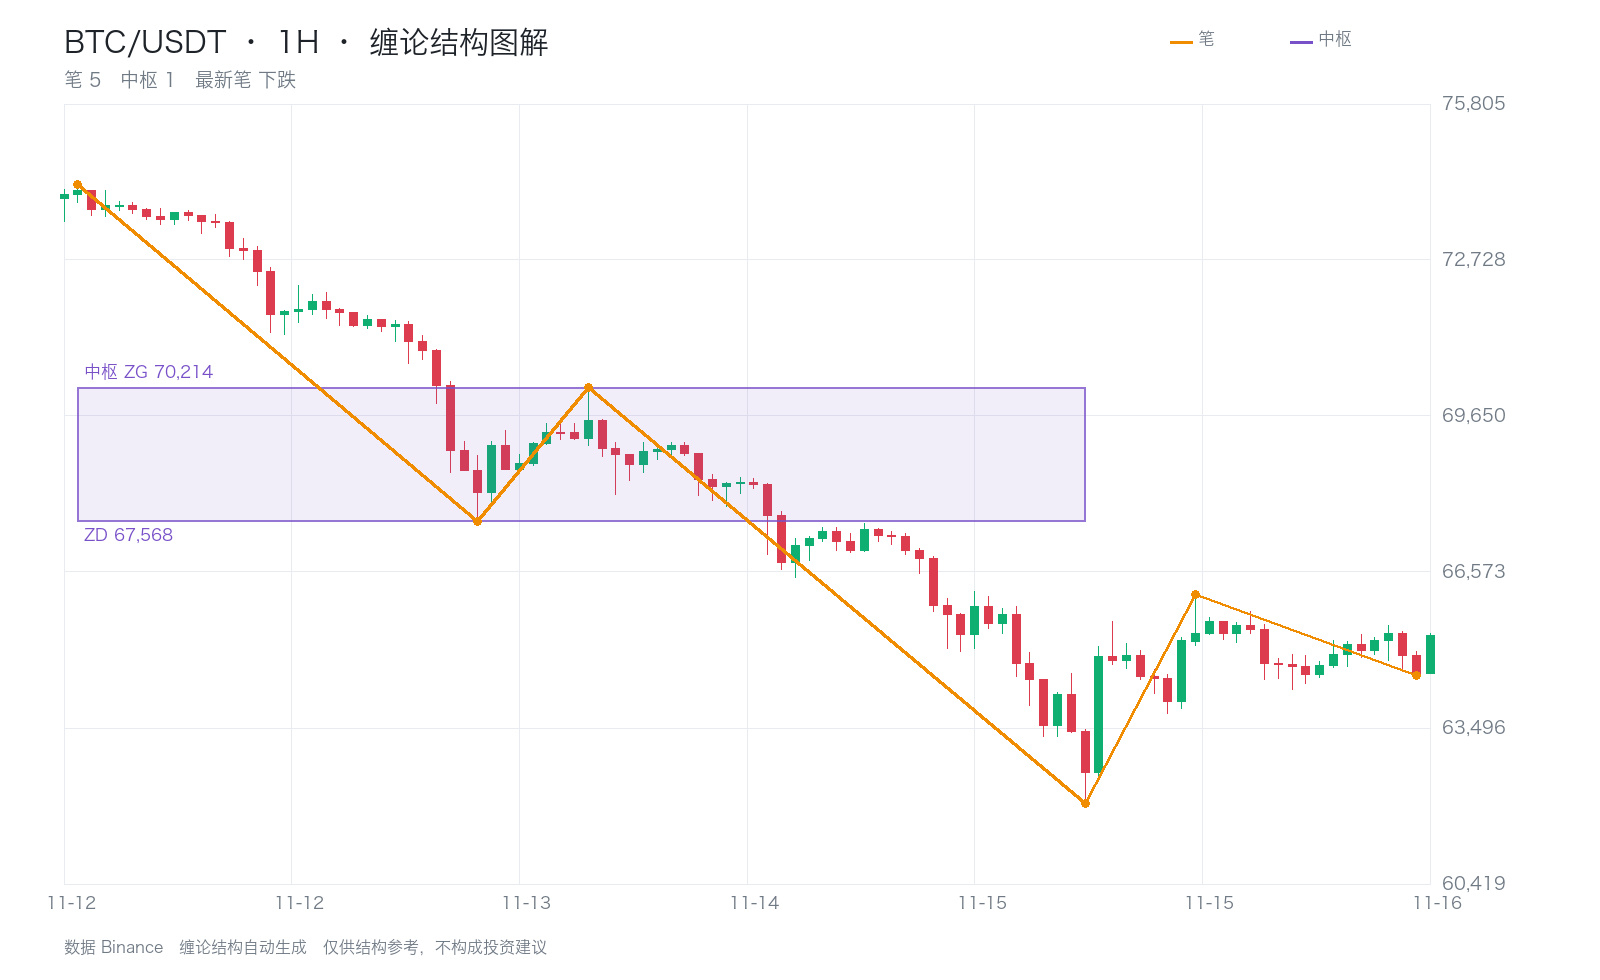
Market alert: BTC just rose 1.17% on a 1h candle, with the current price at 65,325.
The current central range is 67,568–70,214, and the price is below it.
The latest stroke is downward, with no confirmed fractal in the opposite direction yet.
A sharp rise is either the first move in a trend reversal or a rebound after a deep drop.
There’s only one criterion: can it move above the top of the central range and hold there? If not, it’s still just a rebound.
$BTC $ETH #缠论 #Whale accumulation
Market alert: BTC just rose 1.17% on a 1h candle, with the current price at 65,325.
The current central range is 67,568–70,214, and the price is below it.
The latest stroke is downward, with no confirmed fractal in the opposite direction yet.
A sharp rise is either the first move in a trend reversal or a rebound after a deep drop.
There’s only one criterion: can it move above the top of the central range and hold there? If not, it’s still just a rebound.
$BTC $ETH #缠论 #Whale accumulation
The current central range is 67,568–70,214, and the price is below it.
The latest stroke is downward, with no confirmed fractal in the opposite direction yet.
A sharp rise is either the first move in a trend reversal or a rebound after a deep drop.
There’s only one criterion: can it move above the top of the central range and hold there? If not, it’s still just a rebound.
$BTC $ETH #缠论 #Whale accumulation
14
·
--
I just completed a new trade! Copy my portfolio with one tap 👇
I just completed a new trade! Copy my portfolio with one tap 👇
交易中成长
Close Position
SNXUSDT
PNL(USDT)
-7.70
Close Price
0.14957292
·
--
I just completed a new trade! Copy my portfolio with one tap 👇
I just completed a new trade! Copy my portfolio with one tap 👇
交易中成长
Close Position
ICPUSDT
PNL(USDT)
-10.40
Close Price
2.256
·
--
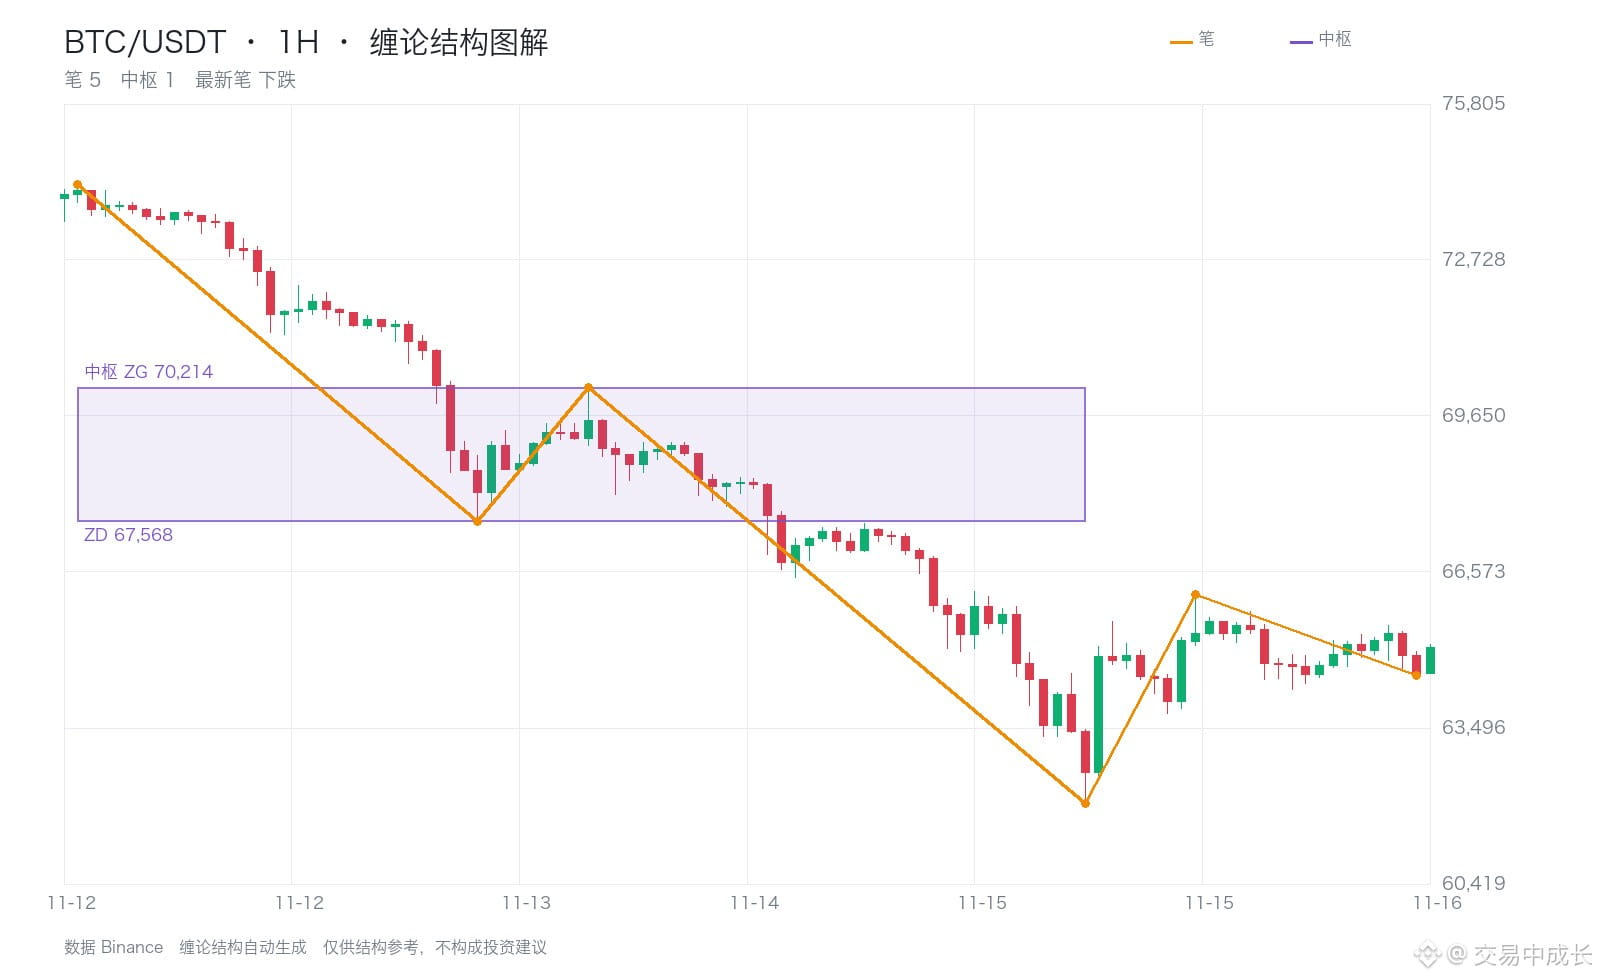
Market Alert: BTC just rose 0.81% in a 1h candle, with the current price at 65,091.
The current consolidation zone is 67,568–70,214, and the price is below it.
The latest leg was downward, and no confirmed reversal fractal has appeared yet.
A sharp rally is either the first leg of a trend reversal or a corrective bounce after a steep decline.
There’s only one thing to watch: whether the price can break above and hold above the top of the consolidation zone. If it can’t, this is still just a rebound.
$BTC $ETH #缠论 #Whale Accumulation
Market Alert: BTC just rose 0.81% in a 1h candle, with the current price at 65,091.
The current consolidation zone is 67,568–70,214, and the price is below it.
The latest leg was downward, and no confirmed reversal fractal has appeared yet.
A sharp rally is either the first leg of a trend reversal or a corrective bounce after a steep decline.
There’s only one thing to watch: whether the price can break above and hold above the top of the consolidation zone. If it can’t, this is still just a rebound.
$BTC $ETH #缠论 #Whale Accumulation
The current consolidation zone is 67,568–70,214, and the price is below it.
The latest leg was downward, and no confirmed reversal fractal has appeared yet.
A sharp rally is either the first leg of a trend reversal or a corrective bounce after a steep decline.
There’s only one thing to watch: whether the price can break above and hold above the top of the consolidation zone. If it can’t, this is still just a rebound.
$BTC $ETH #缠论 #Whale Accumulation
149
·
--
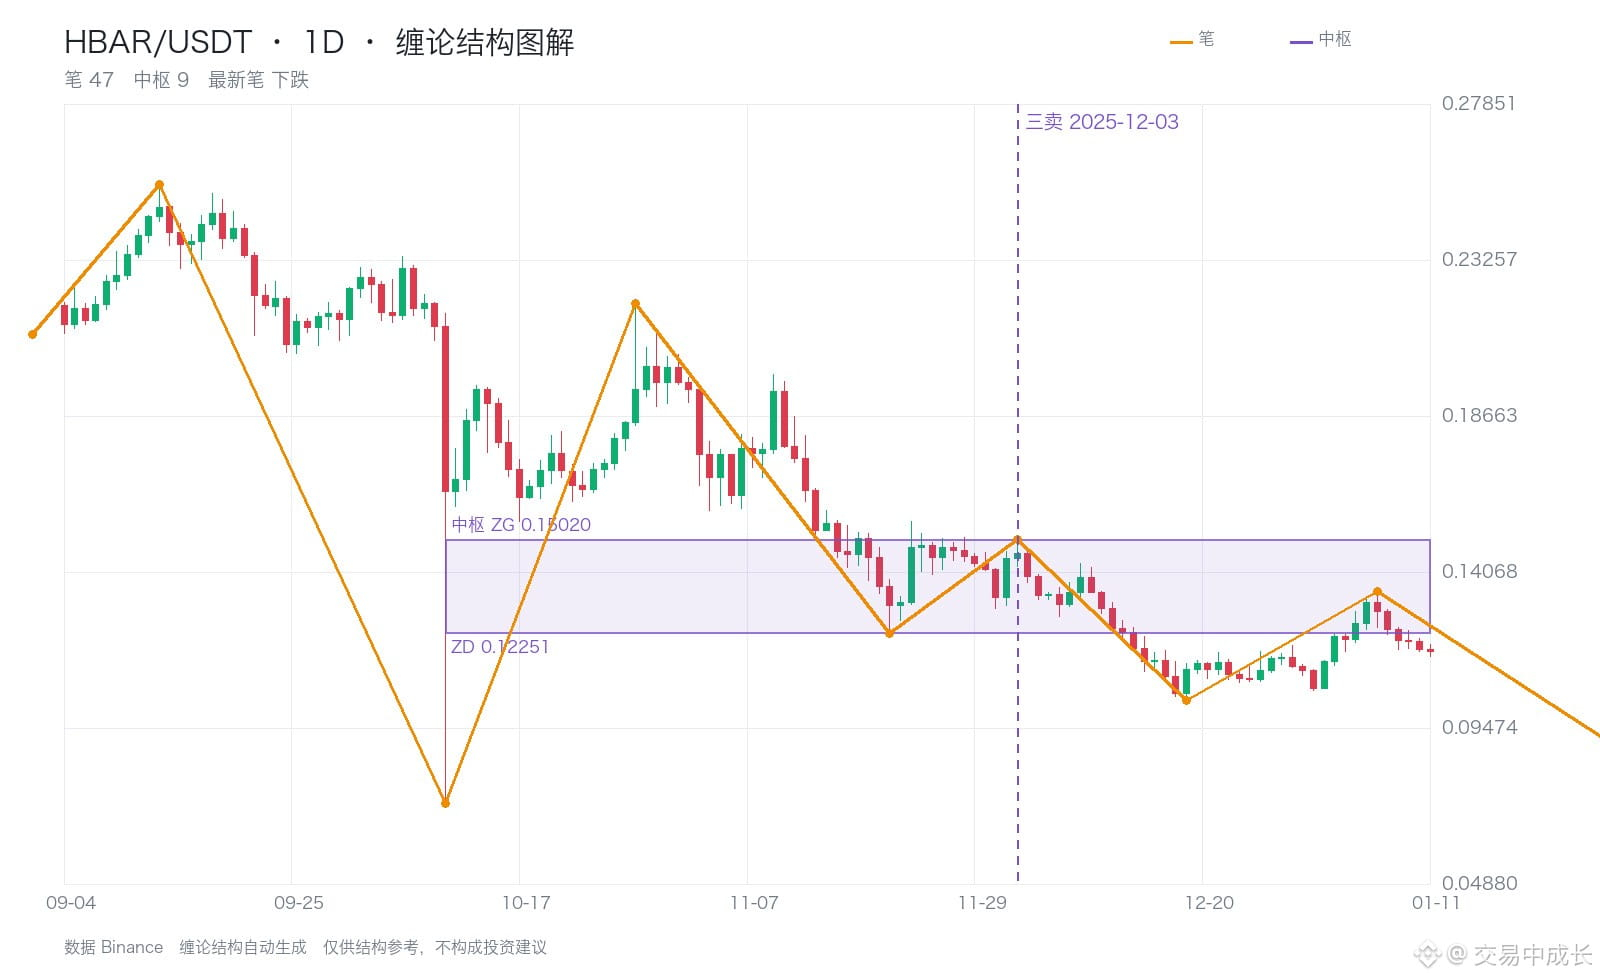
A historical example: On December 3, 2025, HBAR showed a third sell signal on the 1D timeframe.
At the time, the central zone was 0.22550–0.27625. The signal price of 0.15020 was below the zone’s lower boundary of 0.22550, making it a rebound sell point after the price broke below the zone.
After the signal appeared, the price fell to a low of 0.10295 within 20 candlesticks, a maximum drop of 31.5% from the signal price (closing at 0.11045).
That’s the value of a third sell: the zone determines the price level, and the stop-loss is placed near its upper boundary—limiting losses while leaving room for bigger gains.
History doesn’t simply repeat itself, but patterns recur. It takes seeing the same setup again and again before you dare to act on a genuine signal.
$HBAR $BTC $ETH #缠论 #Whale accumulation
A historical example: On December 3, 2025, HBAR showed a third sell signal on the 1D timeframe.
At the time, the central zone was 0.22550–0.27625. The signal price of 0.15020 was below the zone’s lower boundary of 0.22550, making it a rebound sell point after the price broke below the zone.
After the signal appeared, the price fell to a low of 0.10295 within 20 candlesticks, a maximum drop of 31.5% from the signal price (closing at 0.11045).
That’s the value of a third sell: the zone determines the price level, and the stop-loss is placed near its upper boundary—limiting losses while leaving room for bigger gains.
History doesn’t simply repeat itself, but patterns recur. It takes seeing the same setup again and again before you dare to act on a genuine signal.
$HBAR $BTC $ETH #缠论 #Whale accumulation
At the time, the central zone was 0.22550–0.27625. The signal price of 0.15020 was below the zone’s lower boundary of 0.22550, making it a rebound sell point after the price broke below the zone.
After the signal appeared, the price fell to a low of 0.10295 within 20 candlesticks, a maximum drop of 31.5% from the signal price (closing at 0.11045).
That’s the value of a third sell: the zone determines the price level, and the stop-loss is placed near its upper boundary—limiting losses while leaving room for bigger gains.
History doesn’t simply repeat itself, but patterns recur. It takes seeing the same setup again and again before you dare to act on a genuine signal.
$HBAR $BTC $ETH #缠论 #Whale accumulation
11
·
--
I just completed a new trade! Copy my portfolio with one tap 👇
I just completed a new trade! Copy my portfolio with one tap 👇
交易中成长
Open Position
BCHUSDTShort 20x
Position Size(USDT)
-1.206
Entry Price
207.23239
·
--
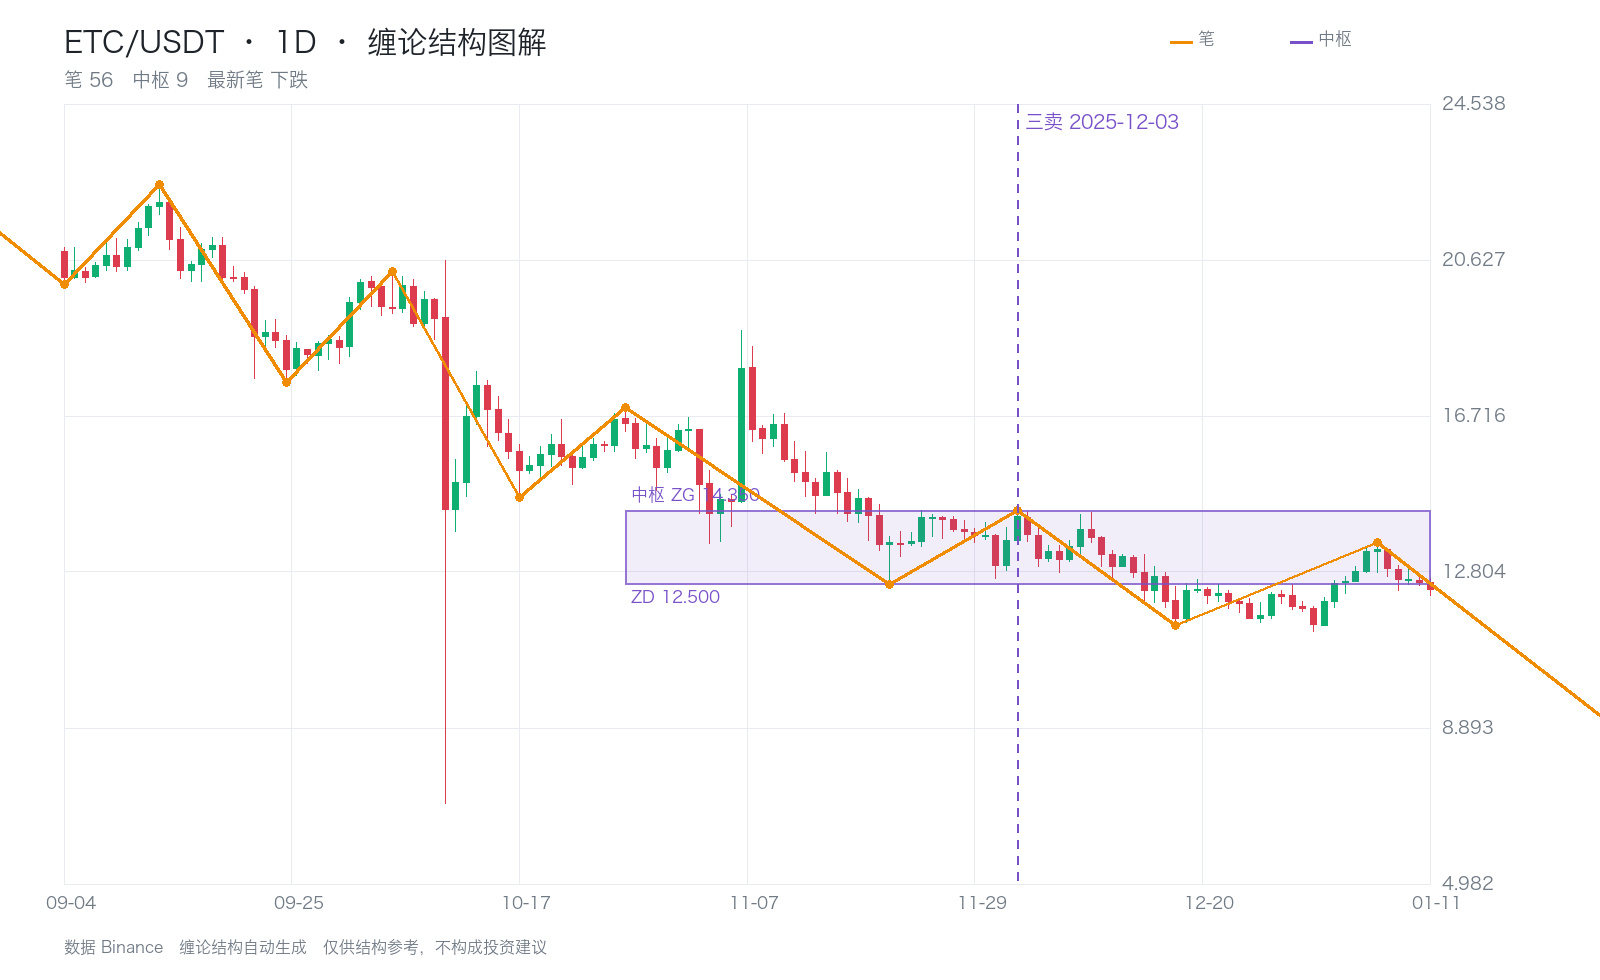
A historical case: On December 3, 2025, ETC showed a Third Sell signal on the 1D timeframe.
At the time, the consolidation range was 20.000–24.460. The signal price of 14.350 was below the lower boundary of the range at 20.000, making it a sell point on the rebound after breaking below the range.
After the signal appeared, the price fell to a low of 11.470 within 20 candlesticks, a maximum drop of 20.1% from the signal price (closing at 12.070).
That’s the value of a Third Sell: the position is determined by the consolidation range, and the stop-loss is placed near its upper boundary—small losses, big gains.
History doesn’t simply repeat itself, but patterns recur. Only after seeing the same pattern many times can you confidently act on a genuine signal.
$ETC $BTC $ETH #缠论 #Whale accumulation
A historical case: On December 3, 2025, ETC showed a Third Sell signal on the 1D timeframe.
At the time, the consolidation range was 20.000–24.460. The signal price of 14.350 was below the lower boundary of the range at 20.000, making it a sell point on the rebound after breaking below the range.
After the signal appeared, the price fell to a low of 11.470 within 20 candlesticks, a maximum drop of 20.1% from the signal price (closing at 12.070).
That’s the value of a Third Sell: the position is determined by the consolidation range, and the stop-loss is placed near its upper boundary—small losses, big gains.
History doesn’t simply repeat itself, but patterns recur. Only after seeing the same pattern many times can you confidently act on a genuine signal.
$ETC $BTC $ETH #缠论 #Whale accumulation
At the time, the consolidation range was 20.000–24.460. The signal price of 14.350 was below the lower boundary of the range at 20.000, making it a sell point on the rebound after breaking below the range.
After the signal appeared, the price fell to a low of 11.470 within 20 candlesticks, a maximum drop of 20.1% from the signal price (closing at 12.070).
That’s the value of a Third Sell: the position is determined by the consolidation range, and the stop-loss is placed near its upper boundary—small losses, big gains.
History doesn’t simply repeat itself, but patterns recur. Only after seeing the same pattern many times can you confidently act on a genuine signal.
$ETC $BTC $ETH #缠论 #Whale accumulation
5
·
--
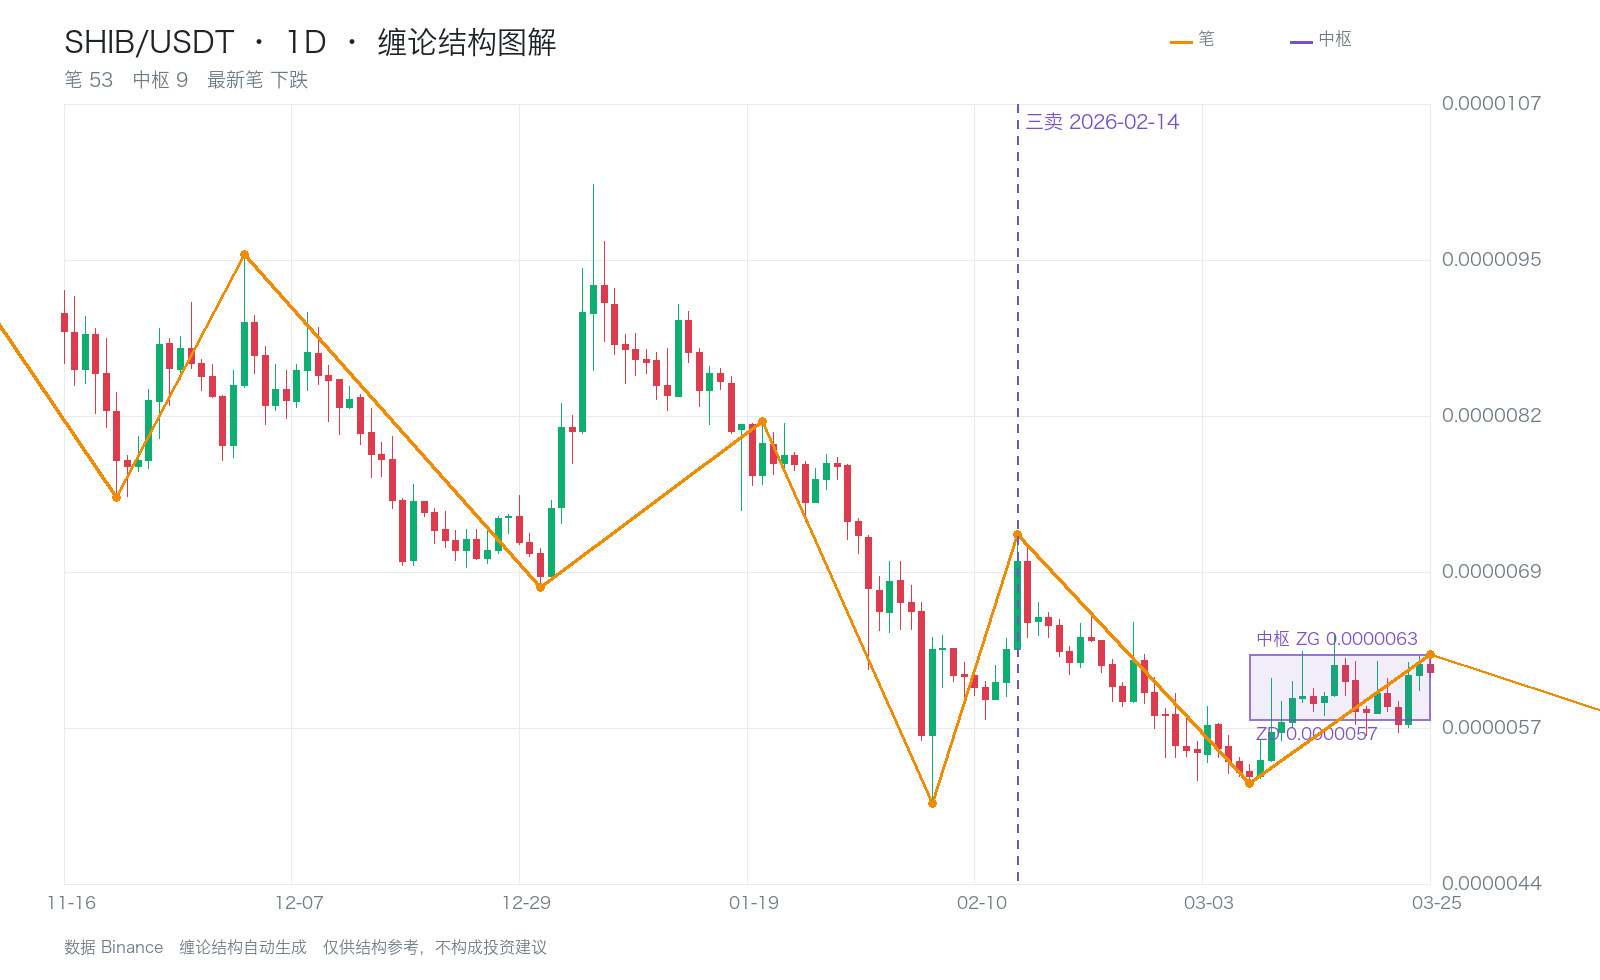
Let’s review a historical case: On February 14, 2026, SHIB showed a third sell signal on the 1d timeframe.
At the time, the consolidation range was 0.0000092–0.0000095. The signal price of 0.0000073 was below the lower boundary of 0.0000092, making it a rebound sell point after the price broke below the range.
After the signal appeared, the price fell to a low of 0.0000053 within 20 candlesticks, a maximum drop of 27.4% from the signal price (closing at 0.0000054).
That’s the value of a third sell: the position is determined by the consolidation range, and the stop-loss is placed near its upper boundary—small losses, big gains.
History doesn’t repeat itself exactly, but patterns recur. It takes seeing the same setup many times before you dare to act on a genuine signal.
$SHIB $BTC $ETH #缠论 #Whale Accumulation
Let’s review a historical case: On February 14, 2026, SHIB showed a third sell signal on the 1d timeframe.
At the time, the consolidation range was 0.0000092–0.0000095. The signal price of 0.0000073 was below the lower boundary of 0.0000092, making it a rebound sell point after the price broke below the range.
After the signal appeared, the price fell to a low of 0.0000053 within 20 candlesticks, a maximum drop of 27.4% from the signal price (closing at 0.0000054).
That’s the value of a third sell: the position is determined by the consolidation range, and the stop-loss is placed near its upper boundary—small losses, big gains.
History doesn’t repeat itself exactly, but patterns recur. It takes seeing the same setup many times before you dare to act on a genuine signal.
$SHIB $BTC $ETH #缠论 #Whale Accumulation
At the time, the consolidation range was 0.0000092–0.0000095. The signal price of 0.0000073 was below the lower boundary of 0.0000092, making it a rebound sell point after the price broke below the range.
After the signal appeared, the price fell to a low of 0.0000053 within 20 candlesticks, a maximum drop of 27.4% from the signal price (closing at 0.0000054).
That’s the value of a third sell: the position is determined by the consolidation range, and the stop-loss is placed near its upper boundary—small losses, big gains.
History doesn’t repeat itself exactly, but patterns recur. It takes seeing the same setup many times before you dare to act on a genuine signal.
$SHIB $BTC $ETH #缠论 #Whale Accumulation
17
·
--
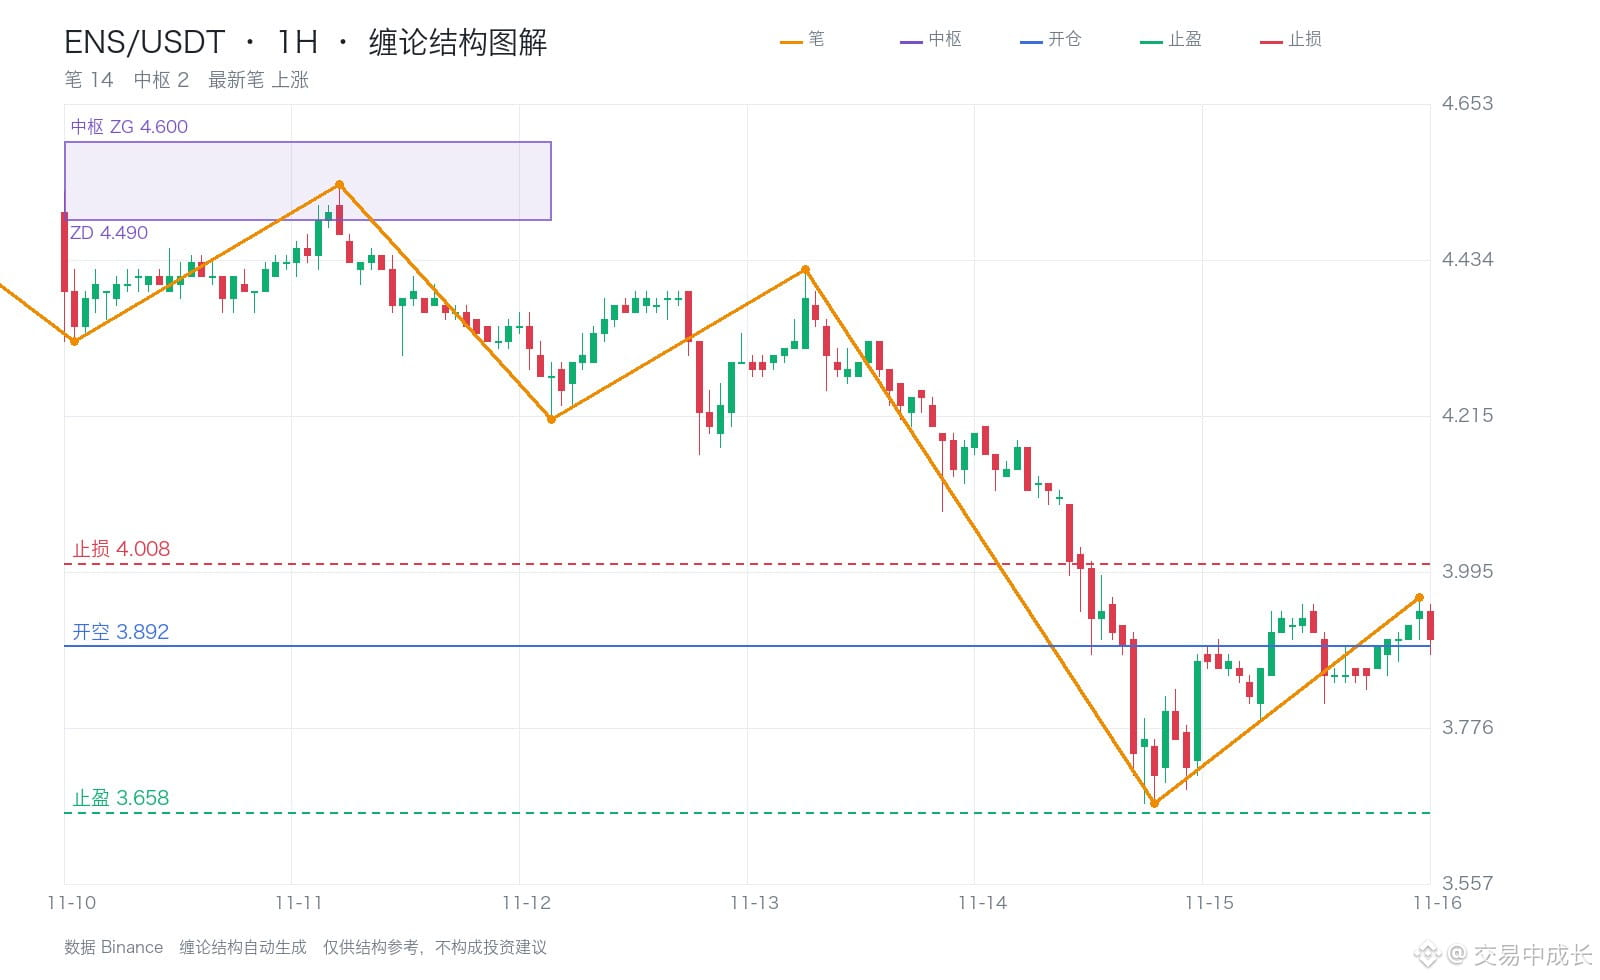
ENS on the 1-hour timeframe has formed a third sell signal. Short entry: 3.892.
The more distant consolidation zone above is 4.490–4.600. Price broke below it long ago and has continued falling, now about 13% below its lower boundary.
According to Chan Theory, the first rebound after a price breaks below a consolidation zone that fails to re-enter the zone is a third sell point—the clearest short entry signal.
Looking at the two higher timeframes, both the 4-hour and daily charts are below their respective consolidation zones. The broader trend is aligned to the downside, confirming the third sell signal.
Stop loss: 4.008 (about 3.0% from entry). Take profit: 3.658. Limited downside, with greater profit potential.
$ENS $BTC $ETH #缠论 #Whale accumulation
ENS on the 1-hour timeframe has formed a third sell signal. Short entry: 3.892.
The more distant consolidation zone above is 4.490–4.600. Price broke below it long ago and has continued falling, now about 13% below its lower boundary.
According to Chan Theory, the first rebound after a price breaks below a consolidation zone that fails to re-enter the zone is a third sell point—the clearest short entry signal.
Looking at the two higher timeframes, both the 4-hour and daily charts are below their respective consolidation zones. The broader trend is aligned to the downside, confirming the third sell signal.
Stop loss: 4.008 (about 3.0% from entry). Take profit: 3.658. Limited downside, with greater profit potential.
$ENS $BTC $ETH #缠论 #Whale accumulation
The more distant consolidation zone above is 4.490–4.600. Price broke below it long ago and has continued falling, now about 13% below its lower boundary.
According to Chan Theory, the first rebound after a price breaks below a consolidation zone that fails to re-enter the zone is a third sell point—the clearest short entry signal.
Looking at the two higher timeframes, both the 4-hour and daily charts are below their respective consolidation zones. The broader trend is aligned to the downside, confirming the third sell signal.
Stop loss: 4.008 (about 3.0% from entry). Take profit: 3.658. Limited downside, with greater profit potential.
$ENS $BTC $ETH #缠论 #Whale accumulation
30
·
--
Article
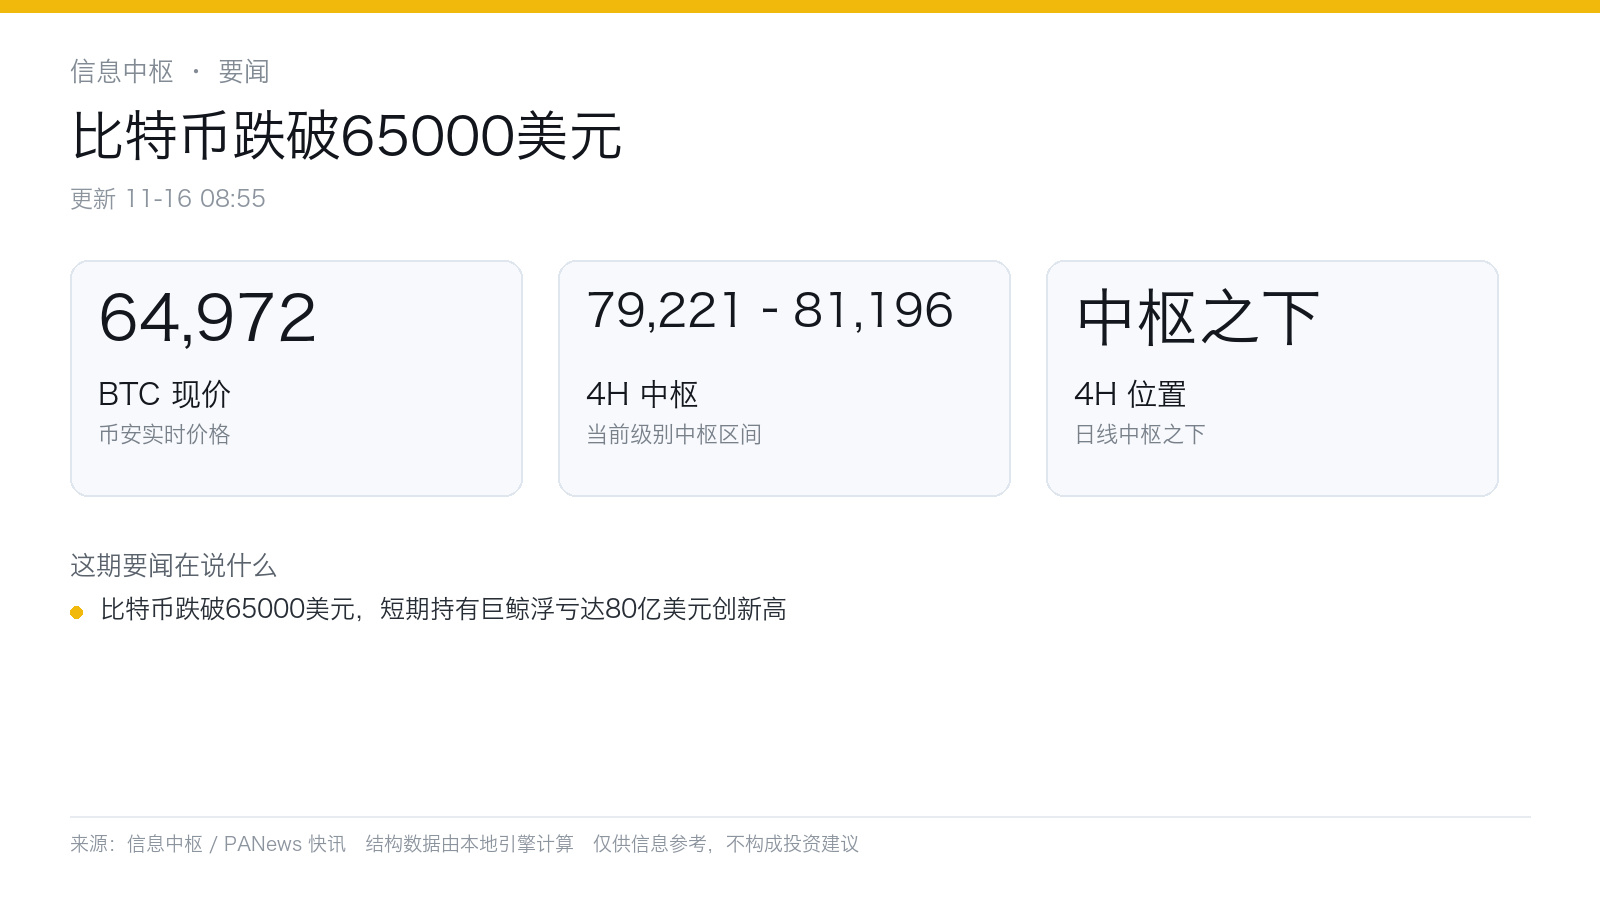
News | Bitcoin falls below $65,000Bitcoin fell below $65,000, with short-term whale holders’ unrealized losses hitting a record $8 billion.
OKX market data shows Bitcoin fell below $65,000 and is currently trading at $64,984.60 per coin.
Looking only at BTC’s current candlestick structure: the 4-hour range is 79,221–81,196, with price below it; the daily chart is also below the range.
News provides context, but subsequent price moves still need to be confirmed by price action and closing prices. Direction cannot be judged from headlines alone.
$BTC $ETH #缠论 #Whale accumulation
News | Bitcoin falls below $65,000
Bitcoin fell below $65,000, with short-term whale holders’ unrealized losses hitting a record $8 billion.
OKX market data shows Bitcoin fell below $65,000 and is currently trading at $64,984.60 per coin.
Looking only at BTC’s current candlestick structure: the 4-hour range is 79,221–81,196, with price below it; the daily chart is also below the range.
News provides context, but subsequent price moves still need to be confirmed by price action and closing prices. Direction cannot be judged from headlines alone.
$BTC $ETH #缠论 #Whale accumulation
OKX market data shows Bitcoin fell below $65,000 and is currently trading at $64,984.60 per coin.
Looking only at BTC’s current candlestick structure: the 4-hour range is 79,221–81,196, with price below it; the daily chart is also below the range.
News provides context, but subsequent price moves still need to be confirmed by price action and closing prices. Direction cannot be judged from headlines alone.
$BTC $ETH #缠论 #Whale accumulation
29
·
--
I just completed a new trade! Copy my portfolio with one tap 👇
I just completed a new trade! Copy my portfolio with one tap 👇
交易中成长
Open Position
ENSUSDTShort 20x
Position Size(USDT)
-89.9
Entry Price
3.8901
·
--
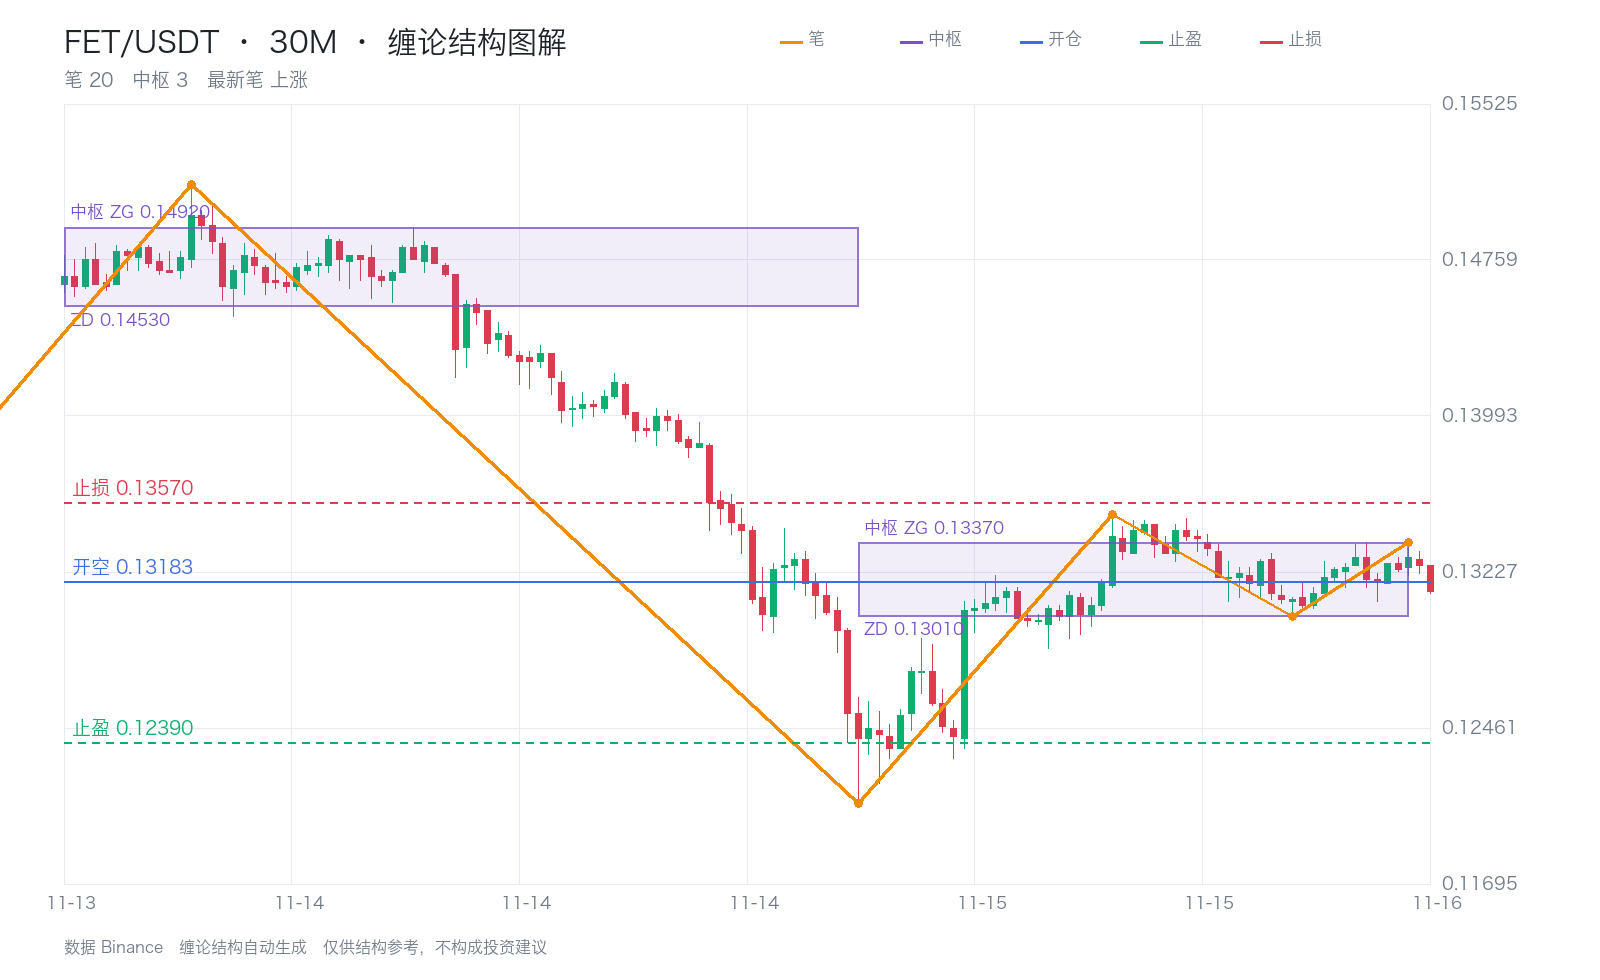
FET 30-minute chart shows a third sell signal; short entry at 0.13183.
The consolidation range is 0.13010–0.13370, and the price is still fluctuating within it.
This third sell signal appeared inside the consolidation range: the price failed to rebound from the lower boundary, and the move is weaker than a third sell signal after a breakdown, so position size should be kept small.
Looking at the next two higher timeframes, both the 4-hour chart and the daily chart are below their respective consolidation ranges. The broader trend is aligned to the downside, confirming the third sell signal.
Stop-loss at 0.13570 (about 2.9% from entry); take-profit at 0.12390. Losses are limited, while gains have room to grow.
$FET $BTC $ETH #缠论 #Stablecoin contraction
FET 30-minute chart shows a third sell signal; short entry at 0.13183.
The consolidation range is 0.13010–0.13370, and the price is still fluctuating within it.
This third sell signal appeared inside the consolidation range: the price failed to rebound from the lower boundary, and the move is weaker than a third sell signal after a breakdown, so position size should be kept small.
Looking at the next two higher timeframes, both the 4-hour chart and the daily chart are below their respective consolidation ranges. The broader trend is aligned to the downside, confirming the third sell signal.
Stop-loss at 0.13570 (about 2.9% from entry); take-profit at 0.12390. Losses are limited, while gains have room to grow.
$FET $BTC $ETH #缠论 #Stablecoin contraction
The consolidation range is 0.13010–0.13370, and the price is still fluctuating within it.
This third sell signal appeared inside the consolidation range: the price failed to rebound from the lower boundary, and the move is weaker than a third sell signal after a breakdown, so position size should be kept small.
Looking at the next two higher timeframes, both the 4-hour chart and the daily chart are below their respective consolidation ranges. The broader trend is aligned to the downside, confirming the third sell signal.
Stop-loss at 0.13570 (about 2.9% from entry); take-profit at 0.12390. Losses are limited, while gains have room to grow.
$FET $BTC $ETH #缠论 #Stablecoin contraction
1
134
·
--
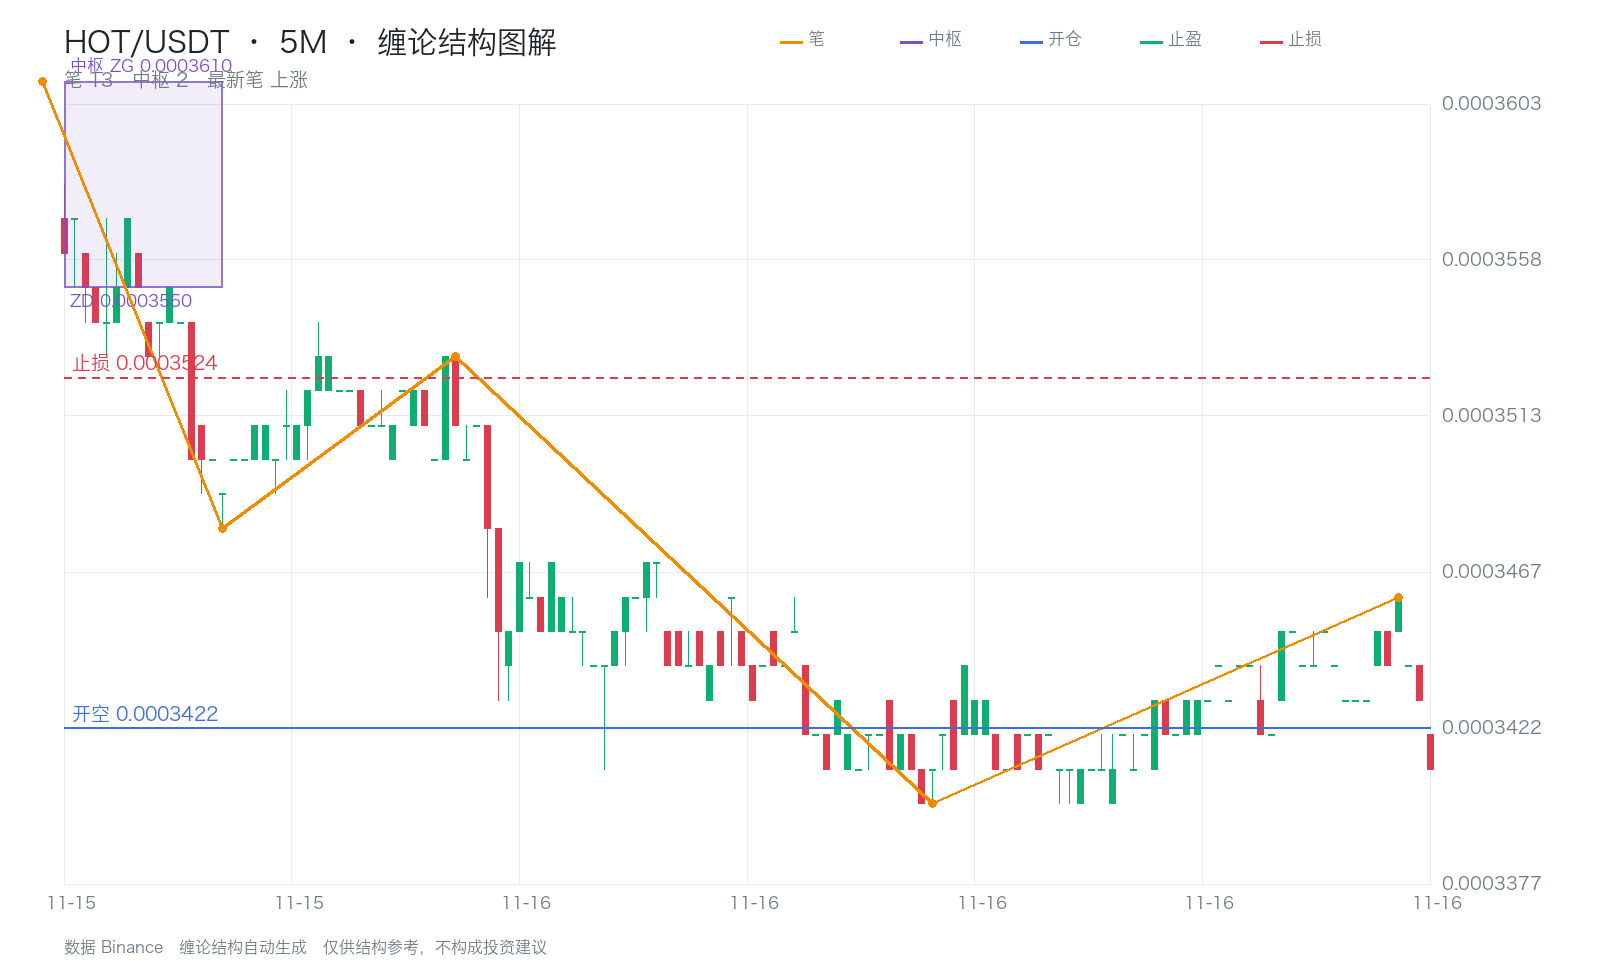
HOT 5-minute chart shows a 3-sell signal; short entry at 0.0003422.
The central pivot zone it just left was 0.0003550–0.0003610. After breaking below it, the price has not returned to the zone.
According to Chan theory, when the first rebound after a break below the central pivot zone fails to re-enter it, that is a 3-sell signal—the textbook short-entry point.
Looking at the two higher timeframes, both the 4-hour and daily charts are below their respective central pivot zones. The broader trend is aligned to the downside, confirming the 3-sell signal.
Stop-loss: 0.0003524 (about 3.0% to exit); take-profit: 0.0003216. Limited downside, amplified upside.
$HOT $BTC $ETH #缠论 #StablecoinShrinkage
HOT 5-minute chart shows a 3-sell signal; short entry at 0.0003422.
The central pivot zone it just left was 0.0003550–0.0003610. After breaking below it, the price has not returned to the zone.
According to Chan theory, when the first rebound after a break below the central pivot zone fails to re-enter it, that is a 3-sell signal—the textbook short-entry point.
Looking at the two higher timeframes, both the 4-hour and daily charts are below their respective central pivot zones. The broader trend is aligned to the downside, confirming the 3-sell signal.
Stop-loss: 0.0003524 (about 3.0% to exit); take-profit: 0.0003216. Limited downside, amplified upside.
$HOT $BTC $ETH #缠论 #StablecoinShrinkage
The central pivot zone it just left was 0.0003550–0.0003610. After breaking below it, the price has not returned to the zone.
According to Chan theory, when the first rebound after a break below the central pivot zone fails to re-enter it, that is a 3-sell signal—the textbook short-entry point.
Looking at the two higher timeframes, both the 4-hour and daily charts are below their respective central pivot zones. The broader trend is aligned to the downside, confirming the 3-sell signal.
Stop-loss: 0.0003524 (about 3.0% to exit); take-profit: 0.0003216. Limited downside, amplified upside.
$HOT $BTC $ETH #缠论 #StablecoinShrinkage
85
·
--
I just completed a new trade! Copy my portfolio with one click 👇
I just completed a new trade! Copy my portfolio with one click 👇
交易中成长
Open Position
FETUSDTShort 20x
Position Size(USDT)
-2276
Entry Price
0.1317
·
--
I just completed a new trade! Copy my portfolio with one click 👇
I just completed a new trade! Copy my portfolio with one click 👇
交易中成长
Open Position
HOTUSDTShort 20x
Position Size(USDT)
-292227
Entry Price
0.000342
·
--
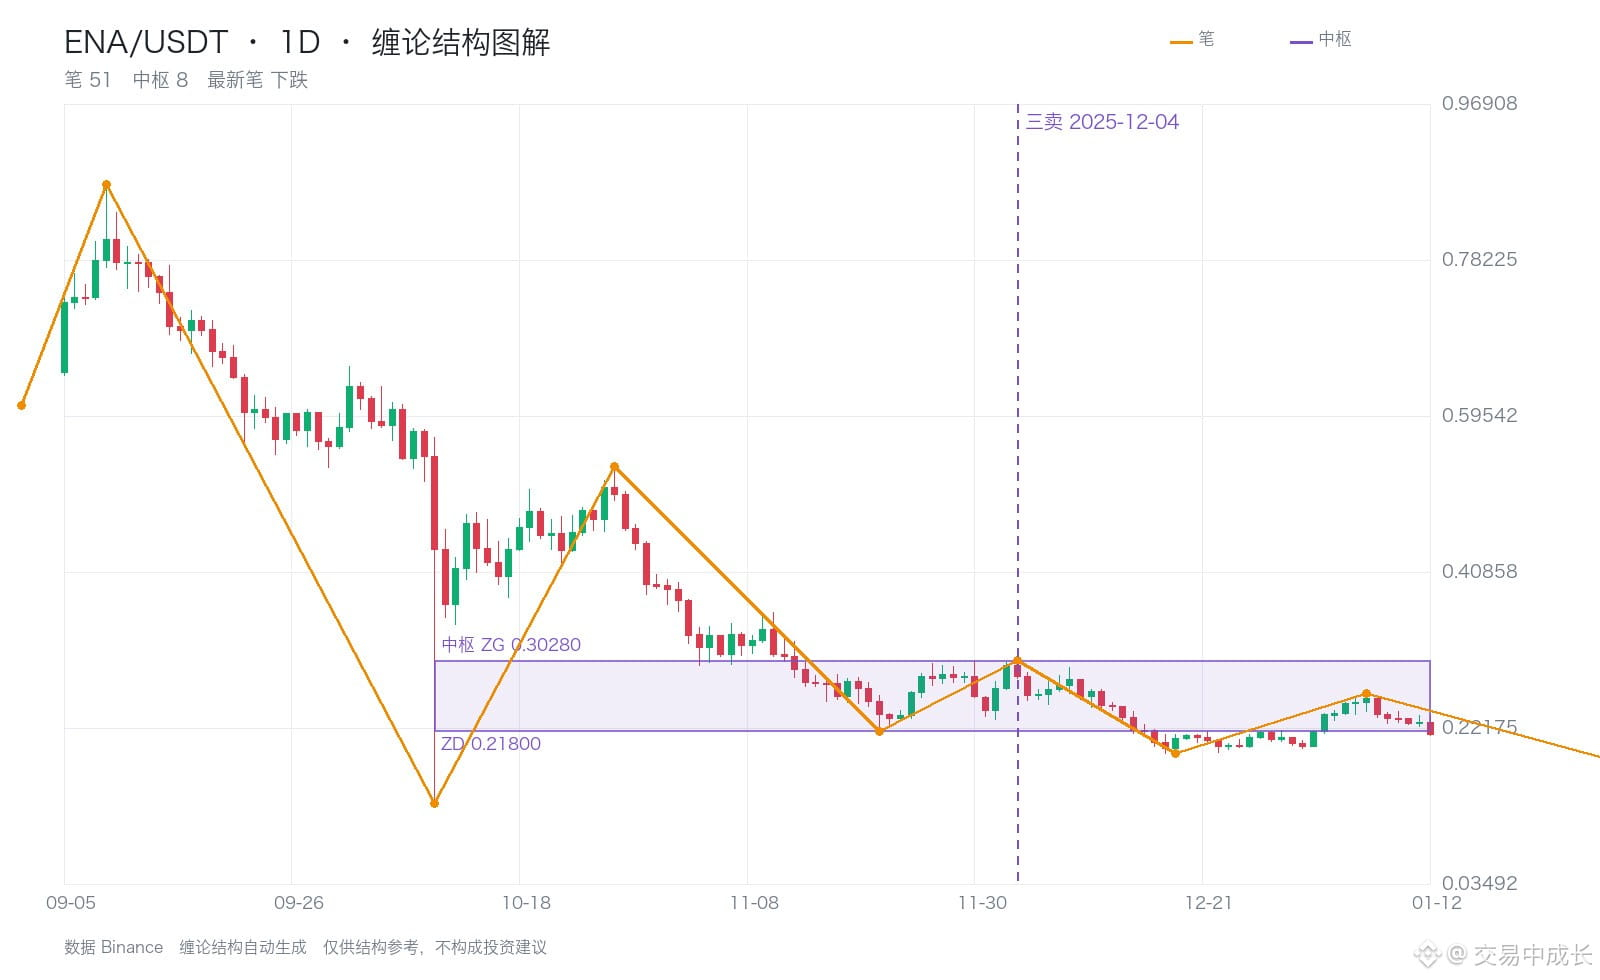
A historical example: On December 4, 2025, ENA showed a third sell signal on the 1d timeframe.
At the time, the consolidation zone was 0.60750–0.70000. The signal price of 0.30280 was below the lower boundary of the zone at 0.60750, making it a rebound sell point after breaking below the zone.
After the signal appeared, the price fell to a low of 0.19110 within 20 candles, dropping as much as 36.9% from the signal price (closing at 0.20100).
That’s the value of a third sell signal: the zone determines the position, and the stop-loss is placed near the upper boundary of the zone—small losses, big gains.
History doesn’t simply repeat itself, but patterns recur. The more often you see the same setup, the more confident you become in acting on a genuine signal.
$ENA $BTC $ETH #缠论 #StablecoinShrinkage
A historical example: On December 4, 2025, ENA showed a third sell signal on the 1d timeframe.
At the time, the consolidation zone was 0.60750–0.70000. The signal price of 0.30280 was below the lower boundary of the zone at 0.60750, making it a rebound sell point after breaking below the zone.
After the signal appeared, the price fell to a low of 0.19110 within 20 candles, dropping as much as 36.9% from the signal price (closing at 0.20100).
That’s the value of a third sell signal: the zone determines the position, and the stop-loss is placed near the upper boundary of the zone—small losses, big gains.
History doesn’t simply repeat itself, but patterns recur. The more often you see the same setup, the more confident you become in acting on a genuine signal.
$ENA $BTC $ETH #缠论 #StablecoinShrinkage
At the time, the consolidation zone was 0.60750–0.70000. The signal price of 0.30280 was below the lower boundary of the zone at 0.60750, making it a rebound sell point after breaking below the zone.
After the signal appeared, the price fell to a low of 0.19110 within 20 candles, dropping as much as 36.9% from the signal price (closing at 0.20100).
That’s the value of a third sell signal: the zone determines the position, and the stop-loss is placed near the upper boundary of the zone—small losses, big gains.
History doesn’t simply repeat itself, but patterns recur. The more often you see the same setup, the more confident you become in acting on a genuine signal.
$ENA $BTC $ETH #缠论 #StablecoinShrinkage
83
Log in to explore more content
Join global crypto users on Binance Square
⚡️ Get latest and useful information about crypto.
💬 Trusted by the world’s largest crypto exchange.
👍 Discover real insights from verified creators.
Email / Phone number
Trending Topics
A Packed Week of Earnings and Data Tests Markets
70 views
27 Discussing
Nvidia Earnings, Fed Minutes and Anthropic IPO Set to Test AI Stocks and Crypto
Binance News
·137 Likes
·12k views
HuangReportedlyConsidersReturnToNvidia
6,263 views
130 Discussing
CryptoSelloffTriggersMultipleWhaleLiquidations
252,516 views
2,164 Discussing