

OG GrAcE
14 Posts

OG GrAcE
OG GrAcE 💰📊🤲
Open Trade
Frequent Trader
3.5 Years
35 Following
34 Followers
44 Liked
Posts
Portfolio
All
Quotes
PINNED
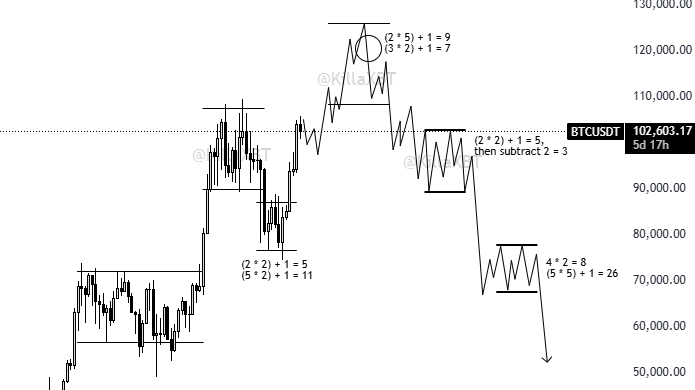


CRYPTO MECHANIC
·
--
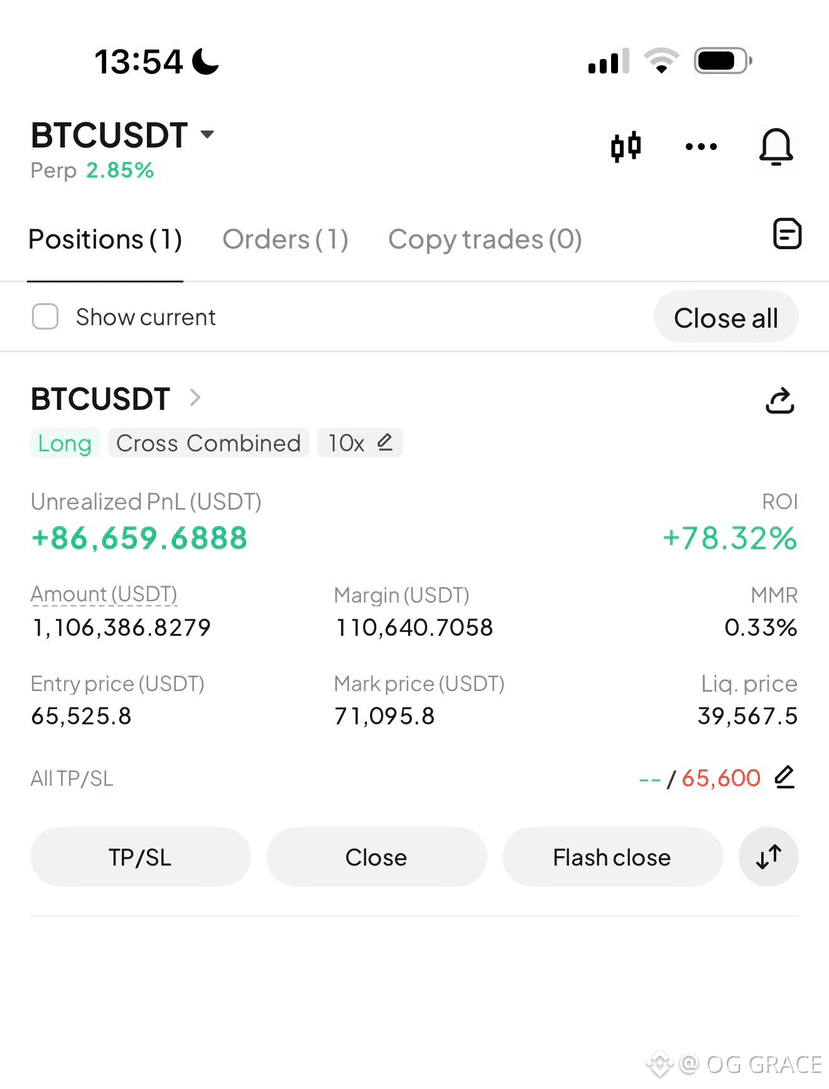
Someone with a lot of money will get liquidated.
Someone with less money will get liquidated.
Someone with years of experience will get caught.
Someone who just started will get caught.
Someone with a lot of knowledge can mess up leverage.
Someone can mess up position sizing.
Someone can ignore risk management.
Someone can overtrade.
Someone can get too emotional.
Someone can become overconfident after a few wins.
Someone can panic after a few losses.
Someone can refuse to accept they’re wrong.
Someone can keep averaging into a losing position.
Someone can chase every pump.
The market has unbelievable ways of punishing everyone.
It doesn’t care who you are.
Respect risk, or the market will teach you to.
Someone with less money will get liquidated.
Someone with years of experience will get caught.
Someone who just started will get caught.
Someone with a lot of knowledge can mess up leverage.
Someone can mess up position sizing.
Someone can ignore risk management.
Someone can overtrade.
Someone can get too emotional.
Someone can become overconfident after a few wins.
Someone can panic after a few losses.
Someone can refuse to accept they’re wrong.
Someone can keep averaging into a losing position.
Someone can chase every pump.
The market has unbelievable ways of punishing everyone.
It doesn’t care who you are.
Respect risk, or the market will teach you to.
OG GrAcE
·
--
SOL/USDT 4H Chart Analysis: Is Solana Finding Its Footing or Headed for Another Drop?
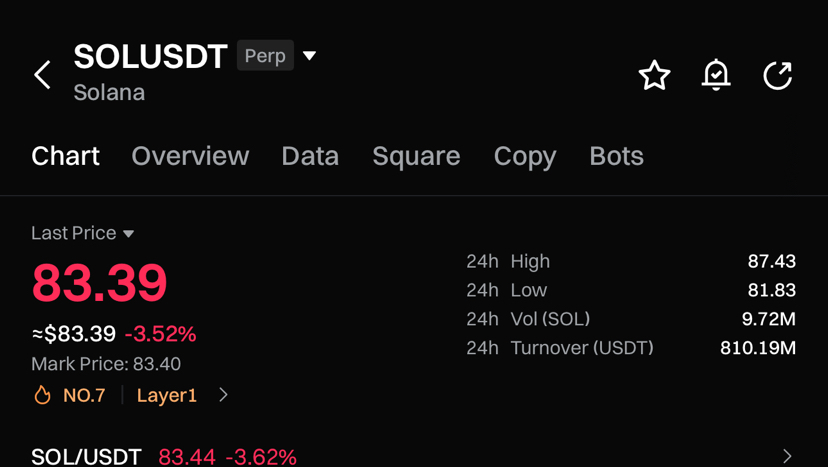
Solana (SOL) is currently trading around $83, down over 3%, and the 4-hour chart is telling an important story that traders and investors should not ignore.
Rather than guessing, let’s break down what the price action, indicators, and structure are clearly showing.
1. Market Structure: Still Under Pressure
On the 4H timeframe, SOL remains in a short-term downtrend.
Price is trading below key moving averages (EMA 20, EMA 50, and MA 100/200).
Each bounce is getting sold into, creating lower highs.
This confirms that bears are still in control for now.
Until SOL reclaims and holds above $86–$88, the structure remains weak.
2. Key Support & Demand Zone
A strong reaction occurred around $81.8, which aligns with:
• A recent swing low
Psychological demand area
This zone is acting as temporary support. If this level fails convincingly, the next downside targets are:
$80$76–$74 (higher-timeframe demand)
However, as long as $81–$82 holds, a short-term relief bounce is possible.
3. Indicators Insight
RSI (4H):
RSI is hovering around 37–40, approaching oversold territory.This suggests selling momentum is slowing, not reversing yet.MACD: • Still bearish but flattening. • Histogram shows weakening downside momentum, often seen before consolidation or a small bounce.Volume: • Declining volume indicates panic selling is cooling off. • This usually leads to range movement, not an immediate pump.4. Scenarios to Watch
Bullish Scenario (Relief Bounce):Hold above $81.8Reclaim $85
Target $88–$90 (major resistance)Bearish Scenario (Continuation):Clean breakdown below $81Increased volume on sell-side
Move toward $76–$74This is not a confirmed reversal zone yet — it’s a decision area. • Short-term traders should wait for confirmation. • Long-term holders may see this as accumulation territory, not leverage territory. • Patience here is more profitable than prediction.The market rewards discipline, not emotions.📊 Always manage risk and trade what you see, not what you hope.
Rather than guessing, let’s break down what the price action, indicators, and structure are clearly showing.
1. Market Structure: Still Under Pressure
On the 4H timeframe, SOL remains in a short-term downtrend.
Price is trading below key moving averages (EMA 20, EMA 50, and MA 100/200).
Each bounce is getting sold into, creating lower highs.
This confirms that bears are still in control for now.
Until SOL reclaims and holds above $86–$88, the structure remains weak.
2. Key Support & Demand Zone
A strong reaction occurred around $81.8, which aligns with:
• A recent swing low
Psychological demand area
This zone is acting as temporary support. If this level fails convincingly, the next downside targets are:
$80$76–$74 (higher-timeframe demand)
However, as long as $81–$82 holds, a short-term relief bounce is possible.
3. Indicators Insight
RSI (4H):
RSI is hovering around 37–40, approaching oversold territory.This suggests selling momentum is slowing, not reversing yet.MACD: • Still bearish but flattening. • Histogram shows weakening downside momentum, often seen before consolidation or a small bounce.Volume: • Declining volume indicates panic selling is cooling off. • This usually leads to range movement, not an immediate pump.4. Scenarios to Watch
Bullish Scenario (Relief Bounce):Hold above $81.8Reclaim $85
Target $88–$90 (major resistance)Bearish Scenario (Continuation):Clean breakdown below $81Increased volume on sell-side
Move toward $76–$74This is not a confirmed reversal zone yet — it’s a decision area. • Short-term traders should wait for confirmation. • Long-term holders may see this as accumulation territory, not leverage territory. • Patience here is more profitable than prediction.The market rewards discipline, not emotions.📊 Always manage risk and trade what you see, not what you hope.
Log in to explore more content