
Decrypted Labs
1.4k Posts

Decrypted Labs
Report
Block User
Sharing insights on Crypto, NFTs, WEB 3 | BNB - BTC HOLDER
13 Following
23.0K+ Followers
13.6K+ Liked
Posts
All
Quotes
Videos
PINNED
I made $2M from $8k in 2023, here are my top 60 tokens for 2024 bull run:
➮ AI: $TAO, $AGRS, $PAAL, $RNDR, $AKT, $FET, $PRIME, $AIOZ, $ORAI, $ABT, $ALEPH, $GHX, $AIT, $OPSEC, $NMT
➮ DePin: $FIL, $RNDR, $HNT, $THETA, $OCEAN, $ANKR, $HONEY
➮ L1: $KAS, $INJ, $KUJI, $MONAD, $ASTR, $RON, $SUI, $SEI
➮ GameFi: $MAVIA, $RON, $GALA, #BIGTIME, $ALICE, $MAGIC, $WILD, $SIDUS
➮ RWA: $SNX, $MKR, $CFG, $RBN, $POLYX
➮ L2: #STRK, #ARB, #METIS, #BOBA, #IMX
➮ BRC-20: $SAVM, #MUBI, #ORDI
➮ Modular: #TIA, #DYM, #GEL
Restaking : #RSTK, #EIGEN
Derivatives : #MCB, #AEVO, #DYDX
#Write2Earn
I made $2M from $8k in 2023, here are my top 60 tokens for 2024 bull run:
➮ AI: $TAO, $AGRS, $PAAL, $RNDR, $AKT, $FET, $PRIME, $AIOZ, $ORAI, $ABT, $ALEPH, $GHX, $AIT, $OPSEC, $NMT
➮ DePin: $FIL, $RNDR, $HNT, $THETA, $OCEAN, $ANKR, $HONEY
➮ L1: $KAS, $INJ, $KUJI, $MONAD, $ASTR, $RON, $SUI, $SEI
➮ GameFi: $MAVIA, $RON, $GALA, #BIGTIME, $ALICE, $MAGIC, $WILD, $SIDUS
➮ RWA: $SNX, $MKR, $CFG, $RBN, $POLYX
➮ L2: #STRK, #ARB, #METIS, #BOBA, #IMX
➮ BRC-20: $SAVM, #MUBI, #ORDI
➮ Modular: #TIA, #DYM, #GEL
Restaking : #RSTK, #EIGEN
Derivatives : #MCB, #AEVO, #DYDX
#Write2Earn
➮ AI: $TAO, $AGRS, $PAAL, $RNDR, $AKT, $FET, $PRIME, $AIOZ, $ORAI, $ABT, $ALEPH, $GHX, $AIT, $OPSEC, $NMT
➮ DePin: $FIL, $RNDR, $HNT, $THETA, $OCEAN, $ANKR, $HONEY
➮ L1: $KAS, $INJ, $KUJI, $MONAD, $ASTR, $RON, $SUI, $SEI
➮ GameFi: $MAVIA, $RON, $GALA, #BIGTIME, $ALICE, $MAGIC, $WILD, $SIDUS
➮ RWA: $SNX, $MKR, $CFG, $RBN, $POLYX
➮ L2: #STRK, #ARB, #METIS, #BOBA, #IMX
➮ BRC-20: $SAVM, #MUBI, #ORDI
➮ Modular: #TIA, #DYM, #GEL
Restaking : #RSTK, #EIGEN
Derivatives : #MCB, #AEVO, #DYDX
#Write2Earn

71
9
204
443.3k
PINNED

Article
Finding New CoinsSome of the craziest returns of 5X, 10X, 50X, or even more are achieved by people who find new coins early on-chain and hold them as they explode in growth. Here’s how you can start researching and finding these coins for yourself 👇🏼 Finding New Coins:There are a few key metrics to look at to determine how early you are to a coin:-Market Cap:This is the most important metric to check as it directly affects how much room for future growth a coin has. With new high risk / high reward coins, you are going to be looking for gains of multiple Xs. If a coin is at a market cap of $500k then it can 20X and still only be at a market cap of $10M. However, if a coin is already at a market cap of $2M then reaching that same $10M market cap target would be a 5X. What market cap range you look for when deciding whether to buy a coin or when to take profit depends on your personal view of the potential of the coin. If you find a project with real utility in a sector of crypto with a lot of demand, or a project that offers improvements over existing products/services then you may aim for higher. On the other hand, if you were just lucky to be early to a coin taking advantage of a short term source of hype then you may want to take profits on the way up rather than hold longer term.-Liquidity:Most new coins do not launch with significant liquidity. If you are working with less capital then this can actually be an advantage for you in some cases. When a coin has lower liquidity, it means that large buys/sells will move price more. It also means that volatility will generally be greater as it takes less volume to move price significantly. If a coin has real potential but low liquidity, then entering with a small amount can allow you to be early without suffering too much from slippage. Then, if the coin takes off, liquidity can improve as more is added or it gets listed on more exchanges (centralized or decentralized) which can allow larger players to then buy as well.-Holders:You can check on-chain how many holders a coin has. Clearly, the lower the number of holders is, the earlier you are.-Age:You can also check on-chain to see when the smart contract for a coin was deployed and when it was first listed on a decentralized exchange to determine exactly how new a project is.Strategy:The easiest way to start scanning new coins and checking the characteristics I just covered is through DexScreener. Very new coins won’t always be listed on CoinGecko or CoinMarketCap yet, but DexScreener lists coins as soon as they are added to a dex. It also displays price, market cap, volume, liquidity, FDV, and other metrics to make it easy to decide which coins to give a deeper look. You can also filter all the new coins by characteristics such as age, liquidity, what chain they are on, price change, and more. There are a few reasons a coin may catch your attention: large number of trades being taken, large price increases, significant liquidity being added early on, or even just the name of the coin. Regardless, once you see a coin you want to learn more about you can click on it to open the chart and see more details. Here’s what to check next:-Name/Contract Address:You can search the name and/or contract address of a coin on twitter and do a quick scan for any red flags or or positive signs. Red flags would include credible information that the coin may be a scam/rug or that the team/dev is dumping early on. Positive signs could include an active twitter page for the project, a community around it, or traders with strong track records following/mentioning it.-Holders/Liquidity Providers:If one or a few addresses hold a significant portion of a coin’s supply it is worth figuring out why. One of the larger holders will usually be the liquidity pool for the dex, but it is also possible that a team/dev reserved a large portion of the tokens for themselves. It is a good sign if the LP tokens for the pool and any team/dev allocations are locked at least for a fair period of time as this incentivizes them to grow the project and removes concerns about immediate dumping. Another reason an address may hold a large portion of the supply is if they were extremely early or sniped the token launch to buy a lot of coins for very cheap. If this is the case, they will almost always dump the tokens at some point. However, if the project has real potential then that dump could provide a good entry.Risk Management:It is absolutely essential to practice strong risk management when trading new coins. It is completely possible for a new coin to go to 0 and for your investment to end up worthless. That is the risk you take in exchange for the potentially massive rewards. However, if you implement risk management procedures then you can lower that risk.-Portfolio Allocation:You should not be risking any amount you are not willing to lose on new coins. Even if a new coin does end up going 10X or more, it is very common for there to be corrections of -50% or more during that uptrend due to the extreme volatility of microcap coins. If you are overinvested then these corrections could cause you to panic sell and miss out on the subsequent gains. On the other hand, if you are comfortable with the amount you invested then you will be able to remain calm and hold through the volatility.-Taking Profits:So you did the research, found a promising coin early on, and have made some crazy returns … don’t be scared to take profits if the amount you made is significant to you personally. It is very easy to see someone else on twitter making a 6 figure trade or holding a memecoin for 1000X and feel like your own gains are small in comparison. Unfortunately, this has led to many people refusing to take profits and giving back life-changing profits. Don’t let that happen to you. You can always take at least partial profits and continue holding some coins in case the uptrend continues.
Finding New Coins
Some of the craziest returns of 5X, 10X, 50X, or even more are achieved by people who find new coins early on-chain and hold them as they explode in growth. Here’s how you can start researching and finding these coins for yourself 👇🏼 Finding New Coins:There are a few key metrics to look at to determine how early you are to a coin:-Market Cap:This is the most important metric to check as it directly affects how much room for future growth a coin has. With new high risk / high reward coins, you are going to be looking for gains of multiple Xs. If a coin is at a market cap of $500k then it can 20X and still only be at a market cap of $10M. However, if a coin is already at a market cap of $2M then reaching that same $10M market cap target would be a 5X. What market cap range you look for when deciding whether to buy a coin or when to take profit depends on your personal view of the potential of the coin. If you find a project with real utility in a sector of crypto with a lot of demand, or a project that offers improvements over existing products/services then you may aim for higher. On the other hand, if you were just lucky to be early to a coin taking advantage of a short term source of hype then you may want to take profits on the way up rather than hold longer term.-Liquidity:Most new coins do not launch with significant liquidity. If you are working with less capital then this can actually be an advantage for you in some cases. When a coin has lower liquidity, it means that large buys/sells will move price more. It also means that volatility will generally be greater as it takes less volume to move price significantly. If a coin has real potential but low liquidity, then entering with a small amount can allow you to be early without suffering too much from slippage. Then, if the coin takes off, liquidity can improve as more is added or it gets listed on more exchanges (centralized or decentralized) which can allow larger players to then buy as well.-Holders:You can check on-chain how many holders a coin has. Clearly, the lower the number of holders is, the earlier you are.-Age:You can also check on-chain to see when the smart contract for a coin was deployed and when it was first listed on a decentralized exchange to determine exactly how new a project is.Strategy:The easiest way to start scanning new coins and checking the characteristics I just covered is through DexScreener. Very new coins won’t always be listed on CoinGecko or CoinMarketCap yet, but DexScreener lists coins as soon as they are added to a dex. It also displays price, market cap, volume, liquidity, FDV, and other metrics to make it easy to decide which coins to give a deeper look. You can also filter all the new coins by characteristics such as age, liquidity, what chain they are on, price change, and more. There are a few reasons a coin may catch your attention: large number of trades being taken, large price increases, significant liquidity being added early on, or even just the name of the coin. Regardless, once you see a coin you want to learn more about you can click on it to open the chart and see more details. Here’s what to check next:-Name/Contract Address:You can search the name and/or contract address of a coin on twitter and do a quick scan for any red flags or or positive signs. Red flags would include credible information that the coin may be a scam/rug or that the team/dev is dumping early on. Positive signs could include an active twitter page for the project, a community around it, or traders with strong track records following/mentioning it.-Holders/Liquidity Providers:If one or a few addresses hold a significant portion of a coin’s supply it is worth figuring out why. One of the larger holders will usually be the liquidity pool for the dex, but it is also possible that a team/dev reserved a large portion of the tokens for themselves. It is a good sign if the LP tokens for the pool and any team/dev allocations are locked at least for a fair period of time as this incentivizes them to grow the project and removes concerns about immediate dumping. Another reason an address may hold a large portion of the supply is if they were extremely early or sniped the token launch to buy a lot of coins for very cheap. If this is the case, they will almost always dump the tokens at some point. However, if the project has real potential then that dump could provide a good entry.Risk Management:It is absolutely essential to practice strong risk management when trading new coins. It is completely possible for a new coin to go to 0 and for your investment to end up worthless. That is the risk you take in exchange for the potentially massive rewards. However, if you implement risk management procedures then you can lower that risk.-Portfolio Allocation:You should not be risking any amount you are not willing to lose on new coins. Even if a new coin does end up going 10X or more, it is very common for there to be corrections of -50% or more during that uptrend due to the extreme volatility of microcap coins. If you are overinvested then these corrections could cause you to panic sell and miss out on the subsequent gains. On the other hand, if you are comfortable with the amount you invested then you will be able to remain calm and hold through the volatility.-Taking Profits:So you did the research, found a promising coin early on, and have made some crazy returns … don’t be scared to take profits if the amount you made is significant to you personally. It is very easy to see someone else on twitter making a 6 figure trade or holding a memecoin for 1000X and feel like your own gains are small in comparison. Unfortunately, this has led to many people refusing to take profits and giving back life-changing profits. Don’t let that happen to you. You can always take at least partial profits and continue holding some coins in case the uptrend continues.
17
12
97
35.5k
Masayoshi Son refused to invest $12 billion in Elon Musk's Tesla in 2017 to help take it private.
That $12 billion investment would be worth about $240 billion today if he had invested.
Masayoshi Son refused to invest $12 billion in Elon Musk's Tesla in 2017 to help take it private.
That $12 billion investment would be worth about $240 billion today if he had invested.
That $12 billion investment would be worth about $240 billion today if he had invested.


101
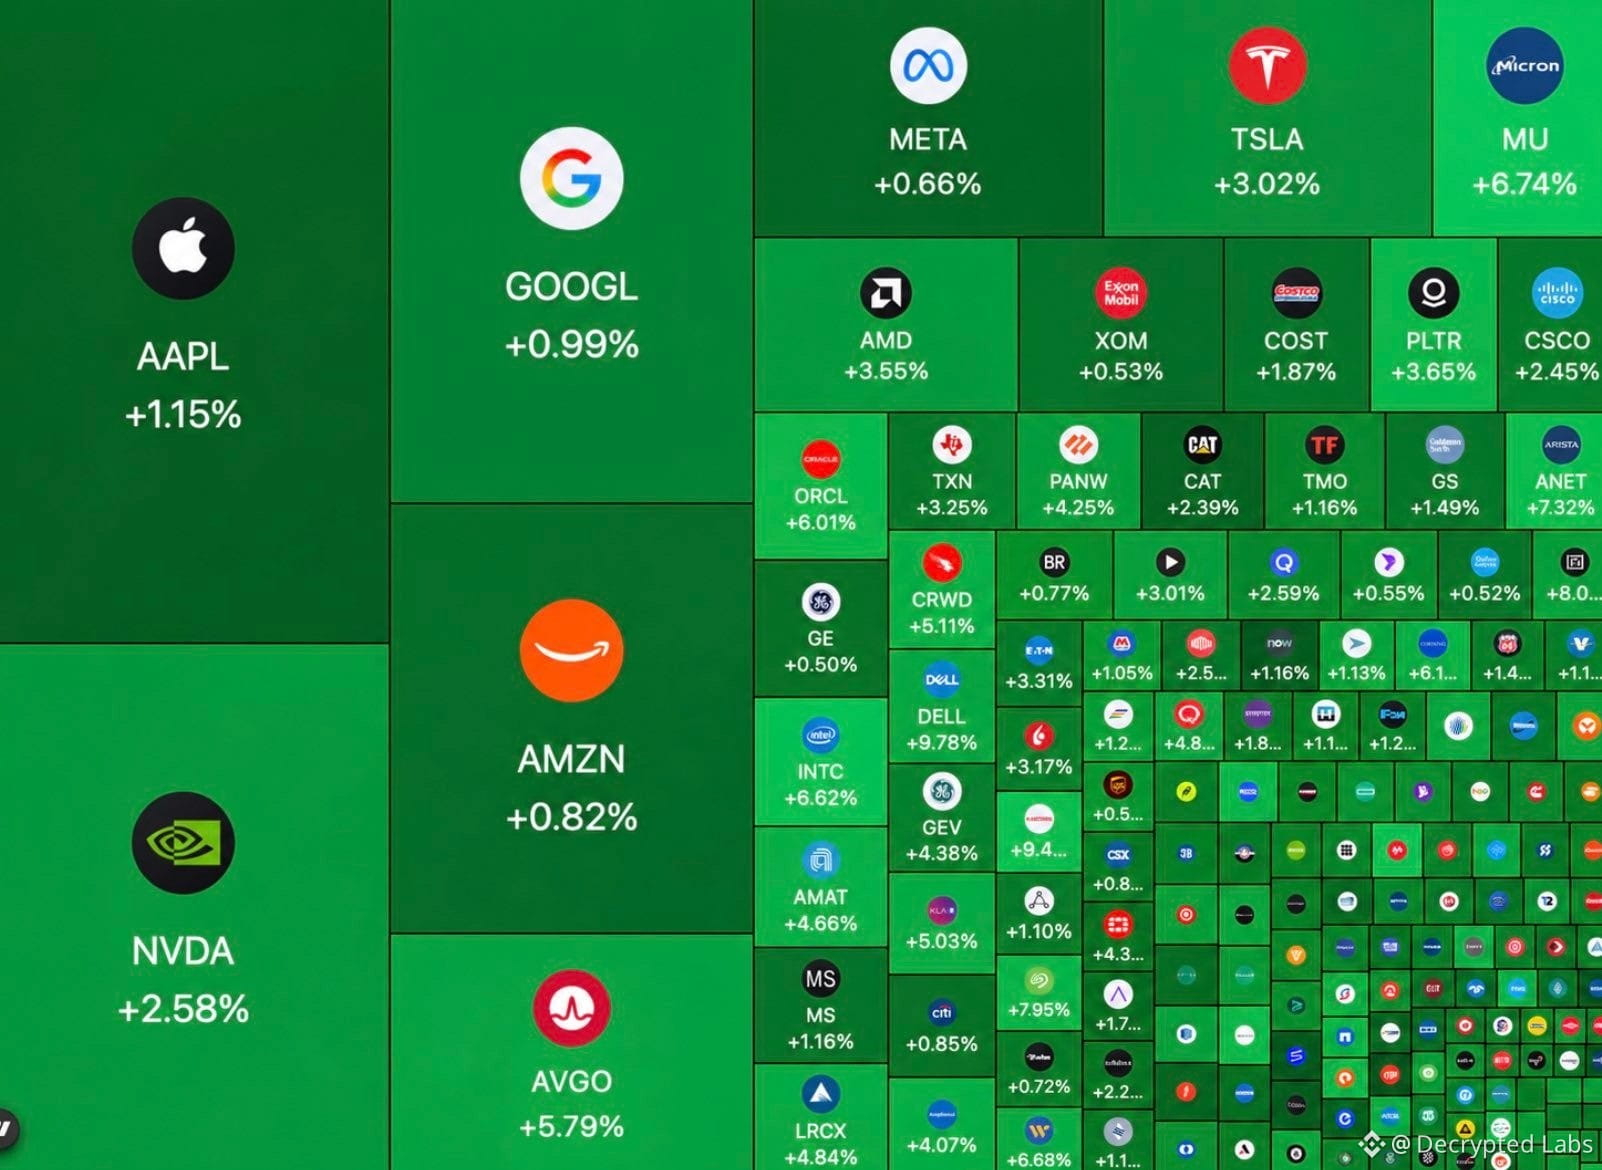
$685 Billion added to the US stock market at open.
$685 Billion added to the US stock market at open.
53
Trading strategy in 2021 - Pattern trading
Trading strategy in 2022 - Candle stick
Trading strategy in 2023 - Wyckoff
Trading strategy in 2024 - Quarterly cycle
Trading strategy in 2025 - ICT
Trading strategy in 2026 - CRT + TBS
Trading strategy in 2027 - ( in comment )
Trading strategy in 2021 - Pattern trading
Trading strategy in 2022 - Candle stick
Trading strategy in 2023 - Wyckoff
Trading strategy in 2024 - Quarterly cycle
Trading strategy in 2025 - ICT
Trading strategy in 2026 - CRT + TBS
Trading strategy in 2027 - ( in comment )
Trading strategy in 2022 - Candle stick
Trading strategy in 2023 - Wyckoff
Trading strategy in 2024 - Quarterly cycle
Trading strategy in 2025 - ICT
Trading strategy in 2026 - CRT + TBS
Trading strategy in 2027 - ( in comment )
83
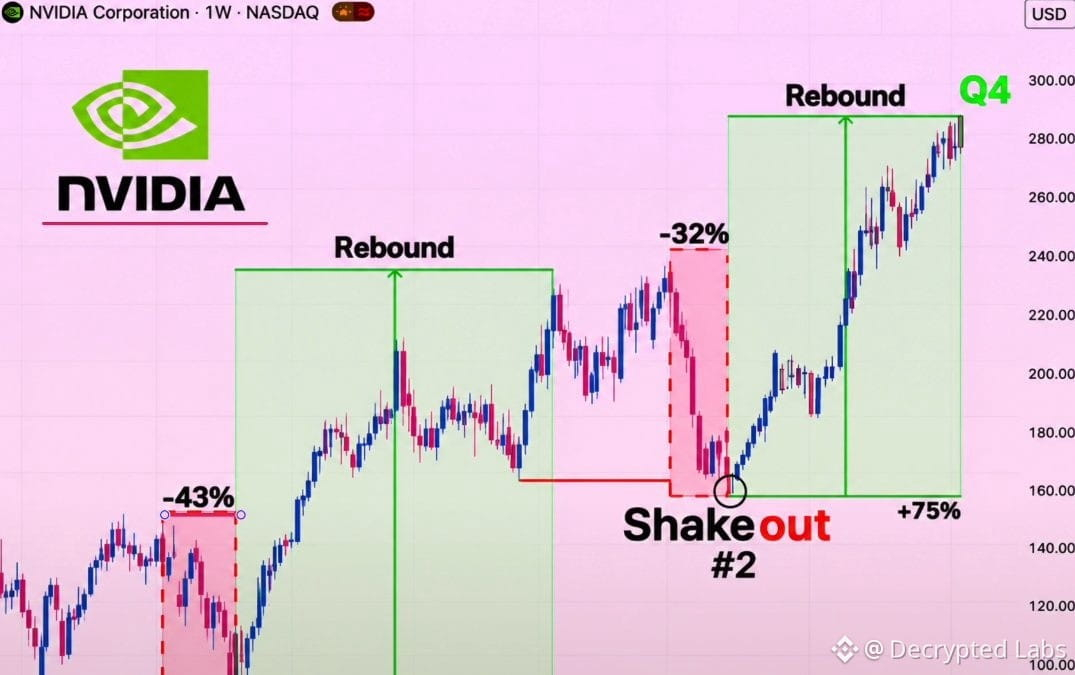
🚨 NVIDIA COULD BE ABOUT TO REPEAT A MOVE THAT SENT ITS STOCK UP 173%.
And I believe most investors will miss it AGAIN.
LOOK AT THIS CHART.
The last time $NVDA experienced a major shakeout, here's what happened:
-43% CRASH → +173% RALLY.
Now a remarkably similar structure is forming.
-32% CRASH → +75% POTENTIAL RALLY.
COINCIDENCE?
Maybe. But I'm not ignoring it.
First, the market destroys confidence.
Retail panics.
Everyone starts calling for a much bigger crash.
Then the selling dries up.
Buyers return.
And suddenly, the same stock everyone was terrified to touch starts exploding higher.
MY Q4 TARGET: $290.
That's roughly 75% upside from the projected $160 shakeout low.
But there's one condition.
I WANT TO SEE THE REVERSAL CONFIRMED FIRST.
Historical patterns don't guarantee future returns, and this setup can still fail.
I'm watching the structure, not blindly buying every dip.
SAVE THIS CHART.
Come back in Q4 and compare.
Follow + turn notifications on.
I'll post my next major $NVDA update here FIRST.
THE CROWD PANICS DURING THE SHAKEOUT.
THEN CHASES THE STOCK AFTER THE RECOVERY.
I'M WATCHING FOR THE OPPORTUNITY BEFORE THE CROWD RETURNS.
🚨 NVIDIA COULD BE ABOUT TO REPEAT A MOVE THAT SENT ITS STOCK UP 173%.
And I believe most investors will miss it AGAIN.
LOOK AT THIS CHART.
The last time $NVDA experienced a major shakeout, here's what happened:
-43% CRASH → +173% RALLY.
Now a remarkably similar structure is forming.
-32% CRASH → +75% POTENTIAL RALLY.
COINCIDENCE?
Maybe. But I'm not ignoring it.
First, the market destroys confidence.
Retail panics.
Everyone starts calling for a much bigger crash.
Then the selling dries up.
Buyers return.
And suddenly, the same stock everyone was terrified to touch starts exploding higher.
MY Q4 TARGET: $290.
That's roughly 75% upside from the projected $160 shakeout low.
But there's one condition.
I WANT TO SEE THE REVERSAL CONFIRMED FIRST.
Historical patterns don't guarantee future returns, and this setup can still fail.
I'm watching the structure, not blindly buying every dip.
SAVE THIS CHART.
Come back in Q4 and compare.
Follow + turn notifications on.
I'll post my next major $NVDA update here FIRST.
THE CROWD PANICS DURING THE SHAKEOUT.
THEN CHASES THE STOCK AFTER THE RECOVERY.
I'M WATCHING FOR THE OPPORTUNITY BEFORE THE CROWD RETURNS.
And I believe most investors will miss it AGAIN.
LOOK AT THIS CHART.
The last time $NVDA experienced a major shakeout, here's what happened:
-43% CRASH → +173% RALLY.
Now a remarkably similar structure is forming.
-32% CRASH → +75% POTENTIAL RALLY.
COINCIDENCE?
Maybe. But I'm not ignoring it.
First, the market destroys confidence.
Retail panics.
Everyone starts calling for a much bigger crash.
Then the selling dries up.
Buyers return.
And suddenly, the same stock everyone was terrified to touch starts exploding higher.
MY Q4 TARGET: $290.
That's roughly 75% upside from the projected $160 shakeout low.
But there's one condition.
I WANT TO SEE THE REVERSAL CONFIRMED FIRST.
Historical patterns don't guarantee future returns, and this setup can still fail.
I'm watching the structure, not blindly buying every dip.
SAVE THIS CHART.
Come back in Q4 and compare.
Follow + turn notifications on.
I'll post my next major $NVDA update here FIRST.
THE CROWD PANICS DURING THE SHAKEOUT.
THEN CHASES THE STOCK AFTER THE RECOVERY.
I'M WATCHING FOR THE OPPORTUNITY BEFORE THE CROWD RETURNS.
296
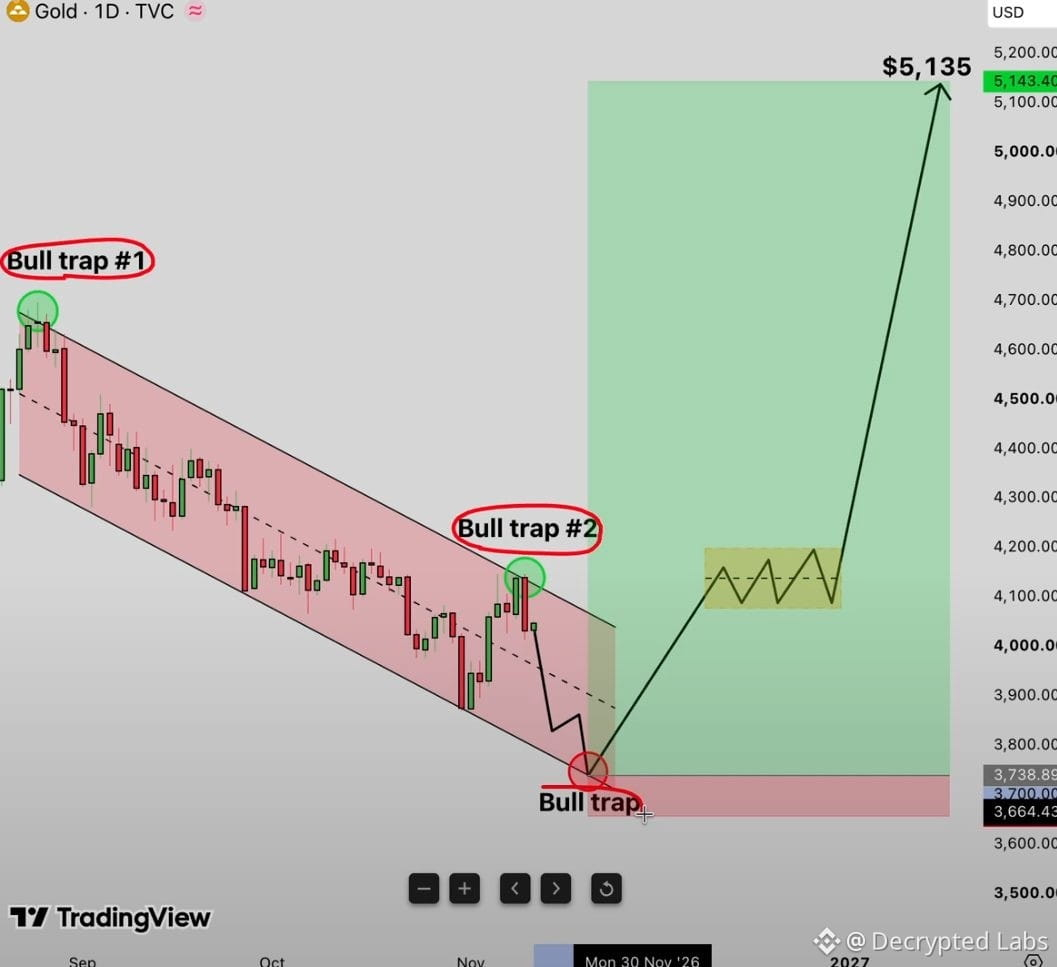
🚨 Gold trap confirmed
Second rejection at $4,150
Same spot, same story as August
$4,000 → $3,900 → $3,800 → $3,700
$3,700 is where I expect the bottom
Save this, check back in a few weeks
$GOLD.US $AAPLB
🚨 Gold trap confirmed
Second rejection at $4,150
Same spot, same story as August
$4,000 → $3,900 → $3,800 → $3,700
$3,700 is where I expect the bottom
Save this, check back in a few weeks
$GOLD.US $AAPLB
Second rejection at $4,150
Same spot, same story as August
$4,000 → $3,900 → $3,800 → $3,700
$3,700 is where I expect the bottom
Save this, check back in a few weeks
$GOLD.US $AAPLB
2
368
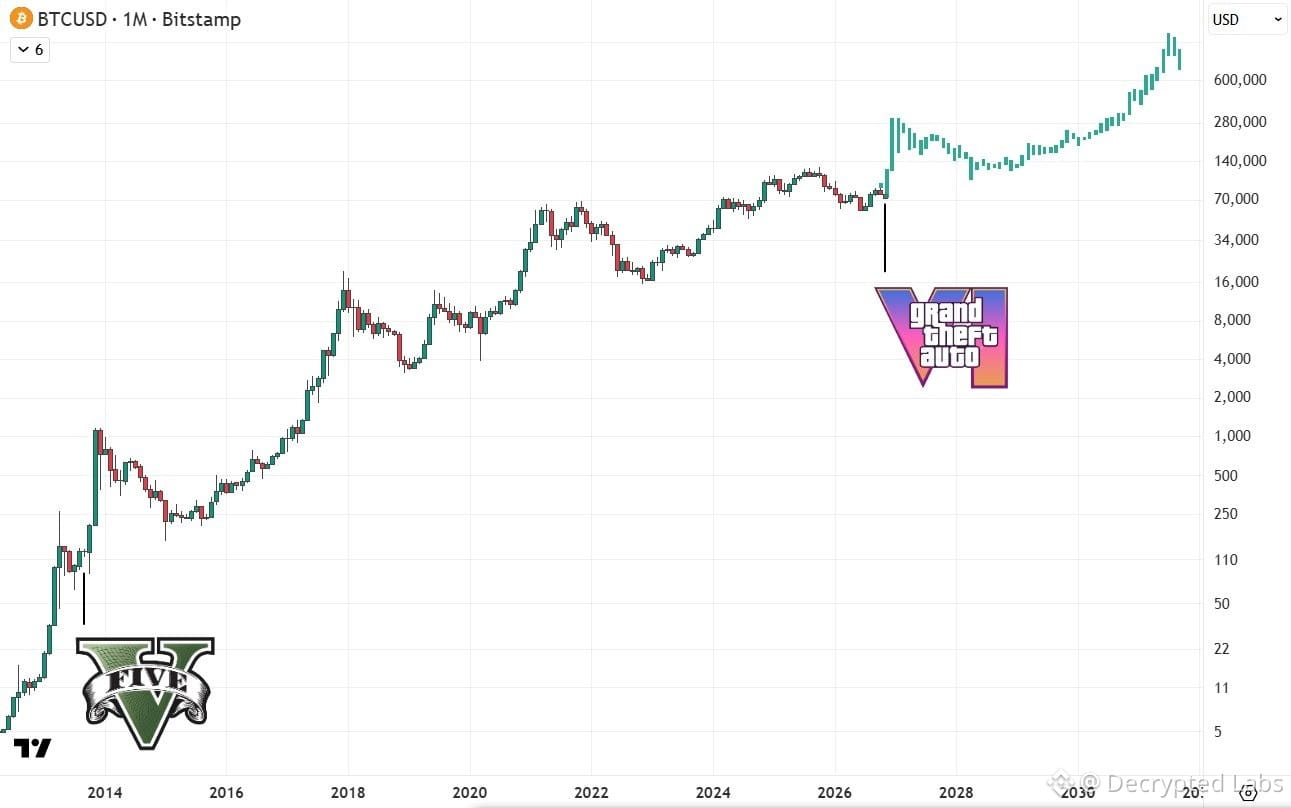
GTA V launched in 2013
$BTC made 9x in 3 months right after.
GTA VI drops this month.
What happens next?
#BitcoinFiveWeeklyLosses #BTC #GTAVI
GTA V launched in 2013
$BTC made 9x in 3 months right after.
GTA VI drops this month.
What happens next?
#BitcoinFiveWeeklyLosses #BTC #GTAVI
$BTC made 9x in 3 months right after.
GTA VI drops this month.
What happens next?
#BitcoinFiveWeeklyLosses #BTC #GTAVI
317
Article
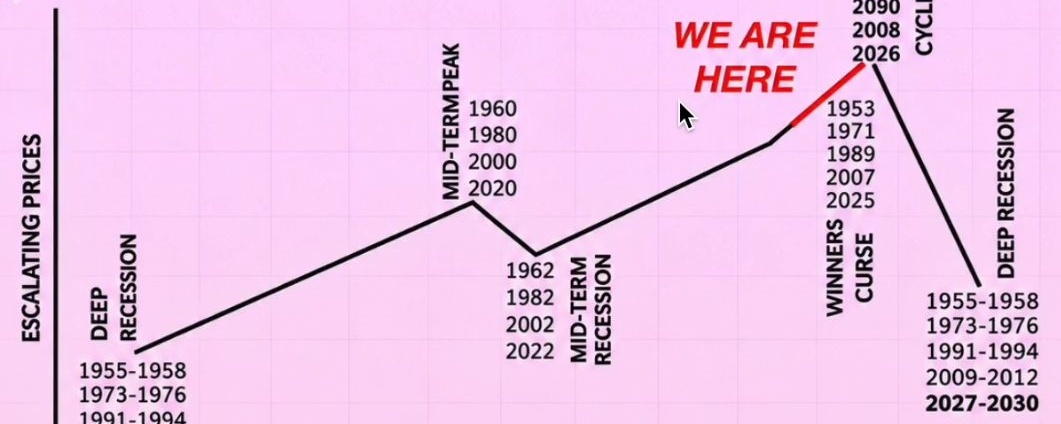
THE NEXT GLOBAL FINANCIAL CRISIS MAY HAVE ALREADY STARTED.And almost nobody is watching the market where the real danger is building.
NOT BITCOIN.
NOT STOCKS.
THE $30+ TRILLION U.S. TREASURY MARKET.
Something is happening beneath the surface, and I believe 2026–2027 could become one of the most dangerous periods for global markets in decades.
READ THIS CAREFULLY.
Everyone is distracted by recession headlines, geopolitical tensions and the next Fed decision.
Meanwhile, the bond market is flashing warning signs.
The MOVE index is one of the indicators I'm watching.
Because when Treasury volatility rises and liquidity deteriorates, the damage doesn't necessarily stay in bonds.
It can spread through the entire financial system.
AND THREE MAJOR ECONOMIES ARE AT THE CENTER OF THIS RISK.
1. THE UNITED STATES 🇺🇸
America is facing enormous refinancing needs.
Government deficits remain elevated.
Interest expenses are consuming an increasingly large share of federal resources.
And higher borrowing costs make the problem worse.
Here's the danger.
If Treasury demand weakens while refinancing needs remain enormous, yields could rise sharply.
Higher yields mean tighter financial conditions.
Tighter conditions mean less liquidity for stocks, crypto and other risk assets.
THIS IS HOW A BOND MARKET PROBLEM CAN BECOME EVERYONE'S PROBLEM.
2. JAPAN 🇯🇵
This is the part I believe investors are seriously underestimating.
Japan is a major foreign holder of U.S. Treasuries.
Its financial institutions are deeply connected to global bond markets.
And changes in Bank of Japan policy can disrupt the carry trades that have helped finance risk-taking worldwide.
If Japanese yields rise enough, domestic assets become more attractive.
That could encourage Japanese investors to reduce some foreign exposure.
Now imagine that happening while U.S. Treasury markets are already under pressure.
Foreign selling.
Higher yields.
More volatility.
More forced deleveraging.
THE CONTAGION COULD SPREAD FAST.
3. CHINA 🇨🇳
China has its own financial pressure points.
A prolonged property downturn.
Local-government debt problems.
Weak domestic demand.
And persistent concerns about confidence and growth.
A deeper slowdown could intensify global risk aversion and put additional pressure on financial markets.
Now connect all three.
THE UNITED STATES NEEDS FUNDING.
JAPAN COULD REPATRIATE CAPITAL.
CHINA IS DEALING WITH DEBT AND GROWTH PRESSURES.
And global liquidity is the thread connecting everything.
HERE'S THE SCENARIO I'M WATCHING.
PHASE 1: THE BOND MARKET SHOCK.
Treasury volatility spikes.
Long-term yields rise.
Funding conditions deteriorate.
Investors start reducing leverage.
PHASE 2: THE GLOBAL LIQUIDITY CRUNCH.
The dollar strengthens as demand for liquidity increases.
Stocks come under pressure.
Crypto gets hit.
Forced selling accelerates.
And suddenly, everyone discovers that liquidity matters more than valuations.
PHASE 3: CENTRAL BANK INTERVENTION.
If financial stability is threatened, policymakers could respond with emergency liquidity facilities, swap lines or other measures.
But here's where things get interesting.
THE CRISIS COULD CREATE THE CONDITIONS FOR THE NEXT MAJOR ASSET RALLY.
PHASE 4: THE LIQUIDITY REVERSAL.
If policy eventually turns more accommodative and real yields decline, gold and other hard assets could benefit.
Silver could follow.
Commodities could recover.
And the dollar could eventually weaken.
But that outcome isn't guaranteed.
The timing and scale of any intervention would determine what happens next.
REMEMBER THE UK BOND CRISIS IN 2022?
A relatively contained market shock forced emergency intervention.
Now imagine serious funding stress spreading across several major economies at once.
THAT'S THE RISK I'M WATCHING.
I'm not saying every Treasury auction is about to fail.
I'm not saying a global collapse is guaranteed.
I'm saying the bond market deserves far more attention than it's getting.
Because by the time a liquidity crisis becomes obvious in stock prices, the damage may already be underway.
I've spent over 12 years studying financial markets and major turning points.
And I believe the next few months could be critical.
SAVE THIS POST.
Watch Treasury yields.
Watch the MOVE index.
Watch the dollar.
Watch Japan.
These markets could reveal the next major move before the headlines catch up.
Follow + turn notifications on.
I'll post my next major market call here FIRST.
EVERYONE IS WATCHING THE STOCK MARKET.
I'M WATCHING THE MARKET THAT FINANCES IT.
DON'T WAIT FOR THE PANIC TO START PAYING ATTENTION.
#HotCPIDecemberHikePriced #AnthropicRejectsIPODelayValuationinQuestion #AIChipSlumpNasdaq #BitcoinFiveWeeklyLosses
THE NEXT GLOBAL FINANCIAL CRISIS MAY HAVE ALREADY STARTED.
And almost nobody is watching the market where the real danger is building.
NOT BITCOIN.
NOT STOCKS.
THE $30+ TRILLION U.S. TREASURY MARKET.
Something is happening beneath the surface, and I believe 2026–2027 could become one of the most dangerous periods for global markets in decades.
READ THIS CAREFULLY.
Everyone is distracted by recession headlines, geopolitical tensions and the next Fed decision.
Meanwhile, the bond market is flashing warning signs.
The MOVE index is one of the indicators I'm watching.
Because when Treasury volatility rises and liquidity deteriorates, the damage doesn't necessarily stay in bonds.
It can spread through the entire financial system.
AND THREE MAJOR ECONOMIES ARE AT THE CENTER OF THIS RISK.
1. THE UNITED STATES 🇺🇸
America is facing enormous refinancing needs.
Government deficits remain elevated.
Interest expenses are consuming an increasingly large share of federal resources.
And higher borrowing costs make the problem worse.
Here's the danger.
If Treasury demand weakens while refinancing needs remain enormous, yields could rise sharply.
Higher yields mean tighter financial conditions.
Tighter conditions mean less liquidity for stocks, crypto and other risk assets.
THIS IS HOW A BOND MARKET PROBLEM CAN BECOME EVERYONE'S PROBLEM.
2. JAPAN 🇯🇵
This is the part I believe investors are seriously underestimating.
Japan is a major foreign holder of U.S. Treasuries.
Its financial institutions are deeply connected to global bond markets.
And changes in Bank of Japan policy can disrupt the carry trades that have helped finance risk-taking worldwide.
If Japanese yields rise enough, domestic assets become more attractive.
That could encourage Japanese investors to reduce some foreign exposure.
Now imagine that happening while U.S. Treasury markets are already under pressure.
Foreign selling.
Higher yields.
More volatility.
More forced deleveraging.
THE CONTAGION COULD SPREAD FAST.
3. CHINA 🇨🇳
China has its own financial pressure points.
A prolonged property downturn.
Local-government debt problems.
Weak domestic demand.
And persistent concerns about confidence and growth.
A deeper slowdown could intensify global risk aversion and put additional pressure on financial markets.
Now connect all three.
THE UNITED STATES NEEDS FUNDING.
JAPAN COULD REPATRIATE CAPITAL.
CHINA IS DEALING WITH DEBT AND GROWTH PRESSURES.
And global liquidity is the thread connecting everything.
HERE'S THE SCENARIO I'M WATCHING.
PHASE 1: THE BOND MARKET SHOCK.
Treasury volatility spikes.
Long-term yields rise.
Funding conditions deteriorate.
Investors start reducing leverage.
PHASE 2: THE GLOBAL LIQUIDITY CRUNCH.
The dollar strengthens as demand for liquidity increases.
Stocks come under pressure.
Crypto gets hit.
Forced selling accelerates.
And suddenly, everyone discovers that liquidity matters more than valuations.
PHASE 3: CENTRAL BANK INTERVENTION.
If financial stability is threatened, policymakers could respond with emergency liquidity facilities, swap lines or other measures.
But here's where things get interesting.
THE CRISIS COULD CREATE THE CONDITIONS FOR THE NEXT MAJOR ASSET RALLY.
PHASE 4: THE LIQUIDITY REVERSAL.
If policy eventually turns more accommodative and real yields decline, gold and other hard assets could benefit.
Silver could follow.
Commodities could recover.
And the dollar could eventually weaken.
But that outcome isn't guaranteed.
The timing and scale of any intervention would determine what happens next.
REMEMBER THE UK BOND CRISIS IN 2022?
A relatively contained market shock forced emergency intervention.
Now imagine serious funding stress spreading across several major economies at once.
THAT'S THE RISK I'M WATCHING.
I'm not saying every Treasury auction is about to fail.
I'm not saying a global collapse is guaranteed.
I'm saying the bond market deserves far more attention than it's getting.
Because by the time a liquidity crisis becomes obvious in stock prices, the damage may already be underway.
I've spent over 12 years studying financial markets and major turning points.
And I believe the next few months could be critical.
SAVE THIS POST.
Watch Treasury yields.
Watch the MOVE index.
Watch the dollar.
Watch Japan.
These markets could reveal the next major move before the headlines catch up.
Follow + turn notifications on.
I'll post my next major market call here FIRST.
EVERYONE IS WATCHING THE STOCK MARKET.
I'M WATCHING THE MARKET THAT FINANCES IT.
DON'T WAIT FOR THE PANIC TO START PAYING ATTENTION.
#HotCPIDecemberHikePriced #AnthropicRejectsIPODelayValuationinQuestion #AIChipSlumpNasdaq #BitcoinFiveWeeklyLosses
NOT BITCOIN.
NOT STOCKS.
THE $30+ TRILLION U.S. TREASURY MARKET.
Something is happening beneath the surface, and I believe 2026–2027 could become one of the most dangerous periods for global markets in decades.
READ THIS CAREFULLY.
Everyone is distracted by recession headlines, geopolitical tensions and the next Fed decision.
Meanwhile, the bond market is flashing warning signs.
The MOVE index is one of the indicators I'm watching.
Because when Treasury volatility rises and liquidity deteriorates, the damage doesn't necessarily stay in bonds.
It can spread through the entire financial system.
AND THREE MAJOR ECONOMIES ARE AT THE CENTER OF THIS RISK.
1. THE UNITED STATES 🇺🇸
America is facing enormous refinancing needs.
Government deficits remain elevated.
Interest expenses are consuming an increasingly large share of federal resources.
And higher borrowing costs make the problem worse.
Here's the danger.
If Treasury demand weakens while refinancing needs remain enormous, yields could rise sharply.
Higher yields mean tighter financial conditions.
Tighter conditions mean less liquidity for stocks, crypto and other risk assets.
THIS IS HOW A BOND MARKET PROBLEM CAN BECOME EVERYONE'S PROBLEM.
2. JAPAN 🇯🇵
This is the part I believe investors are seriously underestimating.
Japan is a major foreign holder of U.S. Treasuries.
Its financial institutions are deeply connected to global bond markets.
And changes in Bank of Japan policy can disrupt the carry trades that have helped finance risk-taking worldwide.
If Japanese yields rise enough, domestic assets become more attractive.
That could encourage Japanese investors to reduce some foreign exposure.
Now imagine that happening while U.S. Treasury markets are already under pressure.
Foreign selling.
Higher yields.
More volatility.
More forced deleveraging.
THE CONTAGION COULD SPREAD FAST.
3. CHINA 🇨🇳
China has its own financial pressure points.
A prolonged property downturn.
Local-government debt problems.
Weak domestic demand.
And persistent concerns about confidence and growth.
A deeper slowdown could intensify global risk aversion and put additional pressure on financial markets.
Now connect all three.
THE UNITED STATES NEEDS FUNDING.
JAPAN COULD REPATRIATE CAPITAL.
CHINA IS DEALING WITH DEBT AND GROWTH PRESSURES.
And global liquidity is the thread connecting everything.
HERE'S THE SCENARIO I'M WATCHING.
PHASE 1: THE BOND MARKET SHOCK.
Treasury volatility spikes.
Long-term yields rise.
Funding conditions deteriorate.
Investors start reducing leverage.
PHASE 2: THE GLOBAL LIQUIDITY CRUNCH.
The dollar strengthens as demand for liquidity increases.
Stocks come under pressure.
Crypto gets hit.
Forced selling accelerates.
And suddenly, everyone discovers that liquidity matters more than valuations.
PHASE 3: CENTRAL BANK INTERVENTION.
If financial stability is threatened, policymakers could respond with emergency liquidity facilities, swap lines or other measures.
But here's where things get interesting.
THE CRISIS COULD CREATE THE CONDITIONS FOR THE NEXT MAJOR ASSET RALLY.
PHASE 4: THE LIQUIDITY REVERSAL.
If policy eventually turns more accommodative and real yields decline, gold and other hard assets could benefit.
Silver could follow.
Commodities could recover.
And the dollar could eventually weaken.
But that outcome isn't guaranteed.
The timing and scale of any intervention would determine what happens next.
REMEMBER THE UK BOND CRISIS IN 2022?
A relatively contained market shock forced emergency intervention.
Now imagine serious funding stress spreading across several major economies at once.
THAT'S THE RISK I'M WATCHING.
I'm not saying every Treasury auction is about to fail.
I'm not saying a global collapse is guaranteed.
I'm saying the bond market deserves far more attention than it's getting.
Because by the time a liquidity crisis becomes obvious in stock prices, the damage may already be underway.
I've spent over 12 years studying financial markets and major turning points.
And I believe the next few months could be critical.
SAVE THIS POST.
Watch Treasury yields.
Watch the MOVE index.
Watch the dollar.
Watch Japan.
These markets could reveal the next major move before the headlines catch up.
Follow + turn notifications on.
I'll post my next major market call here FIRST.
EVERYONE IS WATCHING THE STOCK MARKET.
I'M WATCHING THE MARKET THAT FINANCES IT.
DON'T WAIT FOR THE PANIC TO START PAYING ATTENTION.
#HotCPIDecemberHikePriced #AnthropicRejectsIPODelayValuationinQuestion #AIChipSlumpNasdaq #BitcoinFiveWeeklyLosses
2
1.3k
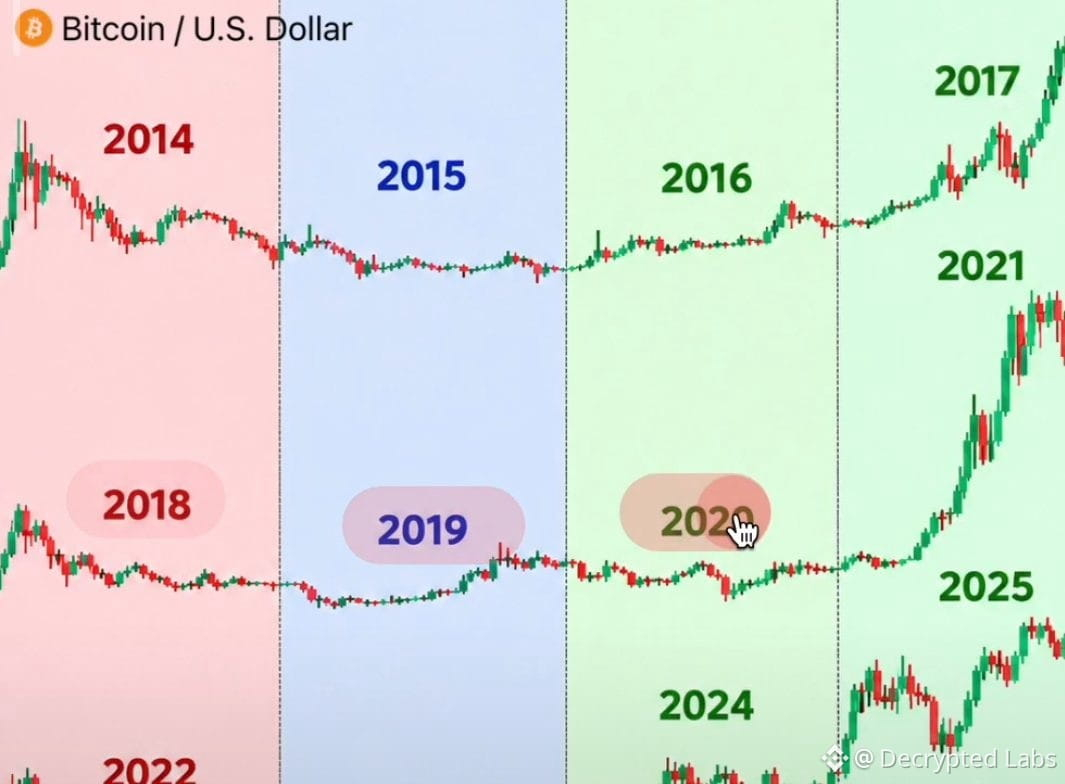
🚨 WARNING: THIS BITCOIN DUMP WILL BE BRUTAL
I warned you that Bitcoin would crash to $72K a few weeks ago.
We're still following the same 4-year cycle.
Bear → The year after the ATH.
Pre-bull → The year after the midterms, accumulation.
First bull → The Bitcoin halving year.
Second bull → The year of the new ATH.
Keep in mind:
I publicly called Bitcoin’s $17K bottom in 2022.
Then the $126K top in 2025.
My next call will be posted here first.
Follow and turn on notifications.
Don’t become exit liquidity.
🚨 WARNING: THIS BITCOIN DUMP WILL BE BRUTAL
I warned you that Bitcoin would crash to $72K a few weeks ago.
We're still following the same 4-year cycle.
Bear → The year after the ATH.
Pre-bull → The year after the midterms, accumulation.
First bull → The Bitcoin halving year.
Second bull → The year of the new ATH.
Keep in mind:
I publicly called Bitcoin’s $17K bottom in 2022.
Then the $126K top in 2025.
My next call will be posted here first.
Follow and turn on notifications.
Don’t become exit liquidity.
I warned you that Bitcoin would crash to $72K a few weeks ago.
We're still following the same 4-year cycle.
Bear → The year after the ATH.
Pre-bull → The year after the midterms, accumulation.
First bull → The Bitcoin halving year.
Second bull → The year of the new ATH.
Keep in mind:
I publicly called Bitcoin’s $17K bottom in 2022.
Then the $126K top in 2025.
My next call will be posted here first.
Follow and turn on notifications.
Don’t become exit liquidity.
20
25
36.9k
Article
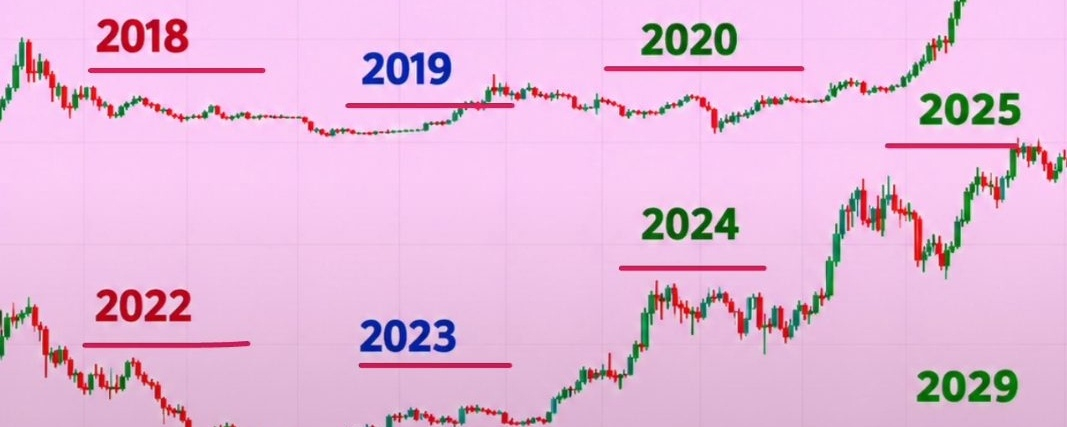
BITCOIN IS REPEATING THE SAME CYCLE FOR THE FOURTH TIME.And almost nobody realizes what could happen in 2027.
LOOK AT THIS CHART.
2014 → BEAR MARKET
2015 → RECOVERY
2016 → FIRST BULL PHASE
2017 → EXPLOSIVE RALLY
2018 → BEAR MARKET
2019 → RECOVERY
2020 → FIRST BULL PHASE
2021 → EXPLOSIVE RALLY
2022 → BEAR MARKET
2023 → RECOVERY
2024 → FIRST BULL PHASE
2025 → CYCLE TOP
2026 → BEAR MARKET
2027 → RECOVERY?
2028 → FIRST BULL PHASE?
2029 → NEW CYCLE TOP?
FOUR CYCLES. THE SAME FOUR-YEAR STRUCTURE.
And here's where things get interesting.
Every bear year on this chart coincides with U.S. midterm elections.
Every recovery year follows the midterms.
Every first bull phase coincides with a Bitcoin halving.
And the last three major cycle peaks arrived roughly 526, 548 and 534 days after their respective halvings.
THAT'S AN INCREDIBLY SIMILAR TIMELINE.
But two things have changed.
First, Bitcoin's latest drawdown was smaller.
Previous bear markets saw declines of roughly 77% to 85%.
This time, the decline to $58.6K was approximately 53% from the $126K peak.
Second, the correction happened much faster.
Previous cycle bottoms took around 363 to 406 days.
This time, $58.6K was reached just 268 days after the peak.
SO HERE'S THE MILLION-DOLLAR QUESTION.
WAS $58.6K ALREADY THE CYCLE BOTTOM?
Or is one final capitulation still coming?
I'm watching both scenarios.
Because if this four-year structure repeats, 2027 could become the accumulation year everyone talks about in hindsight.
And the next halving is expected around April 2028.
I'm not assuming history guarantees another bull market.
But I'm definitely not ignoring a pattern that has appeared across three completed cycles.
SAVE THIS CHART.
Come back in 2027.
Follow + turn notifications on.
I'll share my next major Bitcoin buying signal here FIRST.
THE BIGGEST OPPORTUNITIES DON'T ARRIVE WHEN EVERYONE IS BULLISH.
THEY ARRIVE WHEN ALMOST NOBODY BELIEVES THE NEXT CYCLE IS POSSIBLE.
#HotCPIDecemberHikePriced #AnthropicRejectsIPODelayValuationinQuestion #BitcoinFiveWeeklyLosses #US-IranTalksFuelStrongStockMarketRebound
BITCOIN IS REPEATING THE SAME CYCLE FOR THE FOURTH TIME.
And almost nobody realizes what could happen in 2027.
LOOK AT THIS CHART.
2014 → BEAR MARKET
2015 → RECOVERY
2016 → FIRST BULL PHASE
2017 → EXPLOSIVE RALLY
2018 → BEAR MARKET
2019 → RECOVERY
2020 → FIRST BULL PHASE
2021 → EXPLOSIVE RALLY
2022 → BEAR MARKET
2023 → RECOVERY
2024 → FIRST BULL PHASE
2025 → CYCLE TOP
2026 → BEAR MARKET
2027 → RECOVERY?
2028 → FIRST BULL PHASE?
2029 → NEW CYCLE TOP?
FOUR CYCLES. THE SAME FOUR-YEAR STRUCTURE.
And here's where things get interesting.
Every bear year on this chart coincides with U.S. midterm elections.
Every recovery year follows the midterms.
Every first bull phase coincides with a Bitcoin halving.
And the last three major cycle peaks arrived roughly 526, 548 and 534 days after their respective halvings.
THAT'S AN INCREDIBLY SIMILAR TIMELINE.
But two things have changed.
First, Bitcoin's latest drawdown was smaller.
Previous bear markets saw declines of roughly 77% to 85%.
This time, the decline to $58.6K was approximately 53% from the $126K peak.
Second, the correction happened much faster.
Previous cycle bottoms took around 363 to 406 days.
This time, $58.6K was reached just 268 days after the peak.
SO HERE'S THE MILLION-DOLLAR QUESTION.
WAS $58.6K ALREADY THE CYCLE BOTTOM?
Or is one final capitulation still coming?
I'm watching both scenarios.
Because if this four-year structure repeats, 2027 could become the accumulation year everyone talks about in hindsight.
And the next halving is expected around April 2028.
I'm not assuming history guarantees another bull market.
But I'm definitely not ignoring a pattern that has appeared across three completed cycles.
SAVE THIS CHART.
Come back in 2027.
Follow + turn notifications on.
I'll share my next major Bitcoin buying signal here FIRST.
THE BIGGEST OPPORTUNITIES DON'T ARRIVE WHEN EVERYONE IS BULLISH.
THEY ARRIVE WHEN ALMOST NOBODY BELIEVES THE NEXT CYCLE IS POSSIBLE.
#HotCPIDecemberHikePriced #AnthropicRejectsIPODelayValuationinQuestion #BitcoinFiveWeeklyLosses #US-IranTalksFuelStrongStockMarketRebound
LOOK AT THIS CHART.
2014 → BEAR MARKET
2015 → RECOVERY
2016 → FIRST BULL PHASE
2017 → EXPLOSIVE RALLY
2018 → BEAR MARKET
2019 → RECOVERY
2020 → FIRST BULL PHASE
2021 → EXPLOSIVE RALLY
2022 → BEAR MARKET
2023 → RECOVERY
2024 → FIRST BULL PHASE
2025 → CYCLE TOP
2026 → BEAR MARKET
2027 → RECOVERY?
2028 → FIRST BULL PHASE?
2029 → NEW CYCLE TOP?
FOUR CYCLES. THE SAME FOUR-YEAR STRUCTURE.
And here's where things get interesting.
Every bear year on this chart coincides with U.S. midterm elections.
Every recovery year follows the midterms.
Every first bull phase coincides with a Bitcoin halving.
And the last three major cycle peaks arrived roughly 526, 548 and 534 days after their respective halvings.
THAT'S AN INCREDIBLY SIMILAR TIMELINE.
But two things have changed.
First, Bitcoin's latest drawdown was smaller.
Previous bear markets saw declines of roughly 77% to 85%.
This time, the decline to $58.6K was approximately 53% from the $126K peak.
Second, the correction happened much faster.
Previous cycle bottoms took around 363 to 406 days.
This time, $58.6K was reached just 268 days after the peak.
SO HERE'S THE MILLION-DOLLAR QUESTION.
WAS $58.6K ALREADY THE CYCLE BOTTOM?
Or is one final capitulation still coming?
I'm watching both scenarios.
Because if this four-year structure repeats, 2027 could become the accumulation year everyone talks about in hindsight.
And the next halving is expected around April 2028.
I'm not assuming history guarantees another bull market.
But I'm definitely not ignoring a pattern that has appeared across three completed cycles.
SAVE THIS CHART.
Come back in 2027.
Follow + turn notifications on.
I'll share my next major Bitcoin buying signal here FIRST.
THE BIGGEST OPPORTUNITIES DON'T ARRIVE WHEN EVERYONE IS BULLISH.
THEY ARRIVE WHEN ALMOST NOBODY BELIEVES THE NEXT CYCLE IS POSSIBLE.
#HotCPIDecemberHikePriced #AnthropicRejectsIPODelayValuationinQuestion #BitcoinFiveWeeklyLosses #US-IranTalksFuelStrongStockMarketRebound
1
187
WARNING: SOMETHING EXTREMELY BAD JUST HAPPENED!
WARNING: SOMETHING EXTREMELY BAD JUST HAPPENED!
2
518
Article
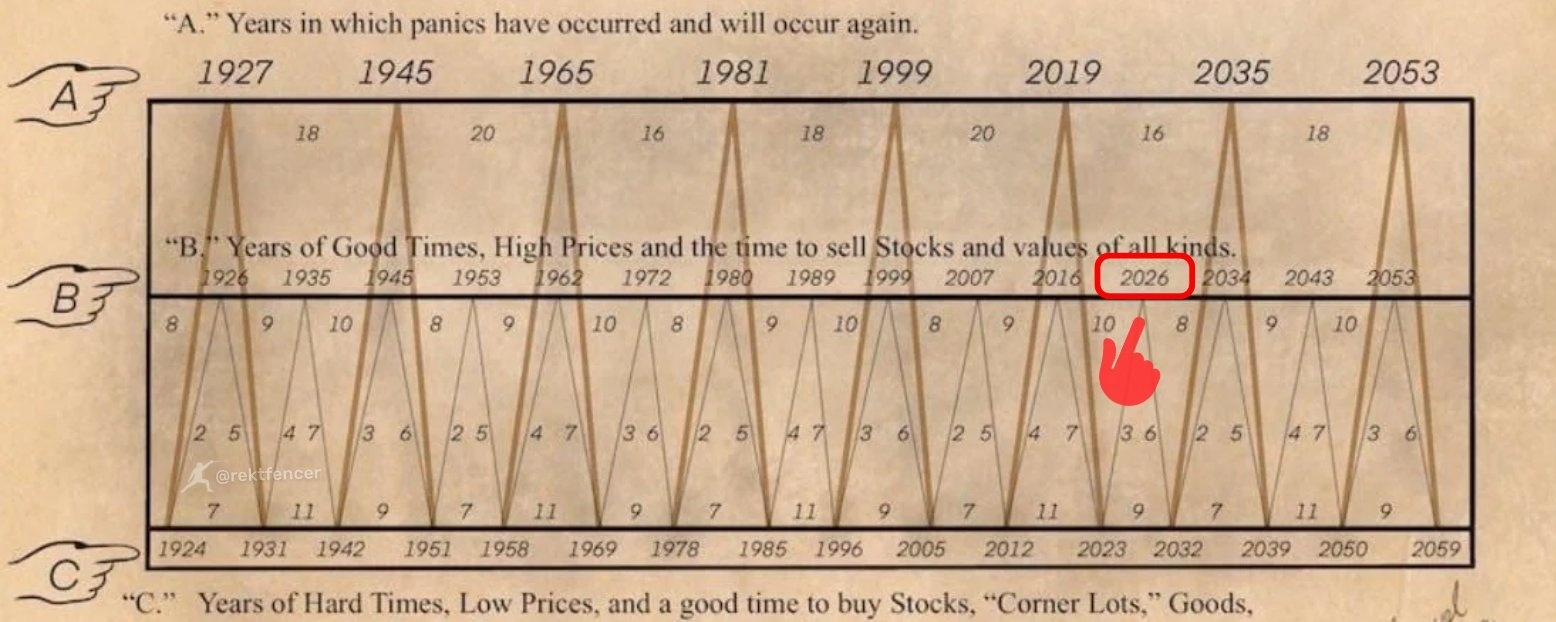
WARNING: SOMETHING EXTREMELY BAD JUST HAPPENED!New macro data just dropped and it’s FAR WORSE than anyone expected.
99% of people will lose everything.
Not because of a recession.
Not because of another banking crisis.
Not because of the U.S.-Iran war.
The REAL danger is silently unfolding behind the scenes.
And it begins with sovereign debt, particularly U.S. Treasuries.
Bond market instability is accelerating.
The MOVE index is climbing, signaling growing stress behind the scenes.
Bond markets don't react to headlines alone.
They react when liquidity disappears and funding conditions deteriorate.
And today, 3 major financial issues are approaching simultaneously:
1️⃣ UNITED STATES
In 2026, America faces enormous refinancing requirements alongside record government deficits.
Debt servicing costs are climbing.
Overseas Treasury demand is weakening.
Long-term bond auctions are showing increasing signs of stress.
Less demand.
Higher borrowing costs.
Tighter liquidity.
This is precisely how a funding crisis starts.
2️⃣ JAPAN
Japan remains one of the largest foreign holders of U.S. Treasuries and a critical pillar of global carry trades.
The BOJ is already tightening policy.
Japanese investors are forced to liquidate foreign assets, including U.S. bonds, stocks and ETFs.
At the same time, a Japanese stock market crash will accelerate global risk aversion and trigger further selling.
Japan won't just feel the shock.
It'll transmit it across the global financial system.
3️⃣ CHINA
China's debt crisis is becoming impossible to ignore.
Its property sector, local-government financing problems and weakening domestic demand are creating enormous pressure.
The recent 45% collapse in the Chinese stock market has already weakened confidence.
China will become another major amplifier of global financial stress.
And the trigger doesn't need to be spectacular.
One failed Treasury auction could be enough to expose everything.
We've witnessed similar events before, including the UK bond crisis in 2022.
But this time, these issues are interconnected across multiple major economies.
The chain reaction will be brutal:
Bond yields explode again → Dollar surges → Liquidity evaporates → Global equities collapse
Then central banks intervene.
Emergency liquidity → Currency swap lines → Balance sheet expansion
The immediate panic stops, but the financial system becomes flooded with extra liquidity.
Real yields decline → Gold surges → Silver follows → Commodities rally → The dollar eventually weakens.
The next inflationary wave begins.
the 2026–2027 cycle will be a defining period for global markets.
The biggest threat isn't one isolated economic crisis.
It's multiple financial pressure points reaching breaking a point at the same time.
The warning signs are already here.
The time to pay attention is NOW.
I've spent over 12 years studying financial markets and calling nearly every market top and bottom.
The next few weeks will separate those who are prepared from those who will lose everything.
Follow and turn on notifications.
Many will wish they had paid attention sooner.
WARNING: SOMETHING EXTREMELY BAD JUST HAPPENED!
New macro data just dropped and it’s FAR WORSE than anyone expected.
99% of people will lose everything.
Not because of a recession.
Not because of another banking crisis.
Not because of the U.S.-Iran war.
The REAL danger is silently unfolding behind the scenes.
And it begins with sovereign debt, particularly U.S. Treasuries.
Bond market instability is accelerating.
The MOVE index is climbing, signaling growing stress behind the scenes.
Bond markets don't react to headlines alone.
They react when liquidity disappears and funding conditions deteriorate.
And today, 3 major financial issues are approaching simultaneously:
1️⃣ UNITED STATES
In 2026, America faces enormous refinancing requirements alongside record government deficits.
Debt servicing costs are climbing.
Overseas Treasury demand is weakening.
Long-term bond auctions are showing increasing signs of stress.
Less demand.
Higher borrowing costs.
Tighter liquidity.
This is precisely how a funding crisis starts.
2️⃣ JAPAN
Japan remains one of the largest foreign holders of U.S. Treasuries and a critical pillar of global carry trades.
The BOJ is already tightening policy.
Japanese investors are forced to liquidate foreign assets, including U.S. bonds, stocks and ETFs.
At the same time, a Japanese stock market crash will accelerate global risk aversion and trigger further selling.
Japan won't just feel the shock.
It'll transmit it across the global financial system.
3️⃣ CHINA
China's debt crisis is becoming impossible to ignore.
Its property sector, local-government financing problems and weakening domestic demand are creating enormous pressure.
The recent 45% collapse in the Chinese stock market has already weakened confidence.
China will become another major amplifier of global financial stress.
And the trigger doesn't need to be spectacular.
One failed Treasury auction could be enough to expose everything.
We've witnessed similar events before, including the UK bond crisis in 2022.
But this time, these issues are interconnected across multiple major economies.
The chain reaction will be brutal:
Bond yields explode again → Dollar surges → Liquidity evaporates → Global equities collapse
Then central banks intervene.
Emergency liquidity → Currency swap lines → Balance sheet expansion
The immediate panic stops, but the financial system becomes flooded with extra liquidity.
Real yields decline → Gold surges → Silver follows → Commodities rally → The dollar eventually weakens.
The next inflationary wave begins.
the 2026–2027 cycle will be a defining period for global markets.
The biggest threat isn't one isolated economic crisis.
It's multiple financial pressure points reaching breaking a point at the same time.
The warning signs are already here.
The time to pay attention is NOW.
I've spent over 12 years studying financial markets and calling nearly every market top and bottom.
The next few weeks will separate those who are prepared from those who will lose everything.
Follow and turn on notifications.
Many will wish they had paid attention sooner.
99% of people will lose everything.
Not because of a recession.
Not because of another banking crisis.
Not because of the U.S.-Iran war.
The REAL danger is silently unfolding behind the scenes.
And it begins with sovereign debt, particularly U.S. Treasuries.
Bond market instability is accelerating.
The MOVE index is climbing, signaling growing stress behind the scenes.
Bond markets don't react to headlines alone.
They react when liquidity disappears and funding conditions deteriorate.
And today, 3 major financial issues are approaching simultaneously:
1️⃣ UNITED STATES
In 2026, America faces enormous refinancing requirements alongside record government deficits.
Debt servicing costs are climbing.
Overseas Treasury demand is weakening.
Long-term bond auctions are showing increasing signs of stress.
Less demand.
Higher borrowing costs.
Tighter liquidity.
This is precisely how a funding crisis starts.
2️⃣ JAPAN
Japan remains one of the largest foreign holders of U.S. Treasuries and a critical pillar of global carry trades.
The BOJ is already tightening policy.
Japanese investors are forced to liquidate foreign assets, including U.S. bonds, stocks and ETFs.
At the same time, a Japanese stock market crash will accelerate global risk aversion and trigger further selling.
Japan won't just feel the shock.
It'll transmit it across the global financial system.
3️⃣ CHINA
China's debt crisis is becoming impossible to ignore.
Its property sector, local-government financing problems and weakening domestic demand are creating enormous pressure.
The recent 45% collapse in the Chinese stock market has already weakened confidence.
China will become another major amplifier of global financial stress.
And the trigger doesn't need to be spectacular.
One failed Treasury auction could be enough to expose everything.
We've witnessed similar events before, including the UK bond crisis in 2022.
But this time, these issues are interconnected across multiple major economies.
The chain reaction will be brutal:
Bond yields explode again → Dollar surges → Liquidity evaporates → Global equities collapse
Then central banks intervene.
Emergency liquidity → Currency swap lines → Balance sheet expansion
The immediate panic stops, but the financial system becomes flooded with extra liquidity.
Real yields decline → Gold surges → Silver follows → Commodities rally → The dollar eventually weakens.
The next inflationary wave begins.
the 2026–2027 cycle will be a defining period for global markets.
The biggest threat isn't one isolated economic crisis.
It's multiple financial pressure points reaching breaking a point at the same time.
The warning signs are already here.
The time to pay attention is NOW.
I've spent over 12 years studying financial markets and calling nearly every market top and bottom.
The next few weeks will separate those who are prepared from those who will lose everything.
Follow and turn on notifications.
Many will wish they had paid attention sooner.
15
5.3k
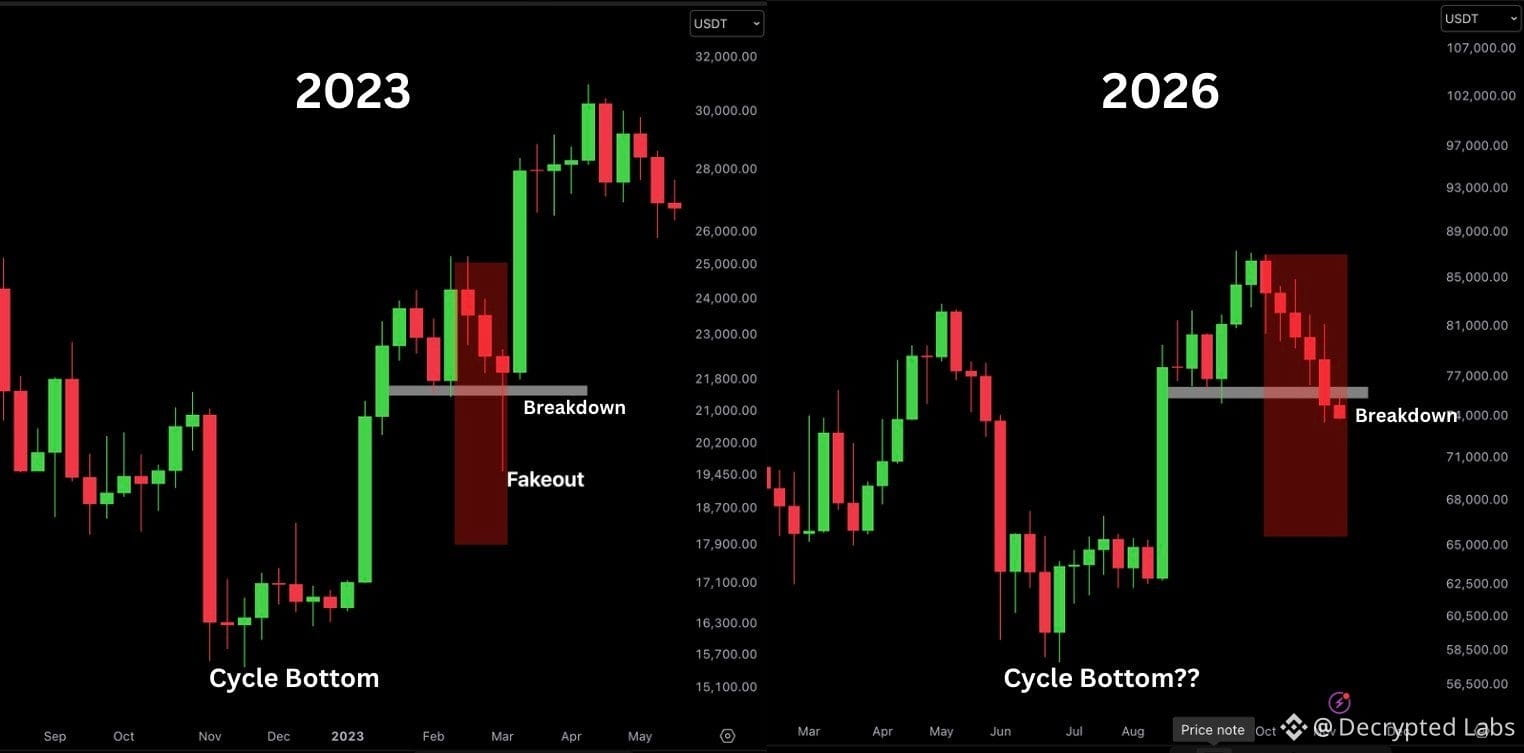
BTC might be repeating the same playbook from 2023.
1) A massive pump after the cycle bottom
2) Multi-month consolidation
3) Fakeout dump below the key support level
4) Reclaim and pump to new highs
We are currently at Stage 3, and those who survive this will enjoy the next leg up.
BTC might be repeating the same playbook from 2023.
1) A massive pump after the cycle bottom
2) Multi-month consolidation
3) Fakeout dump below the key support level
4) Reclaim and pump to new highs
We are currently at Stage 3, and those who survive this will enjoy the next leg up.
1) A massive pump after the cycle bottom
2) Multi-month consolidation
3) Fakeout dump below the key support level
4) Reclaim and pump to new highs
We are currently at Stage 3, and those who survive this will enjoy the next leg up.
142
Buying $BTC in 2014 made millionaires.
Buying $ETH in 2018 made millionaires.
Buying $SOL in 2022 made millionaires.
Buying ______ in 2026 will make millionaires.
Buying $BTC in 2014 made millionaires.
Buying $ETH in 2018 made millionaires.
Buying $SOL in 2022 made millionaires.
Buying ______ in 2026 will make millionaires.
Buying $ETH in 2018 made millionaires.
Buying $SOL in 2022 made millionaires.
Buying ______ in 2026 will make millionaires.
134
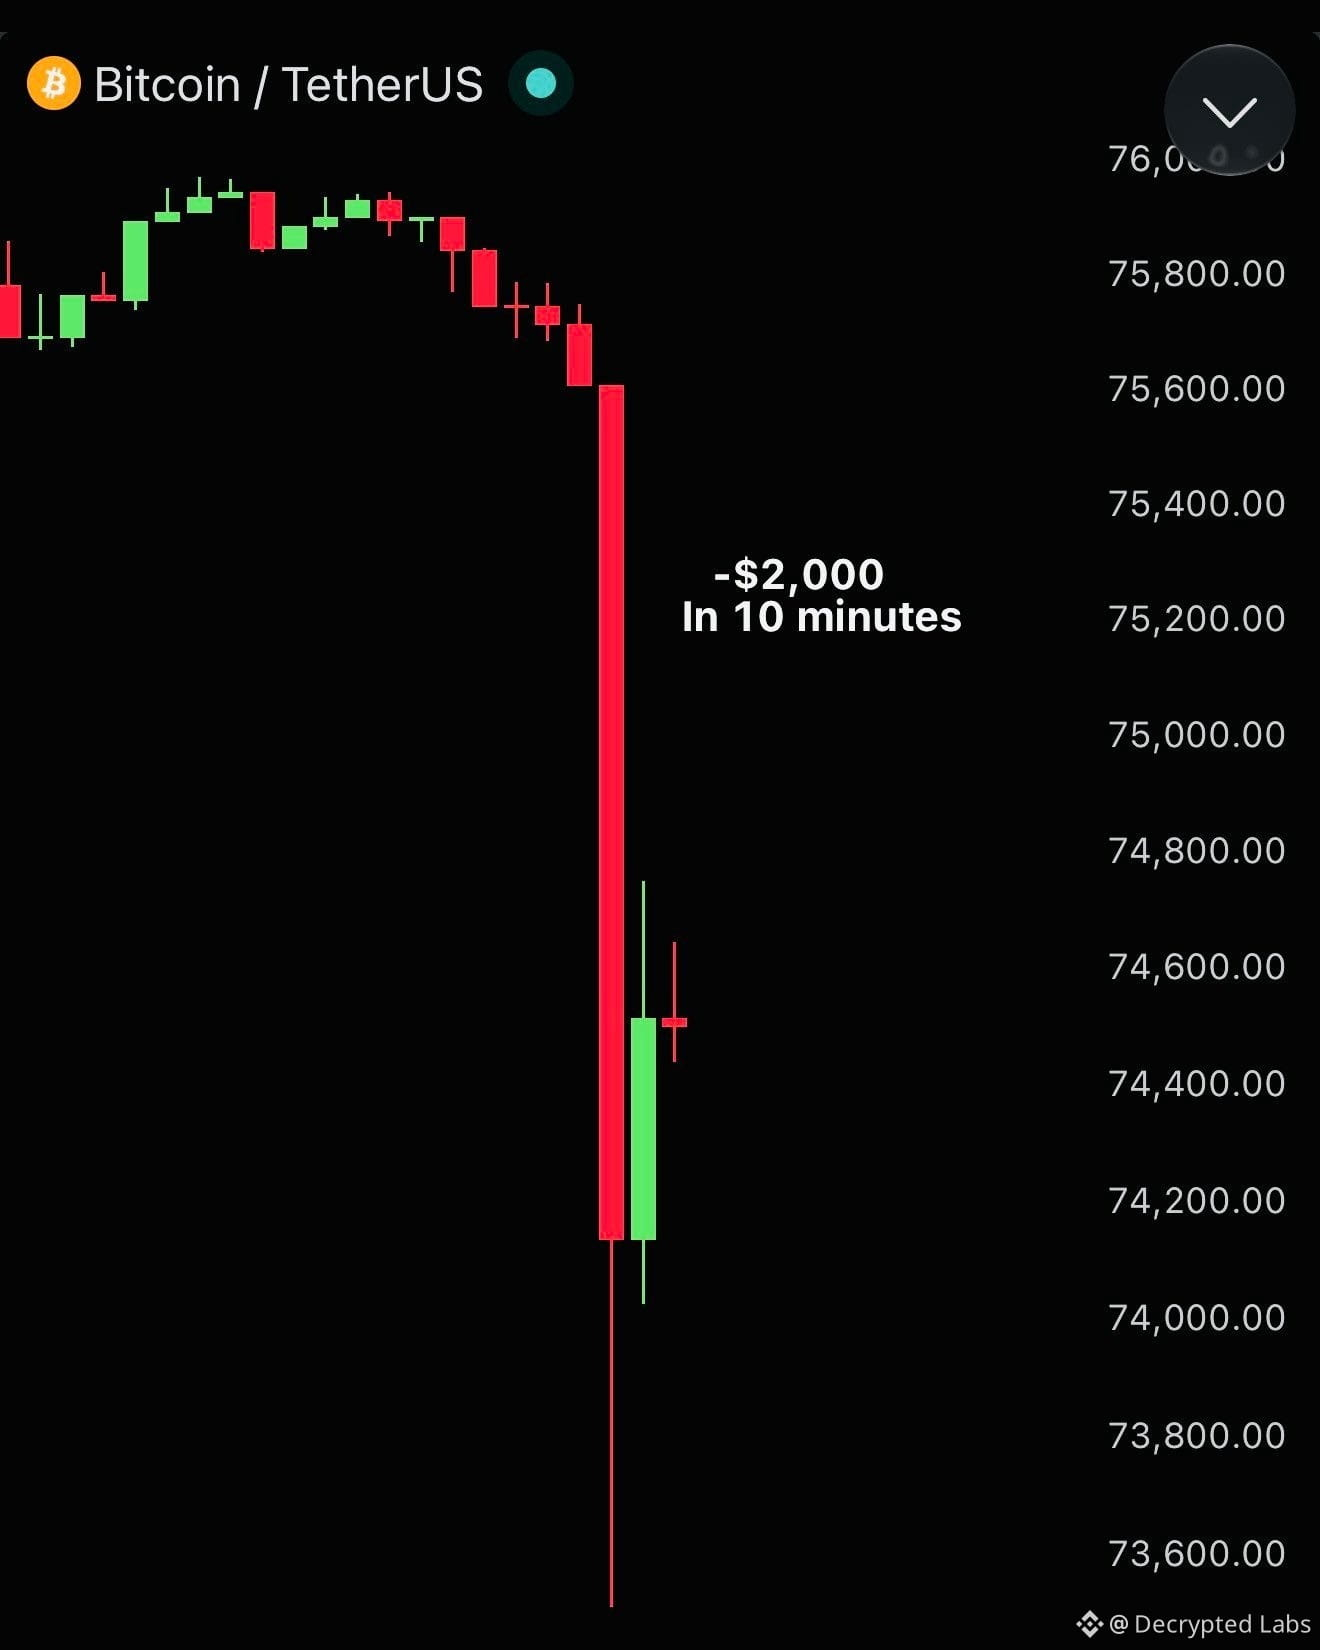
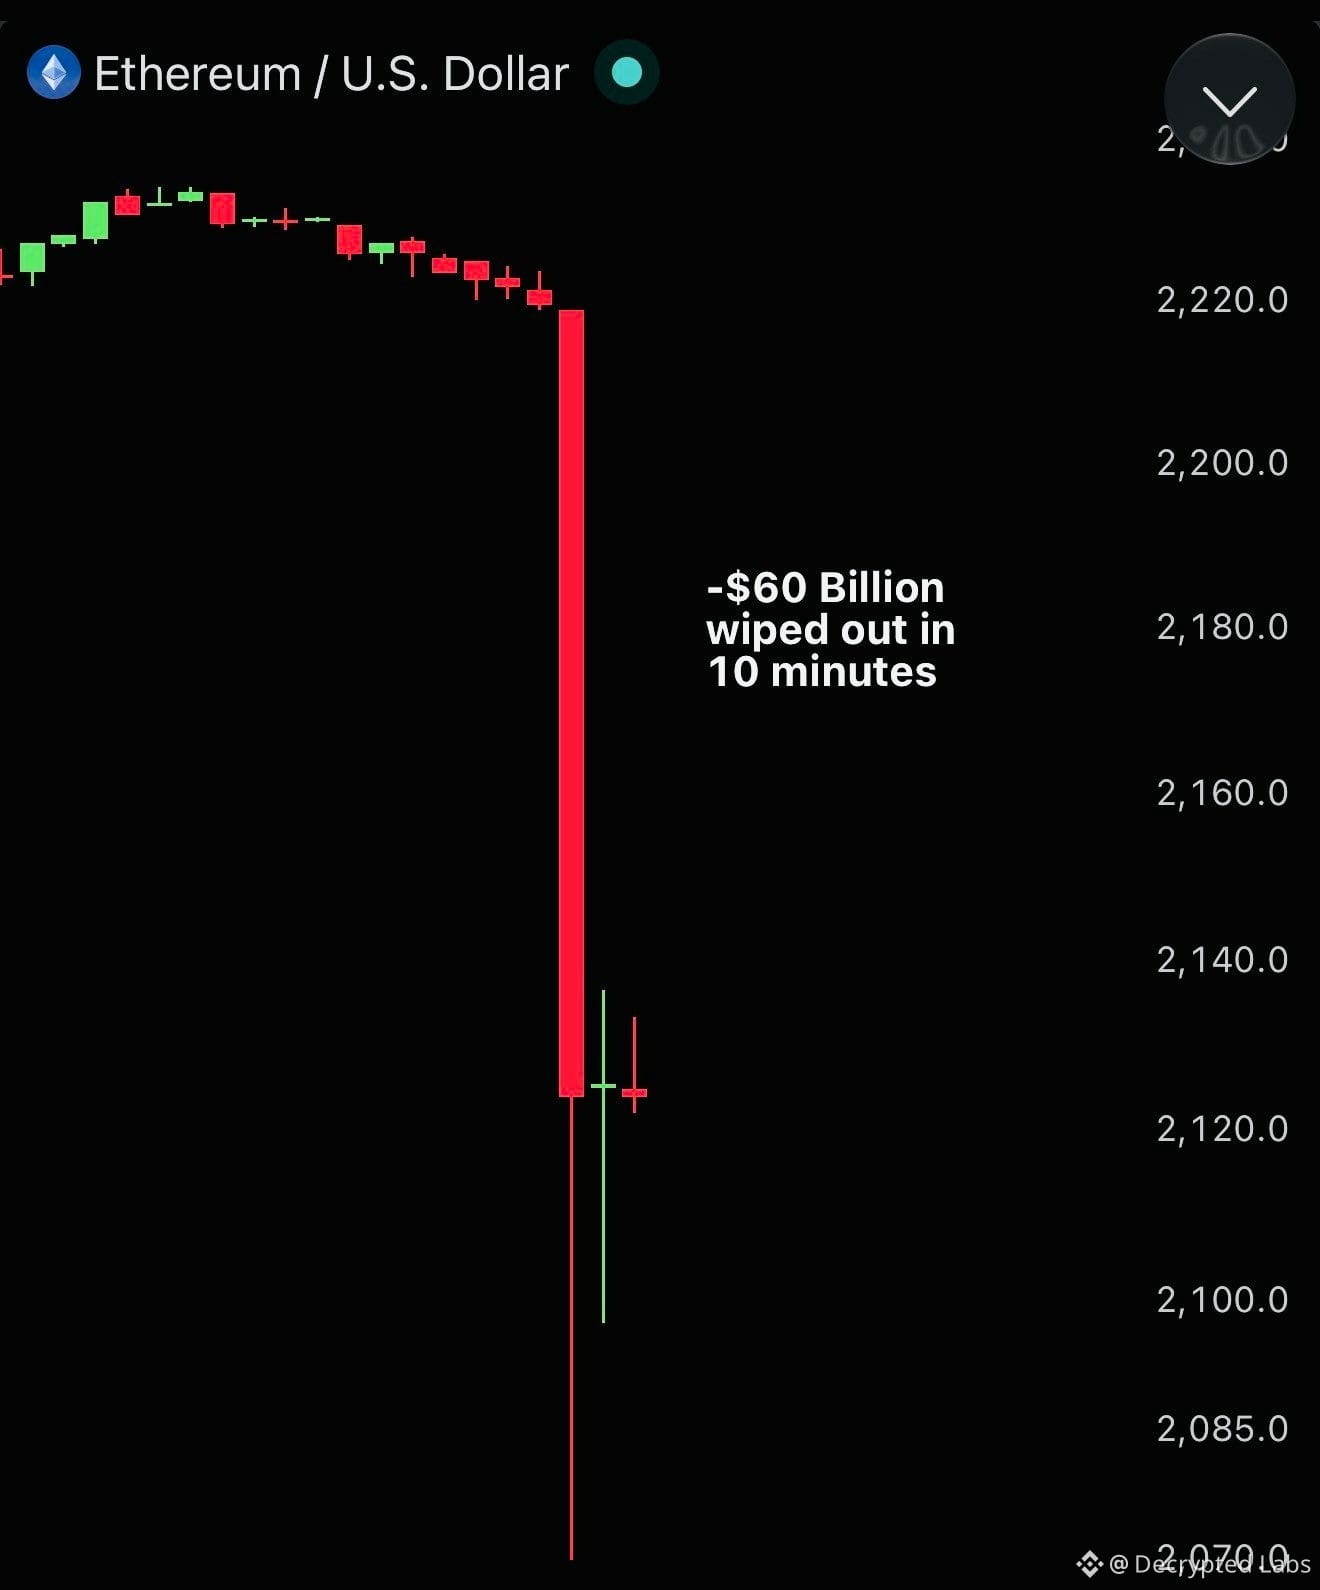
CRYPTO MARKET BLOODBATH!
Just 10 minutes. $60 BILLION wiped out.
l Bitcoin plunged $2,000.
$1 BILLION in liquidations.
$60 BILLION in crypto market value erased.
One of the wildest 10-minute crashes the market has seen.
Volatility is REAL. Are you ready for it?
#Bitcoin #CryptoCrash #CryptoMarket #BTC #BitcoinFiveWeeklyLosses
CRYPTO MARKET BLOODBATH!
Just 10 minutes. $60 BILLION wiped out.
l Bitcoin plunged $2,000.
$1 BILLION in liquidations.
$60 BILLION in crypto market value erased.
One of the wildest 10-minute crashes the market has seen.
Volatility is REAL. Are you ready for it?
#Bitcoin #CryptoCrash #CryptoMarket #BTC #BitcoinFiveWeeklyLosses
Just 10 minutes. $60 BILLION wiped out.
l Bitcoin plunged $2,000.
$1 BILLION in liquidations.
$60 BILLION in crypto market value erased.
One of the wildest 10-minute crashes the market has seen.
Volatility is REAL. Are you ready for it?
#Bitcoin #CryptoCrash #CryptoMarket #BTC #BitcoinFiveWeeklyLosses
1
257
BINANCE SECURITY INCIDENT: $6.3 BILLION CRYPTO THEFT
The crypto market is entering November with heightened uncertainty following a major security incident involving Binance.
Here are the latest developments:
🔴 1. BINANCE REPORTS MAJOR ASSET THEFT
Approximately $6.3 billion in digital assets were stolen in the reported incident. The FBI has attributed the attack to North Korea-linked hacking group TraderTraitor.
🟢 2. BINANCE BEGINS RESTORING ASSETS
Binance says it has replaced approximately $6 billion, representing around 95% of the stolen assets, using company funds and reserves.
🟢 3. WITHDRAWALS RESUME
Binance has resumed Bitcoin, Ethereum and some stablecoin withdrawals. Other assets are expected to follow in phases.
📊 4. BITCOIN MARKET REACTION
Bitcoin has recovered towards $78,000 after falling to approximately $76,000 during the recent market sell-off.
📉 5. INVESTOR SENTIMENT
Market sentiment remains cautious. Investors are closely monitoring exchange security, institutional fund flows and Bitcoin's ability to recover.
💡 MY TAKE:
This incident highlights an important lesson for the entire cryptocurrency industry: security, transparency and investor confidence are essential for long-term adoption.
The market may recover, but investors should remain cautious and avoid emotional trading decisions.
💬 What do you think?
Will Bitcoin recover above $80,000 in November, or could further volatility be ahead?
Share your thoughts below!
#Binance #Bitcoin #BTC #Ethereum #ETH
⚠️ This post is for educational and informational purposes only. Not financial advice.
BINANCE SECURITY INCIDENT: $6.3 BILLION CRYPTO THEFT
The crypto market is entering November with heightened uncertainty following a major security incident involving Binance.
Here are the latest developments:
🔴 1. BINANCE REPORTS MAJOR ASSET THEFT
Approximately $6.3 billion in digital assets were stolen in the reported incident. The FBI has attributed the attack to North Korea-linked hacking group TraderTraitor.
🟢 2. BINANCE BEGINS RESTORING ASSETS
Binance says it has replaced approximately $6 billion, representing around 95% of the stolen assets, using company funds and reserves.
🟢 3. WITHDRAWALS RESUME
Binance has resumed Bitcoin, Ethereum and some stablecoin withdrawals. Other assets are expected to follow in phases.
📊 4. BITCOIN MARKET REACTION
Bitcoin has recovered towards $78,000 after falling to approximately $76,000 during the recent market sell-off.
📉 5. INVESTOR SENTIMENT
Market sentiment remains cautious. Investors are closely monitoring exchange security, institutional fund flows and Bitcoin's ability to recover.
💡 MY TAKE:
This incident highlights an important lesson for the entire cryptocurrency industry: security, transparency and investor confidence are essential for long-term adoption.
The market may recover, but investors should remain cautious and avoid emotional trading decisions.
💬 What do you think?
Will Bitcoin recover above $80,000 in November, or could further volatility be ahead?
Share your thoughts below!
#Binance #Bitcoin #BTC #Ethereum #ETH
⚠️ This post is for educational and informational purposes only. Not financial advice.
The crypto market is entering November with heightened uncertainty following a major security incident involving Binance.
Here are the latest developments:
🔴 1. BINANCE REPORTS MAJOR ASSET THEFT
Approximately $6.3 billion in digital assets were stolen in the reported incident. The FBI has attributed the attack to North Korea-linked hacking group TraderTraitor.
🟢 2. BINANCE BEGINS RESTORING ASSETS
Binance says it has replaced approximately $6 billion, representing around 95% of the stolen assets, using company funds and reserves.
🟢 3. WITHDRAWALS RESUME
Binance has resumed Bitcoin, Ethereum and some stablecoin withdrawals. Other assets are expected to follow in phases.
📊 4. BITCOIN MARKET REACTION
Bitcoin has recovered towards $78,000 after falling to approximately $76,000 during the recent market sell-off.
📉 5. INVESTOR SENTIMENT
Market sentiment remains cautious. Investors are closely monitoring exchange security, institutional fund flows and Bitcoin's ability to recover.
💡 MY TAKE:
This incident highlights an important lesson for the entire cryptocurrency industry: security, transparency and investor confidence are essential for long-term adoption.
The market may recover, but investors should remain cautious and avoid emotional trading decisions.
💬 What do you think?
Will Bitcoin recover above $80,000 in November, or could further volatility be ahead?
Share your thoughts below!
#Binance #Bitcoin #BTC #Ethereum #ETH
⚠️ This post is for educational and informational purposes only. Not financial advice.
472
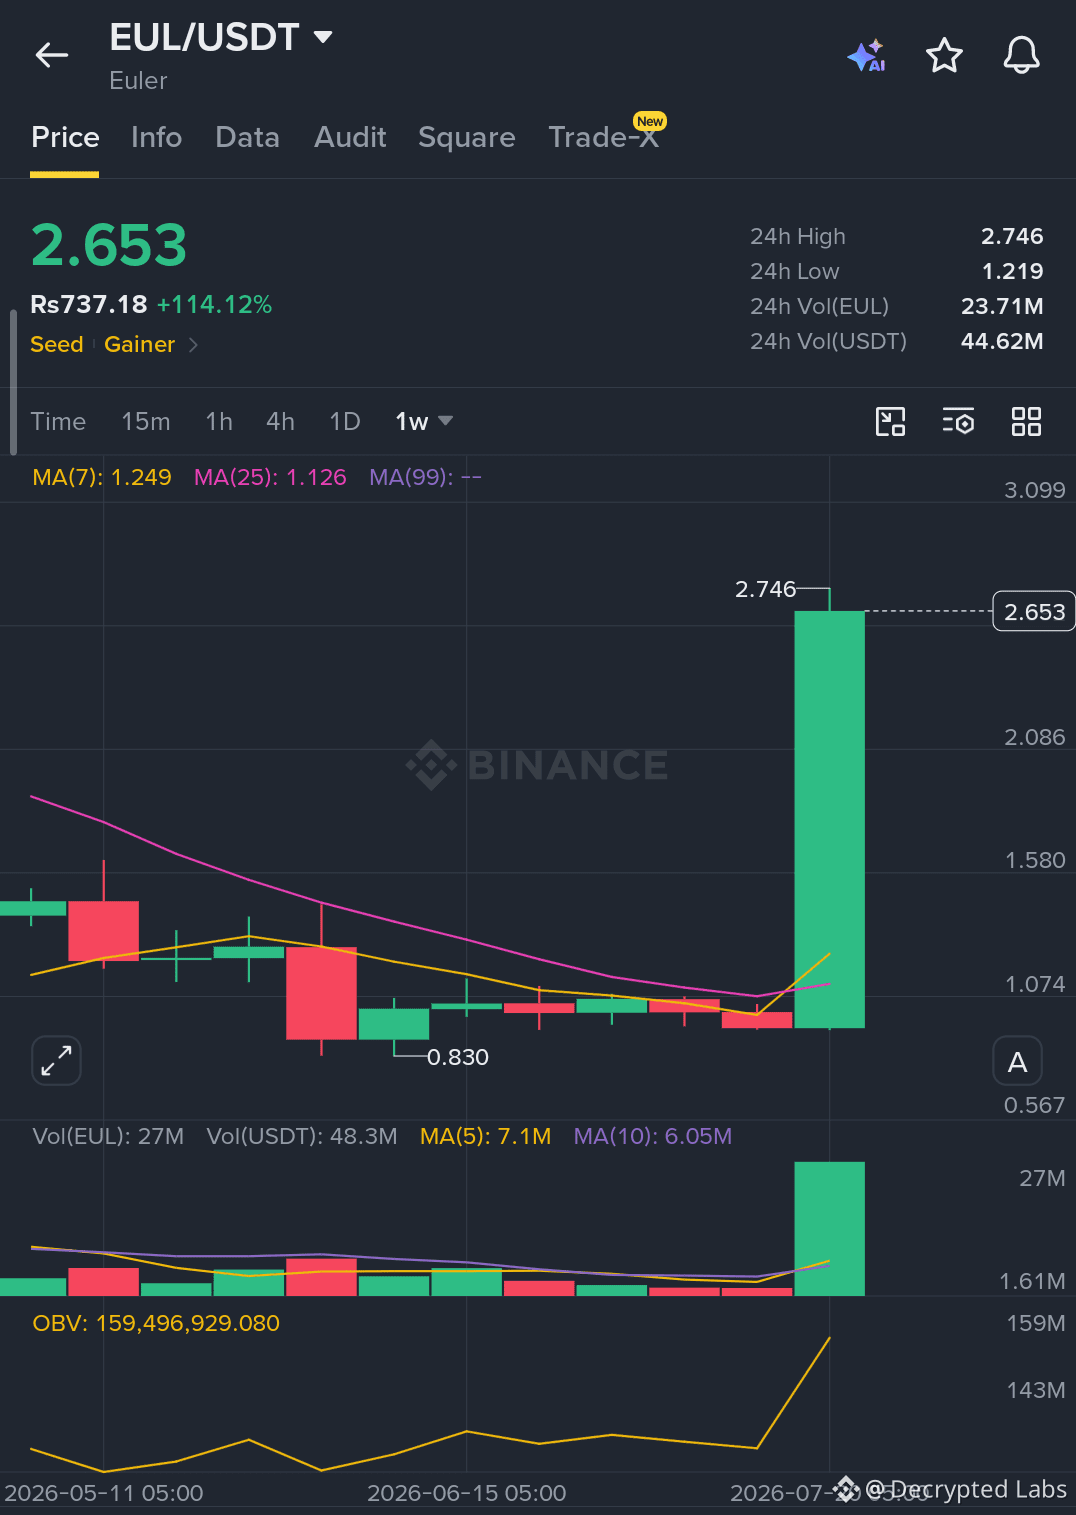
$EUL
{spot}(EULUSDT)
just ripped +114% and everyone's arguing about what happens next
Bulls are calling it the start of a breakout. Bears are calling it exhaustion. Both are looking at the same chart.
Here's what's actually on it:
Price is trading well above the upper Bollinger Band ($1.99) and miles clear of the MA7 ($1.78). That's not a gentle grind — that's a parabolic extension, and parabolic extensions historically do one of two things: consolidate sideways while the mean catches up, or snap back hard once momentum buyers run out of size.
The tell to watch isn't the price — it's the reaction at the extremes. A move that keeps closing green above the band on strong volume is different from one that starts printing long upper wicks and fading on lower volume. Right now we're still in "prove it" territory.
What I'm watching, not "calling":
→ Does price hold above MA7 ($1.78) on the next pullback, or does it lose it fast?
→ Is volume expanding into the highs, or quietly drying up?
→ How does it behave the first time it retests the upper band from above?
That's the actual setup — not a guaranteed number, a decision tree. Trade what the chart confirms, not what you hope it does.
Not financial advice. DYOR. 🧠
$EUL
just ripped +114% and everyone's arguing about what happens next
Bulls are calling it the start of a breakout. Bears are calling it exhaustion. Both are looking at the same chart.
Here's what's actually on it:
Price is trading well above the upper Bollinger Band ($1.99) and miles clear of the MA7 ($1.78). That's not a gentle grind — that's a parabolic extension, and parabolic extensions historically do one of two things: consolidate sideways while the mean catches up, or snap back hard once momentum buyers run out of size.
The tell to watch isn't the price — it's the reaction at the extremes. A move that keeps closing green above the band on strong volume is different from one that starts printing long upper wicks and fading on lower volume. Right now we're still in "prove it" territory.
What I'm watching, not "calling":
→ Does price hold above MA7 ($1.78) on the next pullback, or does it lose it fast?
→ Is volume expanding into the highs, or quietly drying up?
→ How does it behave the first time it retests the upper band from above?
That's the actual setup — not a guaranteed number, a decision tree. Trade what the chart confirms, not what you hope it does.
Not financial advice. DYOR. 🧠
just ripped +114% and everyone's arguing about what happens next
Bulls are calling it the start of a breakout. Bears are calling it exhaustion. Both are looking at the same chart.
Here's what's actually on it:
Price is trading well above the upper Bollinger Band ($1.99) and miles clear of the MA7 ($1.78). That's not a gentle grind — that's a parabolic extension, and parabolic extensions historically do one of two things: consolidate sideways while the mean catches up, or snap back hard once momentum buyers run out of size.
The tell to watch isn't the price — it's the reaction at the extremes. A move that keeps closing green above the band on strong volume is different from one that starts printing long upper wicks and fading on lower volume. Right now we're still in "prove it" territory.
What I'm watching, not "calling":
→ Does price hold above MA7 ($1.78) on the next pullback, or does it lose it fast?
→ Is volume expanding into the highs, or quietly drying up?
→ How does it behave the first time it retests the upper band from above?
That's the actual setup — not a guaranteed number, a decision tree. Trade what the chart confirms, not what you hope it does.
Not financial advice. DYOR. 🧠
1
922
Bitcoin Miner Poolin Enters Chapter 11 with $52M Bid for Texas Assets
On July 22, Singapore-based Poolin filed for Chapter 11 bankruptcy in New Jersey alongside U.S. subsidiaries Lonestar Dream Inc. and Lonestar Taproot LLC, reporting approximately $173.1 million in prepetition liabilities.
Co-Founder Kevin Pan acknowledged the company was "facing liquidity problems" while Poolin Wallet suspended withdrawals in September 2022, issuing roughly $163.7 million in IOU tokens to around 11,700 customers.
Poolin transferred customer collateral to Antalpha Technologies and borrowed roughly $213 million against cryptocurrency valued at approximately $355.8 million, which Antalpha liquidated in November 2022 when debt reached about $260 million.
Mining operations at Pyote and Tarbush facilities in West Texas ended July 10, while debtors signed a $52 million stalking-horse bid agreement with Thor CALAP LLC after marketing assets to more than 335 prospective buyers.
AI-Focused buyers have strengthened interest in the Texas properties during the auction because existing electrical systems and power capacity appeal to data center projects beyond cryptocurrency mining.
Bitcoin Miner Poolin Enters Chapter 11 with $52M Bid for Texas Assets
On July 22, Singapore-based Poolin filed for Chapter 11 bankruptcy in New Jersey alongside U.S. subsidiaries Lonestar Dream Inc. and Lonestar Taproot LLC, reporting approximately $173.1 million in prepetition liabilities.
Co-Founder Kevin Pan acknowledged the company was "facing liquidity problems" while Poolin Wallet suspended withdrawals in September 2022, issuing roughly $163.7 million in IOU tokens to around 11,700 customers.
Poolin transferred customer collateral to Antalpha Technologies and borrowed roughly $213 million against cryptocurrency valued at approximately $355.8 million, which Antalpha liquidated in November 2022 when debt reached about $260 million.
Mining operations at Pyote and Tarbush facilities in West Texas ended July 10, while debtors signed a $52 million stalking-horse bid agreement with Thor CALAP LLC after marketing assets to more than 335 prospective buyers.
AI-Focused buyers have strengthened interest in the Texas properties during the auction because existing electrical systems and power capacity appeal to data center projects beyond cryptocurrency mining.
On July 22, Singapore-based Poolin filed for Chapter 11 bankruptcy in New Jersey alongside U.S. subsidiaries Lonestar Dream Inc. and Lonestar Taproot LLC, reporting approximately $173.1 million in prepetition liabilities.
Co-Founder Kevin Pan acknowledged the company was "facing liquidity problems" while Poolin Wallet suspended withdrawals in September 2022, issuing roughly $163.7 million in IOU tokens to around 11,700 customers.
Poolin transferred customer collateral to Antalpha Technologies and borrowed roughly $213 million against cryptocurrency valued at approximately $355.8 million, which Antalpha liquidated in November 2022 when debt reached about $260 million.
Mining operations at Pyote and Tarbush facilities in West Texas ended July 10, while debtors signed a $52 million stalking-horse bid agreement with Thor CALAP LLC after marketing assets to more than 335 prospective buyers.
AI-Focused buyers have strengthened interest in the Texas properties during the auction because existing electrical systems and power capacity appeal to data center projects beyond cryptocurrency mining.

573
Log in to explore more content
Join global crypto users on Binance Square
⚡️ Get latest and useful information about crypto.
💬 Trusted by the world’s largest crypto exchange.
👍 Discover real insights from verified creators.
Email / Phone number
Trending Topics
HotCPIDecemberHikePriced
325,844 views
3,256 Discussing
CPI Market Watch | US CPI Rises 0.4% in October, Hotter Than 0.3% Forecast
Binance News
·34 Likes
·48.7k views
ZcashFallsBelow$1000ForFirstTimeSinceSeptember
9,595 views
62 Discussing
StrategyFaces$2.8BSelloffRiskFromMSCIRemoval
20,584 views
141 Discussing