
Bit_Guru
42.3k Posts

Bit_Guru
 Square Verified+
Report
Block User
Only Live Trader on Binance Square 💛 // Binance, CMC & X kols handle @bitgu_ru // PnL is always Live

Live Trader

Creator Awards 2024
Open Trade
Frequent Trader
2.6 Years
63 Following
156.6K+ Followers
300.4K+ Liked
3 Badges
Posts
Portfolio
All
Quotes
Videos
Live
PINNED
·
--
Article
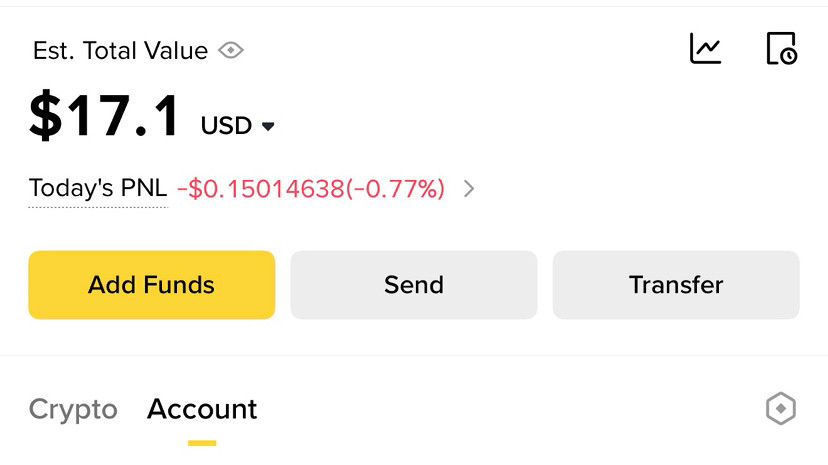
Is it possible to make $100 with only $17Many people think you need a big account to make real money in trading. That’s not true. The truth is simple it’s not about how much you start with, it’s about how you manage what you have.
Yes, it is absolutely possible to turn $17 into $100. But not by luck, not by gambling, and definitely not by chasing every pump you see. It requires discipline, patience, and a clear plan.
First, you need to understand one thing: small capital requires smart execution. You can’t afford big mistakes. One bad trade with high risk can wipe out your account. That’s why risk management becomes your strongest weapon.
Set a daily target. It doesn’t need to be huge. Even 3%–5% per day is enough. It may sound small, but consistency compounds faster than you think. If you stay disciplined, those small wins start building into something big.
Second, patience is everything. You don’t need to trade every day or every setup. Wait for clear opportunities strong support and resistance, clean breakouts, or obvious rejection zones. The market always gives chances, but only patient traders take the right ones.
Third, control your emotions. With a small account, people often overtrade because they want fast results. That’s where most fail. They increase leverage, take random entries, and ignore their plan. You have to do the opposite stay calm, follow your setup, and accept slow growth.
Another important point is consistency over hype. You don’t need one big win. You need many small correct decisions. That’s what builds your account. Even if you grow your account from $17 to $20, then $25, then $35 you are already winning.
Also, protect your capital at all costs. If you lose your account, the journey ends. If you protect it, you always have another chance.
In simple terms:
You don’t grow a small account by rushing
You grow it by repeating a disciplined process again and again
So yes, turning $17 into $100 is possible. But only for those who are willing to stay patient, follow a plan, and trade with control instead of emotion.
The market rewards consistency, not desperation
Start small
Stay focused
And let your discipline do the work
Trade Only coins Like $ETH , $BNB & $SOL
#cryptotradingpro #RiskManagementMastery
{future}(ETHUSDT)
{future}(BNBUSDT)
{future}(SOLUSDT)
Is it possible to make $100 with only $17
Many people think you need a big account to make real money in trading. That’s not true. The truth is simple it’s not about how much you start with, it’s about how you manage what you have.
Yes, it is absolutely possible to turn $17 into $100. But not by luck, not by gambling, and definitely not by chasing every pump you see. It requires discipline, patience, and a clear plan.
First, you need to understand one thing: small capital requires smart execution. You can’t afford big mistakes. One bad trade with high risk can wipe out your account. That’s why risk management becomes your strongest weapon.
Set a daily target. It doesn’t need to be huge. Even 3%–5% per day is enough. It may sound small, but consistency compounds faster than you think. If you stay disciplined, those small wins start building into something big.
Second, patience is everything. You don’t need to trade every day or every setup. Wait for clear opportunities strong support and resistance, clean breakouts, or obvious rejection zones. The market always gives chances, but only patient traders take the right ones.
Third, control your emotions. With a small account, people often overtrade because they want fast results. That’s where most fail. They increase leverage, take random entries, and ignore their plan. You have to do the opposite stay calm, follow your setup, and accept slow growth.
Another important point is consistency over hype. You don’t need one big win. You need many small correct decisions. That’s what builds your account. Even if you grow your account from $17 to $20, then $25, then $35 you are already winning.
Also, protect your capital at all costs. If you lose your account, the journey ends. If you protect it, you always have another chance.
In simple terms:
You don’t grow a small account by rushing
You grow it by repeating a disciplined process again and again
So yes, turning $17 into $100 is possible. But only for those who are willing to stay patient, follow a plan, and trade with control instead of emotion.
The market rewards consistency, not desperation
Start small
Stay focused
And let your discipline do the work
Trade Only coins Like $ETH , $BNB & $SOL
#cryptotradingpro #RiskManagementMastery
Yes, it is absolutely possible to turn $17 into $100. But not by luck, not by gambling, and definitely not by chasing every pump you see. It requires discipline, patience, and a clear plan.
First, you need to understand one thing: small capital requires smart execution. You can’t afford big mistakes. One bad trade with high risk can wipe out your account. That’s why risk management becomes your strongest weapon.
Set a daily target. It doesn’t need to be huge. Even 3%–5% per day is enough. It may sound small, but consistency compounds faster than you think. If you stay disciplined, those small wins start building into something big.
Second, patience is everything. You don’t need to trade every day or every setup. Wait for clear opportunities strong support and resistance, clean breakouts, or obvious rejection zones. The market always gives chances, but only patient traders take the right ones.
Third, control your emotions. With a small account, people often overtrade because they want fast results. That’s where most fail. They increase leverage, take random entries, and ignore their plan. You have to do the opposite stay calm, follow your setup, and accept slow growth.
Another important point is consistency over hype. You don’t need one big win. You need many small correct decisions. That’s what builds your account. Even if you grow your account from $17 to $20, then $25, then $35 you are already winning.
Also, protect your capital at all costs. If you lose your account, the journey ends. If you protect it, you always have another chance.
In simple terms:
You don’t grow a small account by rushing
You grow it by repeating a disciplined process again and again
So yes, turning $17 into $100 is possible. But only for those who are willing to stay patient, follow a plan, and trade with control instead of emotion.
The market rewards consistency, not desperation
Start small
Stay focused
And let your discipline do the work
Trade Only coins Like $ETH , $BNB & $SOL
#cryptotradingpro #RiskManagementMastery
312
55
744
689k
PINNED
·
--
Bullish
It took me 4 years in the crypto market to realize these things & you only need 2 minutes to read: 🤏
1. No matter the market condition, one thing stays the same: 8% of people will own 21 million Bitcoin.
2. Financial, capital, and risk management skills are 100 times more important than technical analysis or crypto research.
3. Earning while you sleep: There are many ways to make money in the crypto market without actively trading.
On average, #Bitcoin has increased more than 100% per year over the past 15 years. Yet, why do so few people make money? Because getting rich quickly is a common mentality. If you can't dedicate at least 4 hours a day to crypto, stick to Bitcoin and ETH—70% in BTC and 30% in ETH.
Trust no one: Trust leads to hope, disappointment, and errors. Learn independently and take responsibility for your actions. This is how to gain automatic minting experience!
The ultimate goal of investing: Make life more meaningful. If crypto investing can achieve that, do it. If not, reconsider.
Crypto is now a financial market: Originally born from technology, it's now influenced by macroeconomics and connected to mainstream financial markets.
People may discourage you from buying Bitcoin, but remember, once something is widely accepted, the opportunity might be gone. Seize your chance now!
Invest wisely, make meaningful choices, and let crypto pave the way to a better future.
#CryptoInvesting #ethbeta #Write2Earn! #BinanceTurns7 $BTC $ETH $SOL
{spot}(SOLUSDT)
{spot}(ETHUSDT)
{spot}(BTCUSDT)
It took me 4 years in the crypto market to realize these things & you only need 2 minutes to read: 🤏
1. No matter the market condition, one thing stays the same: 8% of people will own 21 million Bitcoin.
2. Financial, capital, and risk management skills are 100 times more important than technical analysis or crypto research.
3. Earning while you sleep: There are many ways to make money in the crypto market without actively trading.
On average, #Bitcoin has increased more than 100% per year over the past 15 years. Yet, why do so few people make money? Because getting rich quickly is a common mentality. If you can't dedicate at least 4 hours a day to crypto, stick to Bitcoin and ETH—70% in BTC and 30% in ETH.
Trust no one: Trust leads to hope, disappointment, and errors. Learn independently and take responsibility for your actions. This is how to gain automatic minting experience!
The ultimate goal of investing: Make life more meaningful. If crypto investing can achieve that, do it. If not, reconsider.
Crypto is now a financial market: Originally born from technology, it's now influenced by macroeconomics and connected to mainstream financial markets.
People may discourage you from buying Bitcoin, but remember, once something is widely accepted, the opportunity might be gone. Seize your chance now!
Invest wisely, make meaningful choices, and let crypto pave the way to a better future.
#CryptoInvesting #ethbeta #Write2Earn! #BinanceTurns7 $BTC $ETH $SOL
1. No matter the market condition, one thing stays the same: 8% of people will own 21 million Bitcoin.
2. Financial, capital, and risk management skills are 100 times more important than technical analysis or crypto research.
3. Earning while you sleep: There are many ways to make money in the crypto market without actively trading.
On average, #Bitcoin has increased more than 100% per year over the past 15 years. Yet, why do so few people make money? Because getting rich quickly is a common mentality. If you can't dedicate at least 4 hours a day to crypto, stick to Bitcoin and ETH—70% in BTC and 30% in ETH.
Trust no one: Trust leads to hope, disappointment, and errors. Learn independently and take responsibility for your actions. This is how to gain automatic minting experience!
The ultimate goal of investing: Make life more meaningful. If crypto investing can achieve that, do it. If not, reconsider.
Crypto is now a financial market: Originally born from technology, it's now influenced by macroeconomics and connected to mainstream financial markets.
People may discourage you from buying Bitcoin, but remember, once something is widely accepted, the opportunity might be gone. Seize your chance now!
Invest wisely, make meaningful choices, and let crypto pave the way to a better future.
#CryptoInvesting #ethbeta #Write2Earn! #BinanceTurns7 $BTC $ETH $SOL

302
102
2.2k
1.1M
·
--
Don’t miss $HEMI… ‼️ UP move!
Entry: 0.00684771 - 0.00685457
SL: 0.00680314
TP1: 0.00695333 | TP2: 0.00700270 | TP3: 0.00705208
Don’t miss $HEMI … ‼️ UP move!
Entry: 0.00684771 - 0.00685457
SL: 0.00680314
TP1: 0.00695333 | TP2: 0.00700270 | TP3: 0.00705208
Entry: 0.00684771 - 0.00685457
SL: 0.00680314
TP1: 0.00695333 | TP2: 0.00700270 | TP3: 0.00705208
59
·
--
This $LSK setup is hot… ‼️🔥 UP!
Entry: 0.13786 - 0.138
SL: 0.13722
TP1: 0.13954 | TP2: 0.14031 | TP3: 0.14108
This $LSK setup is hot… ‼️🔥 UP!
Entry: 0.13786 - 0.138
SL: 0.13722
TP1: 0.13954 | TP2: 0.14031 | TP3: 0.14108
Entry: 0.13786 - 0.138
SL: 0.13722
TP1: 0.13954 | TP2: 0.14031 | TP3: 0.14108
157
·
--
This $COTI setup is hot… ‼️🔥 DOWN!
Entry: 0.017524 - 0.017541
SL: 0.01763
TP1: 0.017316 | TP2: 0.017212 | TP3: 0.017109
This $COTI setup is hot… ‼️🔥 DOWN!
Entry: 0.017524 - 0.017541
SL: 0.01763
TP1: 0.017316 | TP2: 0.017212 | TP3: 0.017109
Entry: 0.017524 - 0.017541
SL: 0.01763
TP1: 0.017316 | TP2: 0.017212 | TP3: 0.017109
163
·
--
Wait wait wait… 🚨 $PHA UP!
Entry: 0.025102 - 0.025127
SL: 0.025051
TP1: 0.025287 | TP2: 0.025367 | TP3: 0.025447
Wait wait wait… 🚨 $PHA UP!
Entry: 0.025102 - 0.025127
SL: 0.025051
TP1: 0.025287 | TP2: 0.025367 | TP3: 0.025447
Entry: 0.025102 - 0.025127
SL: 0.025051
TP1: 0.025287 | TP2: 0.025367 | TP3: 0.025447

221
·
--
This $W setup is hot… ‼️🔥 DOWN!
Entry: 0.00955778 - 0.00956733
SL: 0.00962942
TP1: 0.00942021 | TP2: 0.00935143 | TP3: 0.00928265
This $W setup is hot… ‼️🔥 DOWN!
Entry: 0.00955778 - 0.00956733
SL: 0.00962942
TP1: 0.00942021 | TP2: 0.00935143 | TP3: 0.00928265
Entry: 0.00955778 - 0.00956733
SL: 0.00962942
TP1: 0.00942021 | TP2: 0.00935143 | TP3: 0.00928265

136
·
--
Wait… $BEAMX is getting serious! ⚡ DOWN!
Entry: 0.00159280 - 0.00159439
SL: 0.00159778
TP1: 0.00158331 | TP2: 0.00157856 | TP3: 0.00157382
Wait… $BEAMX is getting serious! ⚡ DOWN!
Entry: 0.00159280 - 0.00159439
SL: 0.00159778
TP1: 0.00158331 | TP2: 0.00157856 | TP3: 0.00157382
Entry: 0.00159280 - 0.00159439
SL: 0.00159778
TP1: 0.00158331 | TP2: 0.00157856 | TP3: 0.00157382

149
·
--
Guys, watch $YB closely… 🔥 DOWN!
Entry: 0.085983 - 0.086069
SL: 0.08624
TP1: 0.085596 | TP2: 0.085403 | TP3: 0.08521
Guys, watch $YB closely… 🔥 DOWN!
Entry: 0.085983 - 0.086069
SL: 0.08624
TP1: 0.085596 | TP2: 0.085403 | TP3: 0.08521
Entry: 0.085983 - 0.086069
SL: 0.08624
TP1: 0.085596 | TP2: 0.085403 | TP3: 0.08521

1
260
·
--
Look at $SIGN… 👀🚨 UP setup!
Entry: 0.010618 - 0.010629
SL: 0.010549
TP1: 0.010782 | TP2: 0.010858 | TP3: 0.010935
Look at $SIGN … 👀🚨 UP setup!
Entry: 0.010618 - 0.010629
SL: 0.010549
TP1: 0.010782 | TP2: 0.010858 | TP3: 0.010935
Entry: 0.010618 - 0.010629
SL: 0.010549
TP1: 0.010782 | TP2: 0.010858 | TP3: 0.010935

162
·
--
Don’t miss $BAN… ‼️ UP move!
Entry: 0.067109 - 0.067176
SL: 0.066831
TP1: 0.067858 | TP2: 0.068199 | TP3: 0.06854
Don’t miss $BAN … ‼️ UP move!
Entry: 0.067109 - 0.067176
SL: 0.066831
TP1: 0.067858 | TP2: 0.068199 | TP3: 0.06854
Entry: 0.067109 - 0.067176
SL: 0.066831
TP1: 0.067858 | TP2: 0.068199 | TP3: 0.06854

177
·
--
PHAROSUSDT: A Short-Term Pullback Setup Inside a Larger Pharos Repricing𝗣𝗛𝗔𝗥𝗢𝗦𝗨𝗦𝗗𝗧 𝗶𝗻 𝗼𝗻𝗲 𝗴𝗹𝗮𝗻𝗰𝗲
PHAROSUSDT is appearing on the RR Trader scanner as a short-side setup after a sharp period of upside volatility and a recent loss of momentum. The scanner snapshot places the pair near 0.4723 USDT, labels the direction SHORT, assigns a confidence score of 100, and classifies the asset as a TOP_LOSER. Its hot rank is 18, hot priority is 8.35, and selection score is 166.15.
Those readings describe a market condition, not a certain outcome. The immediate scanner map is narrow: support is listed at 0.4721, resistance at 0.4724, and the entry area is 0.47253615 to 0.47300845. The scanner’s invalidation level is 0.475135, while its projected downside levels are 0.46743315, 0.46488165, and 0.46233015. The model calculates a risk-reward figure of approximately 2.40.
The setup is therefore focused on a possible short-term pullback. It does not, by itself, establish that the broader Pharos project is weakening. Price remains higher over several wider measurement periods, and the available project information presents Pharos as an active Layer 1 and parallelized EVM narrative with an announced focus on real-world-asset development.
𝗪𝗵𝗮𝘁 𝗣𝗵𝗮𝗿𝗼𝘀 𝗶𝘀
The supplied CoinGecko data identifies Pharos as a Smart Contract Platform and Layer 1 project. It also places the asset in the categories Parallelized EVM and Binance Alpha Spotlight. In practical terms, that describes a blockchain network intended to support smart contracts and decentralized applications, with parallelized execution included in its technical positioning.
Parallelized execution generally refers to handling compatible transactions or operations at the same time rather than processing every task in one sequential queue. The research provides the category-level description, but it does not include performance benchmarks, independent testing, validator statistics, or confirmed network throughput. The classification should therefore be read as a description of the project’s positioning rather than as evidence of a particular level of performance.
The research also includes a news item reporting that Pharos launched a 10 million dollar incubator for real-world-asset builders. That announcement adds an RWA component to the project’s ecosystem narrative. It may help attract applications or developers, but the supplied material does not provide the names of participating teams, a deployment schedule, details about the incubator’s structure, or evidence that funded projects are already producing network activity.
One identity issue deserves attention. The market pair is shown as PHAROSUSDT, while the CoinGecko record identifies the project as Pharos and gives the token symbol PROS. The research does not provide a contract address. As a result, the market data and project data should be treated as supplied records that may refer to the same asset, but the ticker difference remains unresolved in this dataset.
𝗪𝗵𝗮𝘁 𝗶𝘀 𝘃𝗲𝗿𝗶𝗳𝗶𝗲𝗱 𝗮𝗻𝗱 𝘄𝗵𝗮𝘁 𝗶𝘀 𝗺𝗶𝘀𝘀𝗶𝗻𝗴
The supplied research does not verify the founding date, founding team, funding history, original chain launch, investors, or a detailed technical roadmap. It also does not include a whitepaper link or blockchain explorer record. Those omissions matter for any Layer 1 project because adoption depends on more than a technical label. Code quality, audits, developer activity, applications, users, validators, and actual transaction demand all influence the strength of a network.
The available data does confirm the project’s classifications as a Layer 1 and parallelized EVM platform. It also includes references to a public project identity, a GitHub organization, and social or professional accounts. However, the research does not provide repository activity, audit results, validator statistics, active addresses, daily transactions, application data, or named ecosystem deployments.
CoinGecko reports total value locked as unavailable. That means there is no verified TVL figure in the supplied research with which to measure decentralized-finance adoption. The RWA incubator announcement may be relevant to future ecosystem development, but an announcement is not the same as deployed applications, active users, or measurable demand for the token.
The research also does not confirm the exact live utility of the token. Conventional Layer 1 tokens may be used for network fees, staking, governance, incentives, or ecosystem access, but PHAROS-specific use cases are not documented in the supplied material. It is more accurate to describe utility as partly unverified than to assume that every standard Layer 1 function is already active.
𝗦𝘂𝗽𝗽𝗹𝘆 𝗮𝗻𝗱 𝘃𝗮𝗹𝘂𝗮𝘁𝗶𝗼𝗻
CoinGecko reports a total supply of 1 billion tokens and a circulating supply of 135.6 million. That places the circulating amount at approximately 13.56 percent of the reported total supply. The same record reports no fixed maximum supply and marks the supply as infinitely expandable.
The reported market capitalization is approximately 65.63 million dollars, with a CoinGecko market-cap rank of 377. Fully diluted valuation is approximately 484.01 million dollars, and the market-cap-to-FDV ratio is 0.14. This indicates a significant difference between the value attributed to the circulating supply and the theoretical value of all reported tokens.
That gap does not automatically establish that the token is overvalued or undervalued. It does highlight dilution risk. Future unlocks, emissions, allocations, or additional supply could increase the amount of tokens available to the market. The research does not include an unlock calendar, allocation breakdown, vesting schedule, treasury policy, insider holdings, or inflation rate, so the timing and scale of any future supply pressure cannot be assessed here.
Reported trading volumes also differ by source. CoinGecko lists total volume of approximately 4.09 million dollars, while the Binance ticker shows quote volume of approximately 3.52 million USDT for its measured period. Different venues, timestamps, and aggregation methods can explain the difference. Neither figure should be treated as a complete market-wide volume total.
𝗣𝗿𝗶𝗰𝗲 𝗮𝗰𝘁𝗶𝗼𝗻 𝗮𝗳𝘁𝗲𝗿 𝘁𝗵𝗲 𝗿𝗮𝗹𝗹𝘆
The latest CoinGecko snapshot places Pharos near 0.483938 dollars, with a 24-hour high of 0.520869 and a low of 0.46117. It reports a 24-hour decline of 3.47 percent. The wider performance remains positive: seven-day performance is up 17.57 percent, 14-day performance is up 16.60 percent, 30-day performance is up 27.30 percent, and 60-day performance is up 25.18 percent.
The asset is approximately 57.32 percent below its reported all-time high of 1.13 dollars and about 52.31 percent above its reported all-time low of 0.31773 dollars. These figures place the current market in a wide historical range, with substantial volatility on both sides of the latest price.
The Binance ticker gives a slightly different reading of 0.4820 USDT, down 3.542 percent over its measured 24-hour period. It records an intraday high of 0.5214, a low of 0.4602, an opening price of 0.4997, and volume of 7,312,147 PHAROS. The corresponding quote volume is approximately 3,522,930 USDT.
The scanner price of 0.4723 does not match the later ticker and CoinGecko readings. That difference is consistent with nonsynchronized snapshots and is especially important when the levels under review are only a few thousandths apart.
The hourly candles show a rapid move from the 0.48 area toward 0.5214, followed by a sharp rejection. Price then moved through 0.4695, recovered toward 0.4778, declined again to 0.4602, and later rebounded toward 0.4859 before the latest candle settled near 0.4820. On the four-hour chart, the market first traded as low as 0.4367, surged to 0.5498, and then began forming lower highs during a broad retracement.
This structure looks more like a volatile consolidation and distribution phase after an aggressive advance than a clean, one-directional collapse.
𝗪𝗵𝘆 𝘁𝗵𝗲 𝘀𝗰𝗮𝗻𝗻𝗲𝗿 𝗶𝘀 𝘄𝗮𝘁𝗰𝗵𝗶𝗻𝗴 𝗣𝗛𝗔𝗥𝗢𝗦𝗨𝗦𝗗𝗧
The scanner’s short setup is based on several short-term readings lining up. PHAROSUSDT is classified as a top loser, the recent 15-minute move is negative, and the scanner price is close to its listed local support. The projected targets at 0.46743315, 0.46488165, and 0.46233015 sit within the recent trading range. The scanner’s defined invalidation level is 0.475135, and its calculated risk-reward figure is approximately 2.40.
The key point is the conflict between timeframes. On the short timeframe, PHAROS has weakened after rejecting the 0.52 area. On the medium timeframe, it remains substantially higher than it was one week and one month earlier. The scanner is therefore identifying a potential pullback rather than proving a confirmed long-term reversal.
The 15-minute move is reported at negative 2.12 percent, while the volume ratio is 0.633. Sellers have controlled the immediate move, but the volume ratio is below one relative to the scanner’s comparison period. That may indicate that selling pressure is fading, or it may simply reflect a pause before another expansion. The data does not distinguish between those possibilities.
Open interest is reported at 4,399,155 PHAROS. Without a time series, funding data, or information about long and short positioning, that figure cannot show whether new shorts, new longs, or position closures are responsible for the latest price movement.
𝗕𝗶𝘁𝗰𝗼𝗶𝗻 𝗮𝗻𝗱 𝗯𝗿𝗼𝗮𝗱𝗲𝗿 𝗺𝗮𝗿𝗸𝗲𝘁 𝗰𝗼𝗻𝘁𝗲𝘅𝘁
The supplied BTCUSDT ticker shows Bitcoin near 77,313.30 dollars, up 0.147 percent over its measured 24-hour period. Its recorded range is 76,000.30 to 79,859.80 dollars, with quote volume of approximately 16.13 billion dollars. Bitcoin is therefore broadly steady in the supplied snapshot rather than experiencing a sharp market-wide decline.
That backdrop is less damaging than a falling Bitcoin market, but it does not remove the risk facing PHAROS. Smaller Layer 1 tokens can weaken while Bitcoin is stable because liquidity is thinner, recent gains are taken off the table, and token-specific supply concerns can dominate. PHAROS has declined during the latest session despite Bitcoin’s mild gain, suggesting that at least part of the weakness is specific to the pair or the altcoin segment.
If Bitcoin remains within the supplied range, PHAROS may continue to develop its own local structure. A decisive move below 76,000 in BTC would represent a change in the supplied market backdrop and could increase pressure across smaller altcoins. Conversely, a broad Bitcoin recovery could challenge short positions in PHAROS, particularly because the token has recently produced large intraday ranges.
𝗟𝗲𝘃𝗲𝗹𝘀, 𝗰𝗮𝘁𝗮𝗹𝘆𝘀𝘁𝘀 𝗮𝗻𝗱 𝗿𝗶𝘀𝗸𝘀
The clearest verified project catalyst is the reported 10 million dollar incubator for RWA builders. Its importance will depend on execution. The supplied news confirms the launch announcement, but not the participating teams, deployment schedule, financial structure, or resulting network activity.
For the immediate market structure, the scanner lists support at 0.4721 and resistance at 0.4724, with the scanner entry band at 0.47253615 to 0.47300845. A move toward 0.475135 would invalidate the specific scanner structure. Above that, the recent recovery area around 0.4777 to 0.4817 becomes relevant, followed by 0.4859 and the broader 0.4997 to 0.5214 region.
On the downside, the scanner targets are 0.46743315, 0.46488165, and 0.46233015. The recent market low near 0.4602 to 0.4615 represents a larger reaction zone than the very narrow scanner support. Price has already shown the ability to rebound sharply from that lower area, so a move toward it would not automatically imply a straight continuation lower.
The central risks are clear. Circulating supply is low relative to total supply, fully diluted valuation is much higher than market capitalization, and maximum supply is listed as infinite. Unlock details are unavailable. The PHAROSUSDT and PROS ticker mismatch creates an identification risk. The research also contains no verified TVL, audit information, token allocation, or confirmed network-usage figures.
Price volatility adds another layer of uncertainty. The four-hour record includes a move from below 0.44 to above 0.54, while the latest 24-hour range spans approximately 0.46 to 0.52. Narrow scanner levels can therefore be reached or invalidated quickly.
𝗕𝗮𝗹𝗮𝗻𝗰𝗲𝗱 𝗰𝗼𝗻𝗰𝗹𝘂𝘀𝗶𝗼𝗻
PHAROSUSDT is compelling because the technical and project narratives are moving at different speeds. The scanner identifies a short-term bearish structure after a sharp rejection and a recent loss of momentum. The data supports that reading: the pair is down over the latest session, the immediate price is near local support, and the scanner’s downside levels extend toward 0.4674, 0.4649, and 0.4623.
The wider picture is not simply bearish. Pharos remains higher over seven, fourteen, thirty, and sixty days. It is categorized as a parallelized EVM Layer 1, and the announced RWA incubator may become an ecosystem driver if it produces applications, developers, and measurable network activity. Bitcoin is also relatively stable in the supplied snapshot, providing no evidence of a broad panic event.
The balanced interpretation is that PHAROS may be entering a short-term cooling phase within a still-developing project narrative. A sustained break below the 0.46 region would weaken the recent recovery structure, while a move back above 0.4751 and then the 0.48 to 0.486 area would challenge the scanner’s bearish setup.
Beyond price, the largest unresolved questions concern ticker identity, token supply schedules, live utility, developer activity, and actual network usage. Until those areas become clearer, PHAROS remains a high-volatility market with an intriguing Layer 1 and RWA narrative, but also with meaningful dilution, identification, liquidity, and execution risks.
PHAROSUSDT: A Short-Term Pullback Setup Inside a Larger Pharos Repricing
𝗣𝗛𝗔𝗥𝗢𝗦𝗨𝗦𝗗𝗧 𝗶𝗻 𝗼𝗻𝗲 𝗴𝗹𝗮𝗻𝗰𝗲
PHAROSUSDT is appearing on the RR Trader scanner as a short-side setup after a sharp period of upside volatility and a recent loss of momentum. The scanner snapshot places the pair near 0.4723 USDT, labels the direction SHORT, assigns a confidence score of 100, and classifies the asset as a TOP_LOSER. Its hot rank is 18, hot priority is 8.35, and selection score is 166.15.
Those readings describe a market condition, not a certain outcome. The immediate scanner map is narrow: support is listed at 0.4721, resistance at 0.4724, and the entry area is 0.47253615 to 0.47300845. The scanner’s invalidation level is 0.475135, while its projected downside levels are 0.46743315, 0.46488165, and 0.46233015. The model calculates a risk-reward figure of approximately 2.40.
The setup is therefore focused on a possible short-term pullback. It does not, by itself, establish that the broader Pharos project is weakening. Price remains higher over several wider measurement periods, and the available project information presents Pharos as an active Layer 1 and parallelized EVM narrative with an announced focus on real-world-asset development.
𝗪𝗵𝗮𝘁 𝗣𝗵𝗮𝗿𝗼𝘀 𝗶𝘀
The supplied CoinGecko data identifies Pharos as a Smart Contract Platform and Layer 1 project. It also places the asset in the categories Parallelized EVM and Binance Alpha Spotlight. In practical terms, that describes a blockchain network intended to support smart contracts and decentralized applications, with parallelized execution included in its technical positioning.
Parallelized execution generally refers to handling compatible transactions or operations at the same time rather than processing every task in one sequential queue. The research provides the category-level description, but it does not include performance benchmarks, independent testing, validator statistics, or confirmed network throughput. The classification should therefore be read as a description of the project’s positioning rather than as evidence of a particular level of performance.
The research also includes a news item reporting that Pharos launched a 10 million dollar incubator for real-world-asset builders. That announcement adds an RWA component to the project’s ecosystem narrative. It may help attract applications or developers, but the supplied material does not provide the names of participating teams, a deployment schedule, details about the incubator’s structure, or evidence that funded projects are already producing network activity.
One identity issue deserves attention. The market pair is shown as PHAROSUSDT, while the CoinGecko record identifies the project as Pharos and gives the token symbol PROS. The research does not provide a contract address. As a result, the market data and project data should be treated as supplied records that may refer to the same asset, but the ticker difference remains unresolved in this dataset.
𝗪𝗵𝗮𝘁 𝗶𝘀 𝘃𝗲𝗿𝗶𝗳𝗶𝗲𝗱 𝗮𝗻𝗱 𝘄𝗵𝗮𝘁 𝗶𝘀 𝗺𝗶𝘀𝘀𝗶𝗻𝗴
The supplied research does not verify the founding date, founding team, funding history, original chain launch, investors, or a detailed technical roadmap. It also does not include a whitepaper link or blockchain explorer record. Those omissions matter for any Layer 1 project because adoption depends on more than a technical label. Code quality, audits, developer activity, applications, users, validators, and actual transaction demand all influence the strength of a network.
The available data does confirm the project’s classifications as a Layer 1 and parallelized EVM platform. It also includes references to a public project identity, a GitHub organization, and social or professional accounts. However, the research does not provide repository activity, audit results, validator statistics, active addresses, daily transactions, application data, or named ecosystem deployments.
CoinGecko reports total value locked as unavailable. That means there is no verified TVL figure in the supplied research with which to measure decentralized-finance adoption. The RWA incubator announcement may be relevant to future ecosystem development, but an announcement is not the same as deployed applications, active users, or measurable demand for the token.
The research also does not confirm the exact live utility of the token. Conventional Layer 1 tokens may be used for network fees, staking, governance, incentives, or ecosystem access, but PHAROS-specific use cases are not documented in the supplied material. It is more accurate to describe utility as partly unverified than to assume that every standard Layer 1 function is already active.
𝗦𝘂𝗽𝗽𝗹𝘆 𝗮𝗻𝗱 𝘃𝗮𝗹𝘂𝗮𝘁𝗶𝗼𝗻
CoinGecko reports a total supply of 1 billion tokens and a circulating supply of 135.6 million. That places the circulating amount at approximately 13.56 percent of the reported total supply. The same record reports no fixed maximum supply and marks the supply as infinitely expandable.
The reported market capitalization is approximately 65.63 million dollars, with a CoinGecko market-cap rank of 377. Fully diluted valuation is approximately 484.01 million dollars, and the market-cap-to-FDV ratio is 0.14. This indicates a significant difference between the value attributed to the circulating supply and the theoretical value of all reported tokens.
That gap does not automatically establish that the token is overvalued or undervalued. It does highlight dilution risk. Future unlocks, emissions, allocations, or additional supply could increase the amount of tokens available to the market. The research does not include an unlock calendar, allocation breakdown, vesting schedule, treasury policy, insider holdings, or inflation rate, so the timing and scale of any future supply pressure cannot be assessed here.
Reported trading volumes also differ by source. CoinGecko lists total volume of approximately 4.09 million dollars, while the Binance ticker shows quote volume of approximately 3.52 million USDT for its measured period. Different venues, timestamps, and aggregation methods can explain the difference. Neither figure should be treated as a complete market-wide volume total.
𝗣𝗿𝗶𝗰𝗲 𝗮𝗰𝘁𝗶𝗼𝗻 𝗮𝗳𝘁𝗲𝗿 𝘁𝗵𝗲 𝗿𝗮𝗹𝗹𝘆
The latest CoinGecko snapshot places Pharos near 0.483938 dollars, with a 24-hour high of 0.520869 and a low of 0.46117. It reports a 24-hour decline of 3.47 percent. The wider performance remains positive: seven-day performance is up 17.57 percent, 14-day performance is up 16.60 percent, 30-day performance is up 27.30 percent, and 60-day performance is up 25.18 percent.
The asset is approximately 57.32 percent below its reported all-time high of 1.13 dollars and about 52.31 percent above its reported all-time low of 0.31773 dollars. These figures place the current market in a wide historical range, with substantial volatility on both sides of the latest price.
The Binance ticker gives a slightly different reading of 0.4820 USDT, down 3.542 percent over its measured 24-hour period. It records an intraday high of 0.5214, a low of 0.4602, an opening price of 0.4997, and volume of 7,312,147 PHAROS. The corresponding quote volume is approximately 3,522,930 USDT.
The scanner price of 0.4723 does not match the later ticker and CoinGecko readings. That difference is consistent with nonsynchronized snapshots and is especially important when the levels under review are only a few thousandths apart.
The hourly candles show a rapid move from the 0.48 area toward 0.5214, followed by a sharp rejection. Price then moved through 0.4695, recovered toward 0.4778, declined again to 0.4602, and later rebounded toward 0.4859 before the latest candle settled near 0.4820. On the four-hour chart, the market first traded as low as 0.4367, surged to 0.5498, and then began forming lower highs during a broad retracement.
This structure looks more like a volatile consolidation and distribution phase after an aggressive advance than a clean, one-directional collapse.
𝗪𝗵𝘆 𝘁𝗵𝗲 𝘀𝗰𝗮𝗻𝗻𝗲𝗿 𝗶𝘀 𝘄𝗮𝘁𝗰𝗵𝗶𝗻𝗴 𝗣𝗛𝗔𝗥𝗢𝗦𝗨𝗦𝗗𝗧
The scanner’s short setup is based on several short-term readings lining up. PHAROSUSDT is classified as a top loser, the recent 15-minute move is negative, and the scanner price is close to its listed local support. The projected targets at 0.46743315, 0.46488165, and 0.46233015 sit within the recent trading range. The scanner’s defined invalidation level is 0.475135, and its calculated risk-reward figure is approximately 2.40.
The key point is the conflict between timeframes. On the short timeframe, PHAROS has weakened after rejecting the 0.52 area. On the medium timeframe, it remains substantially higher than it was one week and one month earlier. The scanner is therefore identifying a potential pullback rather than proving a confirmed long-term reversal.
The 15-minute move is reported at negative 2.12 percent, while the volume ratio is 0.633. Sellers have controlled the immediate move, but the volume ratio is below one relative to the scanner’s comparison period. That may indicate that selling pressure is fading, or it may simply reflect a pause before another expansion. The data does not distinguish between those possibilities.
Open interest is reported at 4,399,155 PHAROS. Without a time series, funding data, or information about long and short positioning, that figure cannot show whether new shorts, new longs, or position closures are responsible for the latest price movement.
𝗕𝗶𝘁𝗰𝗼𝗶𝗻 𝗮𝗻𝗱 𝗯𝗿𝗼𝗮𝗱𝗲𝗿 𝗺𝗮𝗿𝗸𝗲𝘁 𝗰𝗼𝗻𝘁𝗲𝘅𝘁
The supplied BTCUSDT ticker shows Bitcoin near 77,313.30 dollars, up 0.147 percent over its measured 24-hour period. Its recorded range is 76,000.30 to 79,859.80 dollars, with quote volume of approximately 16.13 billion dollars. Bitcoin is therefore broadly steady in the supplied snapshot rather than experiencing a sharp market-wide decline.
That backdrop is less damaging than a falling Bitcoin market, but it does not remove the risk facing PHAROS. Smaller Layer 1 tokens can weaken while Bitcoin is stable because liquidity is thinner, recent gains are taken off the table, and token-specific supply concerns can dominate. PHAROS has declined during the latest session despite Bitcoin’s mild gain, suggesting that at least part of the weakness is specific to the pair or the altcoin segment.
If Bitcoin remains within the supplied range, PHAROS may continue to develop its own local structure. A decisive move below 76,000 in BTC would represent a change in the supplied market backdrop and could increase pressure across smaller altcoins. Conversely, a broad Bitcoin recovery could challenge short positions in PHAROS, particularly because the token has recently produced large intraday ranges.
𝗟𝗲𝘃𝗲𝗹𝘀, 𝗰𝗮𝘁𝗮𝗹𝘆𝘀𝘁𝘀 𝗮𝗻𝗱 𝗿𝗶𝘀𝗸𝘀
The clearest verified project catalyst is the reported 10 million dollar incubator for RWA builders. Its importance will depend on execution. The supplied news confirms the launch announcement, but not the participating teams, deployment schedule, financial structure, or resulting network activity.
For the immediate market structure, the scanner lists support at 0.4721 and resistance at 0.4724, with the scanner entry band at 0.47253615 to 0.47300845. A move toward 0.475135 would invalidate the specific scanner structure. Above that, the recent recovery area around 0.4777 to 0.4817 becomes relevant, followed by 0.4859 and the broader 0.4997 to 0.5214 region.
On the downside, the scanner targets are 0.46743315, 0.46488165, and 0.46233015. The recent market low near 0.4602 to 0.4615 represents a larger reaction zone than the very narrow scanner support. Price has already shown the ability to rebound sharply from that lower area, so a move toward it would not automatically imply a straight continuation lower.
The central risks are clear. Circulating supply is low relative to total supply, fully diluted valuation is much higher than market capitalization, and maximum supply is listed as infinite. Unlock details are unavailable. The PHAROSUSDT and PROS ticker mismatch creates an identification risk. The research also contains no verified TVL, audit information, token allocation, or confirmed network-usage figures.
Price volatility adds another layer of uncertainty. The four-hour record includes a move from below 0.44 to above 0.54, while the latest 24-hour range spans approximately 0.46 to 0.52. Narrow scanner levels can therefore be reached or invalidated quickly.
𝗕𝗮𝗹𝗮𝗻𝗰𝗲𝗱 𝗰𝗼𝗻𝗰𝗹𝘂𝘀𝗶𝗼𝗻
PHAROSUSDT is compelling because the technical and project narratives are moving at different speeds. The scanner identifies a short-term bearish structure after a sharp rejection and a recent loss of momentum. The data supports that reading: the pair is down over the latest session, the immediate price is near local support, and the scanner’s downside levels extend toward 0.4674, 0.4649, and 0.4623.
The wider picture is not simply bearish. Pharos remains higher over seven, fourteen, thirty, and sixty days. It is categorized as a parallelized EVM Layer 1, and the announced RWA incubator may become an ecosystem driver if it produces applications, developers, and measurable network activity. Bitcoin is also relatively stable in the supplied snapshot, providing no evidence of a broad panic event.
The balanced interpretation is that PHAROS may be entering a short-term cooling phase within a still-developing project narrative. A sustained break below the 0.46 region would weaken the recent recovery structure, while a move back above 0.4751 and then the 0.48 to 0.486 area would challenge the scanner’s bearish setup.
Beyond price, the largest unresolved questions concern ticker identity, token supply schedules, live utility, developer activity, and actual network usage. Until those areas become clearer, PHAROS remains a high-volatility market with an intriguing Layer 1 and RWA narrative, but also with meaningful dilution, identification, liquidity, and execution risks.
PHAROSUSDT is appearing on the RR Trader scanner as a short-side setup after a sharp period of upside volatility and a recent loss of momentum. The scanner snapshot places the pair near 0.4723 USDT, labels the direction SHORT, assigns a confidence score of 100, and classifies the asset as a TOP_LOSER. Its hot rank is 18, hot priority is 8.35, and selection score is 166.15.
Those readings describe a market condition, not a certain outcome. The immediate scanner map is narrow: support is listed at 0.4721, resistance at 0.4724, and the entry area is 0.47253615 to 0.47300845. The scanner’s invalidation level is 0.475135, while its projected downside levels are 0.46743315, 0.46488165, and 0.46233015. The model calculates a risk-reward figure of approximately 2.40.
The setup is therefore focused on a possible short-term pullback. It does not, by itself, establish that the broader Pharos project is weakening. Price remains higher over several wider measurement periods, and the available project information presents Pharos as an active Layer 1 and parallelized EVM narrative with an announced focus on real-world-asset development.
𝗪𝗵𝗮𝘁 𝗣𝗵𝗮𝗿𝗼𝘀 𝗶𝘀
The supplied CoinGecko data identifies Pharos as a Smart Contract Platform and Layer 1 project. It also places the asset in the categories Parallelized EVM and Binance Alpha Spotlight. In practical terms, that describes a blockchain network intended to support smart contracts and decentralized applications, with parallelized execution included in its technical positioning.
Parallelized execution generally refers to handling compatible transactions or operations at the same time rather than processing every task in one sequential queue. The research provides the category-level description, but it does not include performance benchmarks, independent testing, validator statistics, or confirmed network throughput. The classification should therefore be read as a description of the project’s positioning rather than as evidence of a particular level of performance.
The research also includes a news item reporting that Pharos launched a 10 million dollar incubator for real-world-asset builders. That announcement adds an RWA component to the project’s ecosystem narrative. It may help attract applications or developers, but the supplied material does not provide the names of participating teams, a deployment schedule, details about the incubator’s structure, or evidence that funded projects are already producing network activity.
One identity issue deserves attention. The market pair is shown as PHAROSUSDT, while the CoinGecko record identifies the project as Pharos and gives the token symbol PROS. The research does not provide a contract address. As a result, the market data and project data should be treated as supplied records that may refer to the same asset, but the ticker difference remains unresolved in this dataset.
𝗪𝗵𝗮𝘁 𝗶𝘀 𝘃𝗲𝗿𝗶𝗳𝗶𝗲𝗱 𝗮𝗻𝗱 𝘄𝗵𝗮𝘁 𝗶𝘀 𝗺𝗶𝘀𝘀𝗶𝗻𝗴
The supplied research does not verify the founding date, founding team, funding history, original chain launch, investors, or a detailed technical roadmap. It also does not include a whitepaper link or blockchain explorer record. Those omissions matter for any Layer 1 project because adoption depends on more than a technical label. Code quality, audits, developer activity, applications, users, validators, and actual transaction demand all influence the strength of a network.
The available data does confirm the project’s classifications as a Layer 1 and parallelized EVM platform. It also includes references to a public project identity, a GitHub organization, and social or professional accounts. However, the research does not provide repository activity, audit results, validator statistics, active addresses, daily transactions, application data, or named ecosystem deployments.
CoinGecko reports total value locked as unavailable. That means there is no verified TVL figure in the supplied research with which to measure decentralized-finance adoption. The RWA incubator announcement may be relevant to future ecosystem development, but an announcement is not the same as deployed applications, active users, or measurable demand for the token.
The research also does not confirm the exact live utility of the token. Conventional Layer 1 tokens may be used for network fees, staking, governance, incentives, or ecosystem access, but PHAROS-specific use cases are not documented in the supplied material. It is more accurate to describe utility as partly unverified than to assume that every standard Layer 1 function is already active.
𝗦𝘂𝗽𝗽𝗹𝘆 𝗮𝗻𝗱 𝘃𝗮𝗹𝘂𝗮𝘁𝗶𝗼𝗻
CoinGecko reports a total supply of 1 billion tokens and a circulating supply of 135.6 million. That places the circulating amount at approximately 13.56 percent of the reported total supply. The same record reports no fixed maximum supply and marks the supply as infinitely expandable.
The reported market capitalization is approximately 65.63 million dollars, with a CoinGecko market-cap rank of 377. Fully diluted valuation is approximately 484.01 million dollars, and the market-cap-to-FDV ratio is 0.14. This indicates a significant difference between the value attributed to the circulating supply and the theoretical value of all reported tokens.
That gap does not automatically establish that the token is overvalued or undervalued. It does highlight dilution risk. Future unlocks, emissions, allocations, or additional supply could increase the amount of tokens available to the market. The research does not include an unlock calendar, allocation breakdown, vesting schedule, treasury policy, insider holdings, or inflation rate, so the timing and scale of any future supply pressure cannot be assessed here.
Reported trading volumes also differ by source. CoinGecko lists total volume of approximately 4.09 million dollars, while the Binance ticker shows quote volume of approximately 3.52 million USDT for its measured period. Different venues, timestamps, and aggregation methods can explain the difference. Neither figure should be treated as a complete market-wide volume total.
𝗣𝗿𝗶𝗰𝗲 𝗮𝗰𝘁𝗶𝗼𝗻 𝗮𝗳𝘁𝗲𝗿 𝘁𝗵𝗲 𝗿𝗮𝗹𝗹𝘆
The latest CoinGecko snapshot places Pharos near 0.483938 dollars, with a 24-hour high of 0.520869 and a low of 0.46117. It reports a 24-hour decline of 3.47 percent. The wider performance remains positive: seven-day performance is up 17.57 percent, 14-day performance is up 16.60 percent, 30-day performance is up 27.30 percent, and 60-day performance is up 25.18 percent.
The asset is approximately 57.32 percent below its reported all-time high of 1.13 dollars and about 52.31 percent above its reported all-time low of 0.31773 dollars. These figures place the current market in a wide historical range, with substantial volatility on both sides of the latest price.
The Binance ticker gives a slightly different reading of 0.4820 USDT, down 3.542 percent over its measured 24-hour period. It records an intraday high of 0.5214, a low of 0.4602, an opening price of 0.4997, and volume of 7,312,147 PHAROS. The corresponding quote volume is approximately 3,522,930 USDT.
The scanner price of 0.4723 does not match the later ticker and CoinGecko readings. That difference is consistent with nonsynchronized snapshots and is especially important when the levels under review are only a few thousandths apart.
The hourly candles show a rapid move from the 0.48 area toward 0.5214, followed by a sharp rejection. Price then moved through 0.4695, recovered toward 0.4778, declined again to 0.4602, and later rebounded toward 0.4859 before the latest candle settled near 0.4820. On the four-hour chart, the market first traded as low as 0.4367, surged to 0.5498, and then began forming lower highs during a broad retracement.
This structure looks more like a volatile consolidation and distribution phase after an aggressive advance than a clean, one-directional collapse.
𝗪𝗵𝘆 𝘁𝗵𝗲 𝘀𝗰𝗮𝗻𝗻𝗲𝗿 𝗶𝘀 𝘄𝗮𝘁𝗰𝗵𝗶𝗻𝗴 𝗣𝗛𝗔𝗥𝗢𝗦𝗨𝗦𝗗𝗧
The scanner’s short setup is based on several short-term readings lining up. PHAROSUSDT is classified as a top loser, the recent 15-minute move is negative, and the scanner price is close to its listed local support. The projected targets at 0.46743315, 0.46488165, and 0.46233015 sit within the recent trading range. The scanner’s defined invalidation level is 0.475135, and its calculated risk-reward figure is approximately 2.40.
The key point is the conflict between timeframes. On the short timeframe, PHAROS has weakened after rejecting the 0.52 area. On the medium timeframe, it remains substantially higher than it was one week and one month earlier. The scanner is therefore identifying a potential pullback rather than proving a confirmed long-term reversal.
The 15-minute move is reported at negative 2.12 percent, while the volume ratio is 0.633. Sellers have controlled the immediate move, but the volume ratio is below one relative to the scanner’s comparison period. That may indicate that selling pressure is fading, or it may simply reflect a pause before another expansion. The data does not distinguish between those possibilities.
Open interest is reported at 4,399,155 PHAROS. Without a time series, funding data, or information about long and short positioning, that figure cannot show whether new shorts, new longs, or position closures are responsible for the latest price movement.
𝗕𝗶𝘁𝗰𝗼𝗶𝗻 𝗮𝗻𝗱 𝗯𝗿𝗼𝗮𝗱𝗲𝗿 𝗺𝗮𝗿𝗸𝗲𝘁 𝗰𝗼𝗻𝘁𝗲𝘅𝘁
The supplied BTCUSDT ticker shows Bitcoin near 77,313.30 dollars, up 0.147 percent over its measured 24-hour period. Its recorded range is 76,000.30 to 79,859.80 dollars, with quote volume of approximately 16.13 billion dollars. Bitcoin is therefore broadly steady in the supplied snapshot rather than experiencing a sharp market-wide decline.
That backdrop is less damaging than a falling Bitcoin market, but it does not remove the risk facing PHAROS. Smaller Layer 1 tokens can weaken while Bitcoin is stable because liquidity is thinner, recent gains are taken off the table, and token-specific supply concerns can dominate. PHAROS has declined during the latest session despite Bitcoin’s mild gain, suggesting that at least part of the weakness is specific to the pair or the altcoin segment.
If Bitcoin remains within the supplied range, PHAROS may continue to develop its own local structure. A decisive move below 76,000 in BTC would represent a change in the supplied market backdrop and could increase pressure across smaller altcoins. Conversely, a broad Bitcoin recovery could challenge short positions in PHAROS, particularly because the token has recently produced large intraday ranges.
𝗟𝗲𝘃𝗲𝗹𝘀, 𝗰𝗮𝘁𝗮𝗹𝘆𝘀𝘁𝘀 𝗮𝗻𝗱 𝗿𝗶𝘀𝗸𝘀
The clearest verified project catalyst is the reported 10 million dollar incubator for RWA builders. Its importance will depend on execution. The supplied news confirms the launch announcement, but not the participating teams, deployment schedule, financial structure, or resulting network activity.
For the immediate market structure, the scanner lists support at 0.4721 and resistance at 0.4724, with the scanner entry band at 0.47253615 to 0.47300845. A move toward 0.475135 would invalidate the specific scanner structure. Above that, the recent recovery area around 0.4777 to 0.4817 becomes relevant, followed by 0.4859 and the broader 0.4997 to 0.5214 region.
On the downside, the scanner targets are 0.46743315, 0.46488165, and 0.46233015. The recent market low near 0.4602 to 0.4615 represents a larger reaction zone than the very narrow scanner support. Price has already shown the ability to rebound sharply from that lower area, so a move toward it would not automatically imply a straight continuation lower.
The central risks are clear. Circulating supply is low relative to total supply, fully diluted valuation is much higher than market capitalization, and maximum supply is listed as infinite. Unlock details are unavailable. The PHAROSUSDT and PROS ticker mismatch creates an identification risk. The research also contains no verified TVL, audit information, token allocation, or confirmed network-usage figures.
Price volatility adds another layer of uncertainty. The four-hour record includes a move from below 0.44 to above 0.54, while the latest 24-hour range spans approximately 0.46 to 0.52. Narrow scanner levels can therefore be reached or invalidated quickly.
𝗕𝗮𝗹𝗮𝗻𝗰𝗲𝗱 𝗰𝗼𝗻𝗰𝗹𝘂𝘀𝗶𝗼𝗻
PHAROSUSDT is compelling because the technical and project narratives are moving at different speeds. The scanner identifies a short-term bearish structure after a sharp rejection and a recent loss of momentum. The data supports that reading: the pair is down over the latest session, the immediate price is near local support, and the scanner’s downside levels extend toward 0.4674, 0.4649, and 0.4623.
The wider picture is not simply bearish. Pharos remains higher over seven, fourteen, thirty, and sixty days. It is categorized as a parallelized EVM Layer 1, and the announced RWA incubator may become an ecosystem driver if it produces applications, developers, and measurable network activity. Bitcoin is also relatively stable in the supplied snapshot, providing no evidence of a broad panic event.
The balanced interpretation is that PHAROS may be entering a short-term cooling phase within a still-developing project narrative. A sustained break below the 0.46 region would weaken the recent recovery structure, while a move back above 0.4751 and then the 0.48 to 0.486 area would challenge the scanner’s bearish setup.
Beyond price, the largest unresolved questions concern ticker identity, token supply schedules, live utility, developer activity, and actual network usage. Until those areas become clearer, PHAROS remains a high-volatility market with an intriguing Layer 1 and RWA narrative, but also with meaningful dilution, identification, liquidity, and execution risks.
243
·
--
$AKE is moving… 🚨🔥 UP!
Entry: 0.014105 - 0.014119
SL: 0.014013
TP1: 0.014322 | TP2: 0.014424 | TP3: 0.014526
$AKE is moving… 🚨🔥 UP!
Entry: 0.014105 - 0.014119
SL: 0.014013
TP1: 0.014322 | TP2: 0.014424 | TP3: 0.014526
Entry: 0.014105 - 0.014119
SL: 0.014013
TP1: 0.014322 | TP2: 0.014424 | TP3: 0.014526

1
382
·
--
My community, look at $TIA… ✅ DOWN!
Entry: 0.35748 - 0.35784
SL: 0.36028
TP1: 0.35233 | TP2: 0.34976 | TP3: 0.34719
My community, look at $TIA … ✅ DOWN!
Entry: 0.35748 - 0.35784
SL: 0.36028
TP1: 0.35233 | TP2: 0.34976 | TP3: 0.34719
Entry: 0.35748 - 0.35784
SL: 0.36028
TP1: 0.35233 | TP2: 0.34976 | TP3: 0.34719

291
·
--
Heads up… 🚨 $AVAAI UP!
Entry: 0.00887467 - 0.00888356
SL: 0.00881690
TP1: 0.00901154 | TP2: 0.00907554 | TP3: 0.00913953
Heads up… 🚨 $AVAAI UP!
Entry: 0.00887467 - 0.00888356
SL: 0.00881690
TP1: 0.00901154 | TP2: 0.00907554 | TP3: 0.00913953
Entry: 0.00887467 - 0.00888356
SL: 0.00881690
TP1: 0.00901154 | TP2: 0.00907554 | TP3: 0.00913953

1
362
·
--
Wait… $USDC is getting serious! ⚡ DOWN!
Entry: 1.0002 - 1.0012
SL: 1.0028
TP1: 0.99565 | TP2: 0.9934 | TP3: 0.99115
Wait… $USDC is getting serious! ⚡ DOWN!
Entry: 1.0002 - 1.0012
SL: 1.0028
TP1: 0.99565 | TP2: 0.9934 | TP3: 0.99115
Entry: 1.0002 - 1.0012
SL: 1.0028
TP1: 0.99565 | TP2: 0.9934 | TP3: 0.99115

185
·
--
Wait wait wait… 🚨 $BASED UP!
Entry: 0.065452 - 0.065517
SL: 0.065026
TP1: 0.066461 | TP2: 0.066933 | TP3: 0.067405
Wait wait wait… 🚨 $BASED UP!
Entry: 0.065452 - 0.065517
SL: 0.065026
TP1: 0.066461 | TP2: 0.066933 | TP3: 0.067405
Entry: 0.065452 - 0.065517
SL: 0.065026
TP1: 0.066461 | TP2: 0.066933 | TP3: 0.067405

305
·
--
Look at $DOGS… 👀🚨 UP setup!
Entry: 0.0000526908 - 0.0000527436
SL: 0.0000523478
TP1: 0.0000535035 | TP2: 0.0000538834 | TP3: 0.0000542634
Look at $DOGS … 👀🚨 UP setup!
Entry: 0.0000526908 - 0.0000527436
SL: 0.0000523478
TP1: 0.0000535035 | TP2: 0.0000538834 | TP3: 0.0000542634
Entry: 0.0000526908 - 0.0000527436
SL: 0.0000523478
TP1: 0.0000535035 | TP2: 0.0000538834 | TP3: 0.0000542634

1
291
·
--
Wait… $PHAROS is getting serious! ⚡ DOWN!
Entry: 0.47224 - 0.47271
SL: 0.47483
TP1: 0.46713 | TP2: 0.46458 | TP3: 0.46203
Wait… $PHAROS is getting serious! ⚡ DOWN!
Entry: 0.47224 - 0.47271
SL: 0.47483
TP1: 0.46713 | TP2: 0.46458 | TP3: 0.46203
Entry: 0.47224 - 0.47271
SL: 0.47483
TP1: 0.46713 | TP2: 0.46458 | TP3: 0.46203

206
·
--
Wait… $ORDI is getting serious! ⚡ DOWN!
Entry: 3.969 - 3.973
SL: 3.9987
TP1: 3.9119 | TP2: 3.8833 | TP3: 3.8547
Wait… $ORDI is getting serious! ⚡ DOWN!
Entry: 3.969 - 3.973
SL: 3.9987
TP1: 3.9119 | TP2: 3.8833 | TP3: 3.8547
Entry: 3.969 - 3.973
SL: 3.9987
TP1: 3.9119 | TP2: 3.8833 | TP3: 3.8547

425
Log in to explore more content
Join global crypto users on Binance Square
⚡️ Get latest and useful information about crypto.
💬 Trusted by the world’s largest crypto exchange.
👍 Discover real insights from verified creators.
Email / Phone number
Trending Topics
CPIWatch
87M views
502,840 Discussing
Share & Win Traffic Reward in our Trending Hashtag Campaign
✨Topic: Will CPI Trigger Rate Hike?
👉How to Join:
Publish a short post or article with hashtag #CPIWatch
Create content based on the below two angles:
- Nonfarm payrolls beat expectations and CPI is around the corner, do you think the Fed will hike or hold the rate?
- Bullish or bearish? Share your take and showcase your stocks or gold trade/holdings with our trade sharing widget.
🚀Campaign Period:
- 2026-09-11 3:00 - 2026-09-12 9:00 UTC
🎁Reward:
- Qualified posts that comply with the above guidelines and contain more than 100 words will be reviewed and may receive a random traffic boost of 500 to 3,000 views. You will receive a notification from your feed secretary if your post is selected.
- Get a chance to have your article featured on Binance Square Official
Need ideas for your post? Visit the topic page #CPIWatch or the Square Guide on How to Post for Better Reach.
Binance Square Official
·550 Likes
·1.4M views
BitcoinReboundsAbove$79KAfterCPI
3,298 views
132 Discussing
BNBTops730USDT
26,337 views
697 Discussing