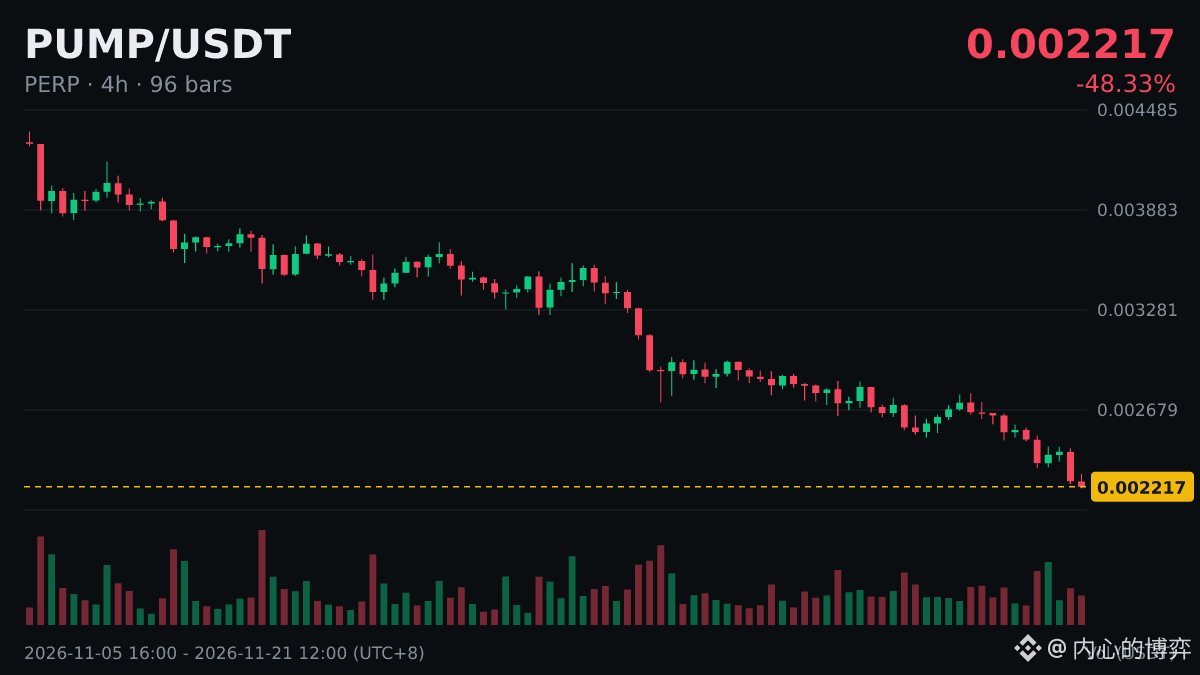
$PUMP |4-hour RSI(14) 24.8|Oversold
Before looking at money flows, first understand RSI.
RSI (Relative Strength Index) was introduced by Welles Wilder in 1978. It is calculated using the average gains and average losses over the most recent 14 candlesticks, and ranges from 0 to 100.
“Divergence” is a commonly discussed way to interpret RSI: when the price reaches a new high but RSI does not, it is often seen as a sign that upward momentum is weakening. However, divergence can also persist for a long time.
Comparing several indicators is more reliable than looking at just one, but even multiple indicators cannot provide a definitive conclusion.
#PUMP
Before looking at money flows, first understand RSI.
RSI (Relative Strength Index) was introduced by Welles Wilder in 1978. It is calculated using the average gains and average losses over the most recent 14 candlesticks, and ranges from 0 to 100.
“Divergence” is a commonly discussed way to interpret RSI: when the price reaches a new high but RSI does not, it is often seen as a sign that upward momentum is weakening. However, divergence can also persist for a long time.
Comparing several indicators is more reliable than looking at just one, but even multiple indicators cannot provide a definitive conclusion.
#PUMP