#技术分析 $ZRO The price action over the past two days has been pretty interesting
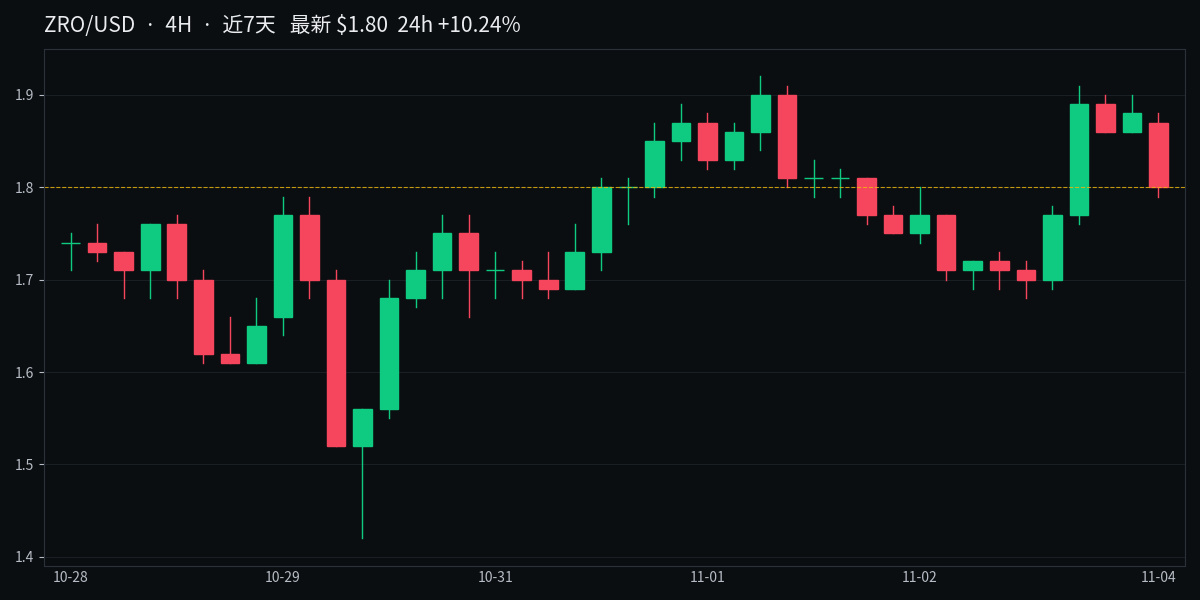
After hitting 1.42 on October 30, it climbed in a V-shape, reaching 1.92 on November 2—a 35% gain in three days.
Then it stopped pushing higher and started moving sideways in the 1.68–1.92 range.
It made another run at 1.91 this morning, but couldn’t hold there and is now back around 1.88.
A typical flag consolidation after a sharp rally: the flag is narrowing, and RSI is at 51—right in the middle.
The upper boundary to watch is 1.92. It’ll only count as an upside breakout if the price holds above it.
The lower boundary is 1.68. If it breaks below that, the rally will have lost steam, and it’ll need to look for support around 1.55.
After hitting 1.42 on October 30, it climbed in a V-shape, reaching 1.92 on November 2—a 35% gain in three days.
Then it stopped pushing higher and started moving sideways in the 1.68–1.92 range.
It made another run at 1.91 this morning, but couldn’t hold there and is now back around 1.88.
A typical flag consolidation after a sharp rally: the flag is narrowing, and RSI is at 51—right in the middle.
The upper boundary to watch is 1.92. It’ll only count as an upside breakout if the price holds above it.
The lower boundary is 1.68. If it breaks below that, the rally will have lost steam, and it’ll need to look for support around 1.55.