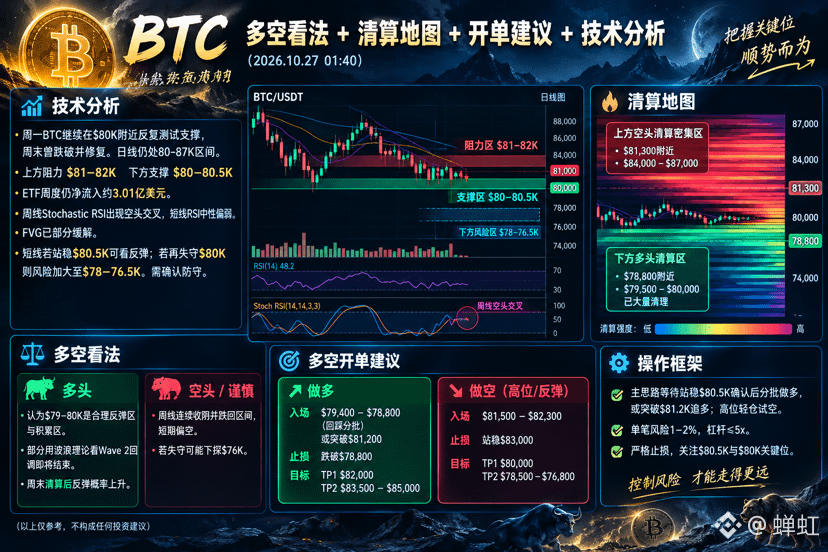
$BTC Long/Short Outlook + Liquidation Map + Trade Entry Suggestions + Technical Analysis (2026.10.27 01:50)
Technical Analysis: On Monday, BTC continued to repeatedly test support near $80K after dipping below it over the weekend and recovering. The daily chart remains within the $80–87K range. Resistance is at $81–82K, with support at $80–80.5K. Weekly ETF flows remain net positive at around $301 million. The weekly Stochastic RSI has formed a bearish crossover, while the short-term RSI is neutral to weak. The FVG has partially filled. If BTC holds above $80.5K in the short term, a rebound is possible; if it loses $80K again, the risk of a drop to $78–76.5K increases. Confirmation of support is needed.
Long/Short Outlook: Bullish view: $79–80K is considered a reasonable rebound and accumulation zone. Some wave-theory analysts see the Wave 2 pullback nearing its end, with the likelihood of a rebound rising after the weekend's liquidations. Bearish/Cautious view: Consecutive weekly closes lower and a drop back into the range point to short-term weakness; if support breaks, BTC may fall toward $76K.
Key Points from the Liquidation Map: Dense short liquidation zone above: around $81,300 and $84,000–$87,000. Long liquidation zones below: around $78,800; much of the liquidity at $79,500–$80,000 has already been cleared.
Long/Short Trade Entry Suggestions:
Long: Entry at $79,400–$78,800 (scale in on a retest) or on a breakout above $81,200. Stop-loss: below $78,800. Targets: TP1 $82,000; TP2 $83,500–$85,000.
Short (at higher levels/on a rebound): Entry at $81,500–$82,300. Stop-loss: once price holds above $83,000. Targets: TP1 $80,000; TP2 $78,500–$76,800.
Trading Plan: The main approach is to wait for confirmation that price holds above $80.5K, then enter longs in stages, or go long on a breakout above $81.2K. Consider a small short position at higher levels. Risk 1–2% per trade, with leverage of no more than 5x. Use strict stop-losses and watch the key levels at $80.5K and $80K.
(For reference only; not investment advice.)