At Friday’s close on October 23, the Dow fell 1.23% (-652.82 points) to 52215.16.
The S&P 500 fell 0.52% to 7623.68, and the Nasdaq fell 0.21% to 25955.34 (Anadolu).
The indexes were down only half a point, but sectors went their separate ways.
The VIX rose 2.21% to 19.45.
The S&P 500 Energy sector rose 2.5%, setting a record high. AT&T fell 7.96% and T-Mobile fell 7.71%, as capital priced in the narrative of SpaceX building its own network as an alternative.
American Express fell 3.62%. On the same day, it announced global layoffs of about 5%, even as both revenue and profit rose in Q3.
A risk-off market sees everything fall, the VIX spike, and the dollar and gold rise together. Friday didn’t look like that; it was a market shaped by a combination of cost shocks and industrial substitution.
Brent closed at $116.72 (October 23 settlement, AJU Press). Oil prices are passing costs on to consumers and industry; American Express’s 5% layoffs are the micro-level version.
Another theme is substitution, from AI infrastructure to communications, with the discounting horizon for telecom operators’ market share pushed out a decade.
The real tail risk isn’t equity-index volatility, but oil prices and long-term interest rates.
The 10-year U.S. Treasury yield was 4.99% (up 3.7 bps Friday), while interest-rate swaps implied about a 90% chance of another rate hike this year (as cited by Livemint).
Friday already showed stocks, bonds, and gold falling together. If Brent gaps higher, both stocks and bonds will come under pressure.
The playbook is already there. In 1973–74, oil prices rose from about $2.90 to $11.65 (January 1974).
U.S. CPI rose about 11–12% in 1974.
The S&P 500 fell from 120.24 to 62.28, a decline of 48%.
The period ran from January 1973 to October 1974.
The federal funds rate was pushed toward about 12%.
From oil to CPI to tightening to a double hit: it took two years.
1990–91 showed the other side: a retreat in the war premium doesn’t mean the risk has disappeared.
U.S. stocks fell and then rose from 1990 Q3 to 1991 Q1.
The recession (July 1990 to March 1991) began almost in sync with the invasion.
Brent hit $147.50 in July 2008, then fell into the $40 range six months later.
Oil’s peak can be determined by demand.
This week’s calendar is packed: the FOMC meets October 27–28, with markets pricing in no change and about a 15% chance of an October rate hike.
Microsoft, Google, and Amazon earnings are also due this week, along with Israel’s election on October 27 and Q3 GDP and September PCE on October 29.
All of these events share one constraint: oil prices cannot be allowed to spiral out of control ahead of the election. The first Russian diesel ship is expected to arrive in New York on November 7, with the goal of pushing diesel prices down (Reuters).
The counterpoint: one-day sector divergence may be noise, and the Energy sector’s record high is supported by supply disruptions.
The effects of substitution play out over years: Citi estimates that coverage will be built out in 3–5 years, with market share approaching 20% in about a decade.
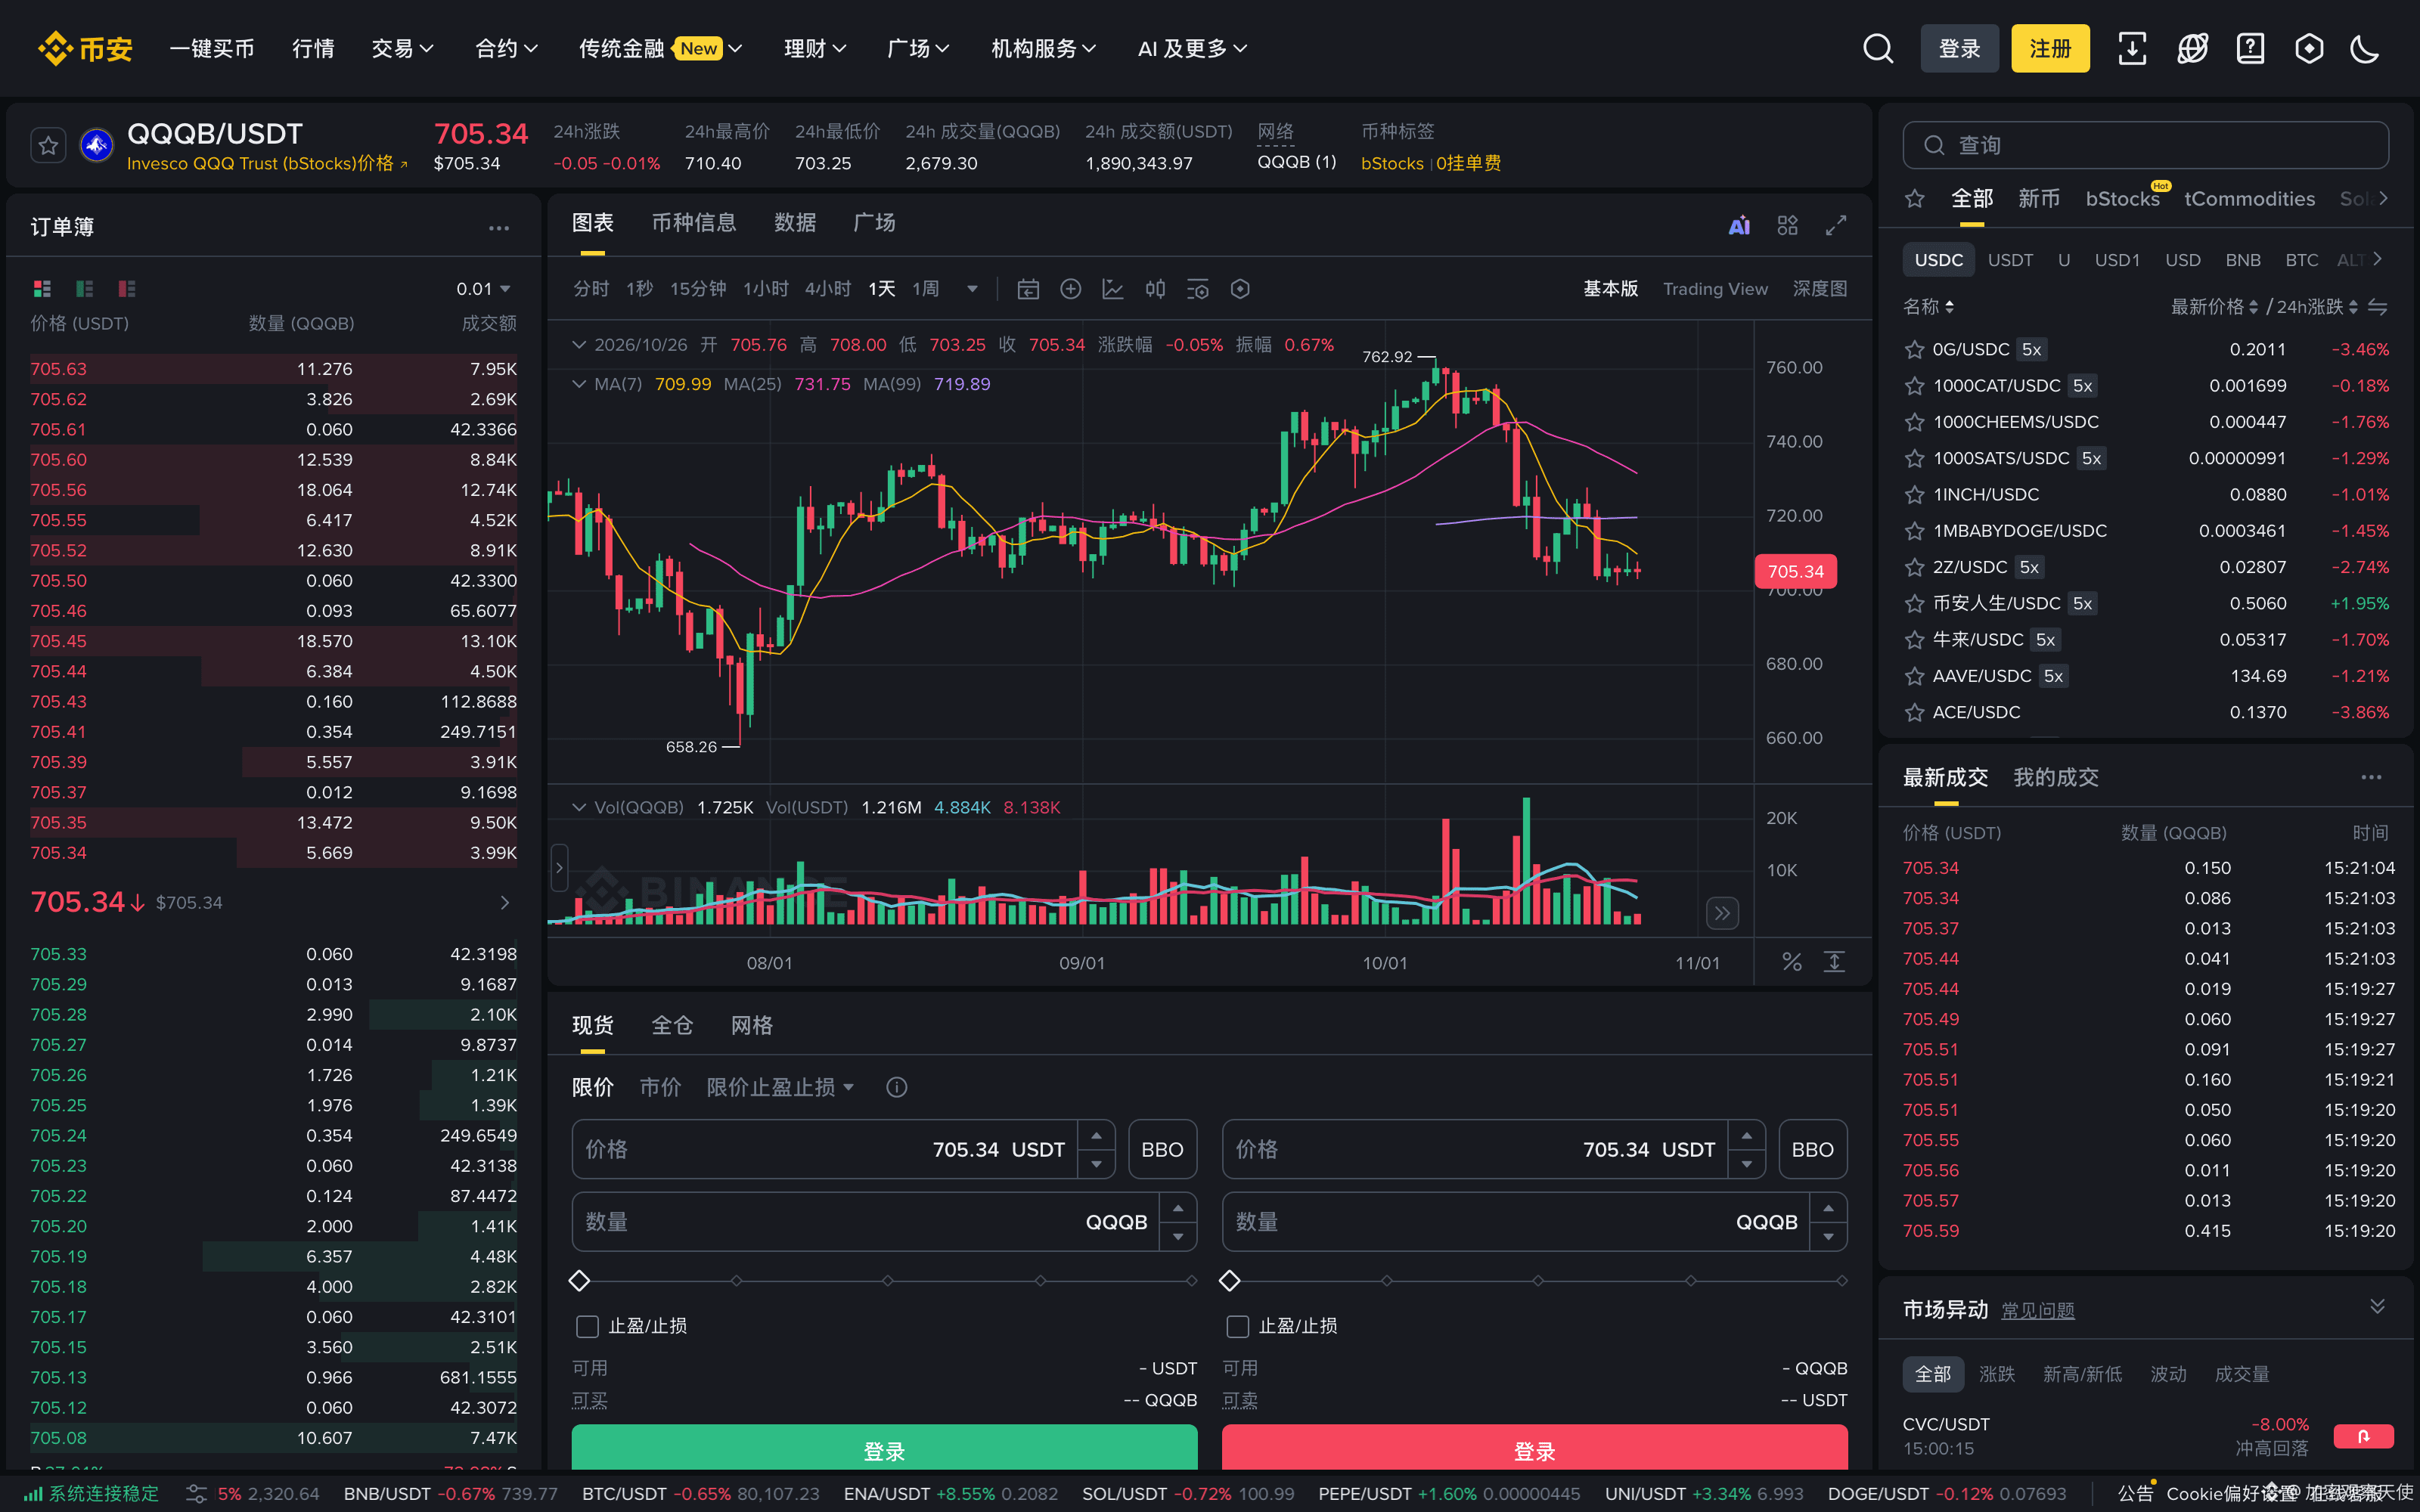
With both trends being priced in at once, how much information is left in the #美股 index behind $QQQB ?
Oil prices drive #能源 and #Stagflation; interest rates drive #TheFed.
Which number will you watch first?
Data: Index and individual-stock moves are for the October 23 U.S. market close (Anadolu; telecom stocks cross-checked against Reuters/MarketScreener); Brent/WTI are October 23 settlement prices (AJU Press).
The 10-year yield and probability of another rate hike this year are based on interest-rate swap pricing, as cited by Livemint (October 23).
QQQB is a Binance spot snapshot from 2026-10-26 15:21 CST (priced in USDT; tokenized stock; daily figures use UTC; not a USD price). Historical figures have all been checked against their original sources. This article is an observation of market structure, does not forecast the direction of indexes or oil prices, and is not investment advice.