$SUI $NEAR 📉 NEAR/USDT: Pulling Back to EMA Support – What's Next?
Body:
NEAR Protocol is currently undergoing a correction, trading at 4.690, down about 7.03% in the last 24 hours.
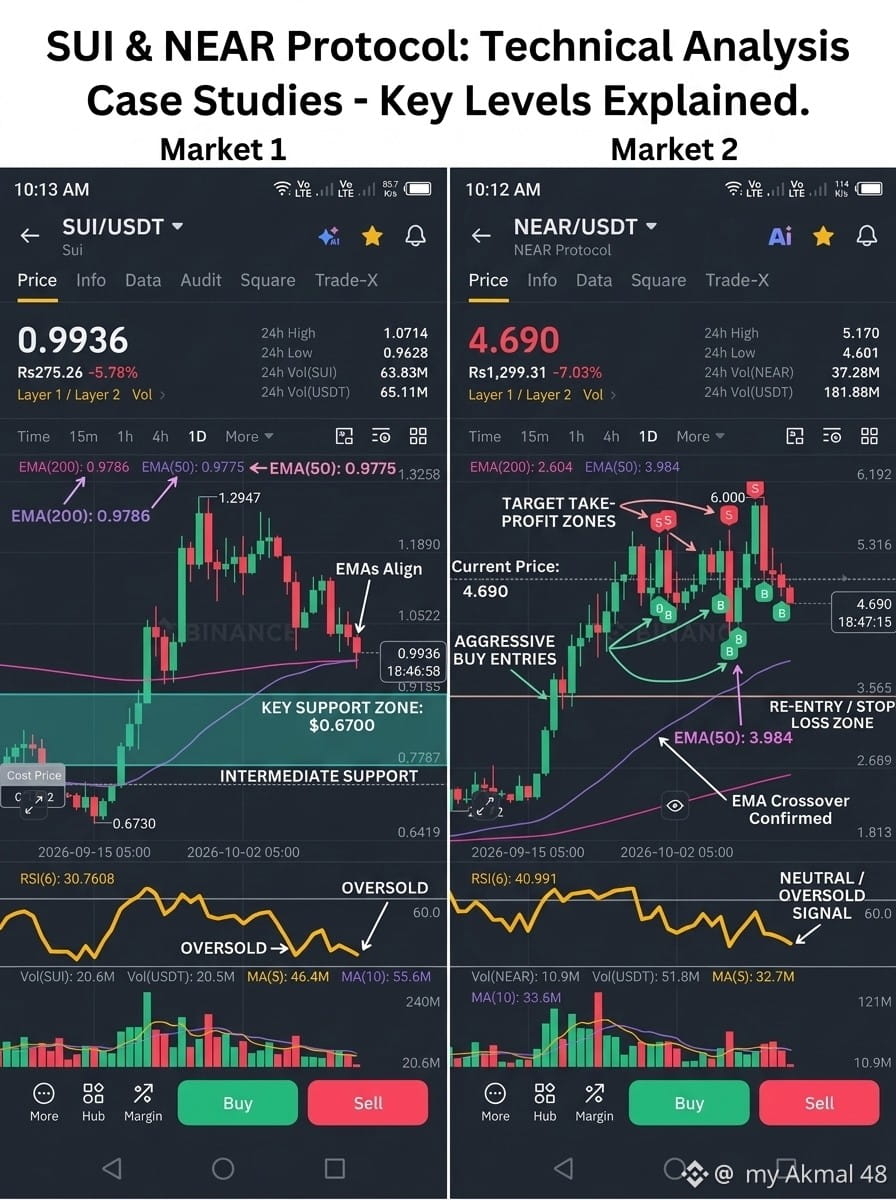
On the daily (1D) chart, the price is retracing after hitting a recent peak near 6.000. It is currently sitting above its EMA(200) at 2.604 and moving closer to the EMA(50) at 3.984. The RSI(6) is currently at 40.99, showing a cooling-down phase from the previous bullish momentum.
The trade indicators show a clear history of buying (B) and selling (S) zones. If NEAR stabilizes around the current levels, it could build a base for the next upward move. Watch out for a reversal signal before entering!
Are you holding or waiting for a deeper dip? Share your strategy below! 🚀
Hashtags: #NEAR #NearProtocol #CryptoTrading
SUI/USDT Analysis Article
Title: 📈 SUI/USDT: Testing Key Support – Time to Buy the Dip?
Body:
SUI is currently facing a short-term pullback, trading around 0.9936 with a 24-hour decline of over 5%.
Looking at the 1D chart, the price is testing a crucial support zone near the EMA(50) line (around 0.9775). The RSI(6) has dropped significantly to 30.76, indicating that the asset is entering the oversold territory.
If SUI manages to hold this EMA(50) support, we could see a strong bounce back towards the recent high of 1.2947. However, a break below this line might push the price down to test lower supports. Keep a close eye on the volume!
What are your thoughts? Is SUI preparing for a massive bounce? Let me know in the comments! 👇
Hashtags: #SUI #CryptoAnalysis #BinanceSquare #TradingSignals
Body:
NEAR Protocol is currently undergoing a correction, trading at 4.690, down about 7.03% in the last 24 hours.
On the daily (1D) chart, the price is retracing after hitting a recent peak near 6.000. It is currently sitting above its EMA(200) at 2.604 and moving closer to the EMA(50) at 3.984. The RSI(6) is currently at 40.99, showing a cooling-down phase from the previous bullish momentum.
The trade indicators show a clear history of buying (B) and selling (S) zones. If NEAR stabilizes around the current levels, it could build a base for the next upward move. Watch out for a reversal signal before entering!
Are you holding or waiting for a deeper dip? Share your strategy below! 🚀
Hashtags: #NEAR #NearProtocol #CryptoTrading
SUI/USDT Analysis Article
Title: 📈 SUI/USDT: Testing Key Support – Time to Buy the Dip?
Body:
SUI is currently facing a short-term pullback, trading around 0.9936 with a 24-hour decline of over 5%.
Looking at the 1D chart, the price is testing a crucial support zone near the EMA(50) line (around 0.9775). The RSI(6) has dropped significantly to 30.76, indicating that the asset is entering the oversold territory.
If SUI manages to hold this EMA(50) support, we could see a strong bounce back towards the recent high of 1.2947. However, a break below this line might push the price down to test lower supports. Keep a close eye on the volume!
What are your thoughts? Is SUI preparing for a massive bounce? Let me know in the comments! 👇
Hashtags: #SUI #CryptoAnalysis #BinanceSquare #TradingSignals