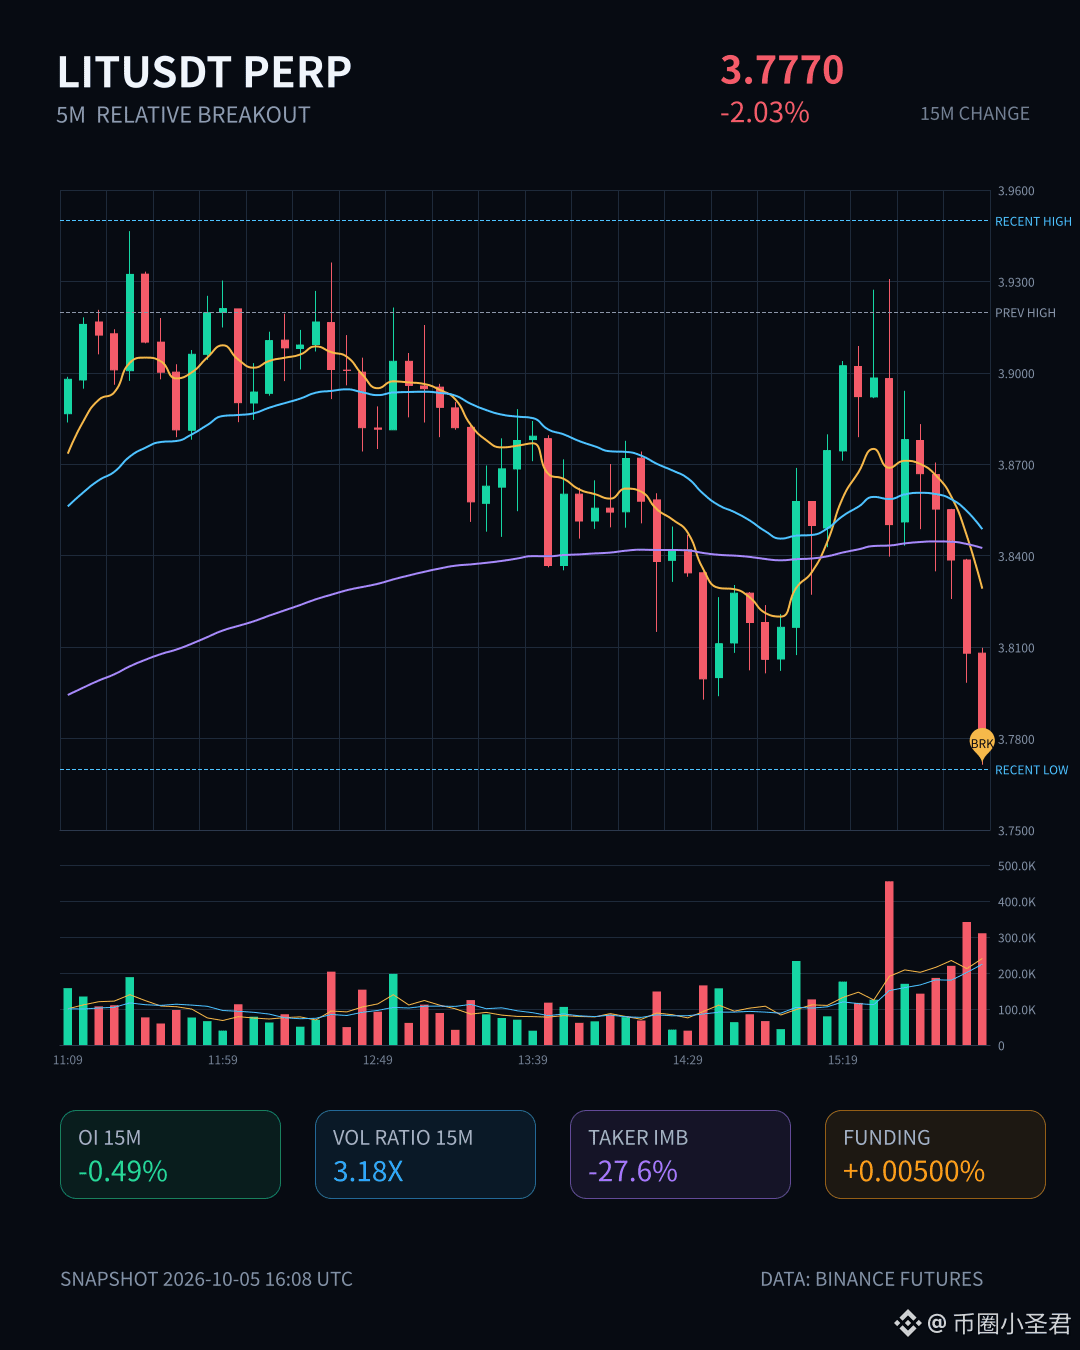
$LIT This drop wasn’t especially sharp, but the structure looks pretty ugly.
Down 2 points over 15m, with volume surging to 3.18x, while OI fell at the same time—it wasn’t driven by new shorts piling in; it looks more like longs capitulating in a cascade of stop-losses.
The aggressive trade delta was -27.6%, and the buy/sell ratio was 0.57, with selling pressure clearly skewed to one side. The close also broke below the lower bound of the range from the last 20 5m candles. Once that level breaks, short-term sentiment can easily follow.
The OI anomaly percentile is 99.8%, ranking second across the entire pool, and the notional change is also in the top five. 24h trading volume is 63M, so liquidity isn’t bad—this wasn’t just a minor move.
Price down + OI down = deleveraging. Shorts aren’t adding; longs are exiting. With this kind of structure, don’t rush to buy the dip—wait for OI to stabilize first.
Down 2 points over 15m, with volume surging to 3.18x, while OI fell at the same time—it wasn’t driven by new shorts piling in; it looks more like longs capitulating in a cascade of stop-losses.
The aggressive trade delta was -27.6%, and the buy/sell ratio was 0.57, with selling pressure clearly skewed to one side. The close also broke below the lower bound of the range from the last 20 5m candles. Once that level breaks, short-term sentiment can easily follow.
The OI anomaly percentile is 99.8%, ranking second across the entire pool, and the notional change is also in the top five. 24h trading volume is 63M, so liquidity isn’t bad—this wasn’t just a minor move.
Price down + OI down = deleveraging. Shorts aren’t adding; longs are exiting. With this kind of structure, don’t rush to buy the dip—wait for OI to stabilize first.