$BTC Coin-Circle Academicians: BTC’s 9.29 Big-Cycle Bullish Trend Provides Support—Do Short-Term Pullbacks Hide Trading Opportunities?
Bitcoin’s current price is 83,000. The hardest part of trading is not judging direction, but keeping your hands to yourself. In a ranging market, the biggest taboo is opening positions too frequently. Every entry must come with a clear exit plan. The big-cycle uptrend is still intact, but deep pullbacks can happen at any time when price is high—don’t blindly chase. Opportunities are something you wait for.
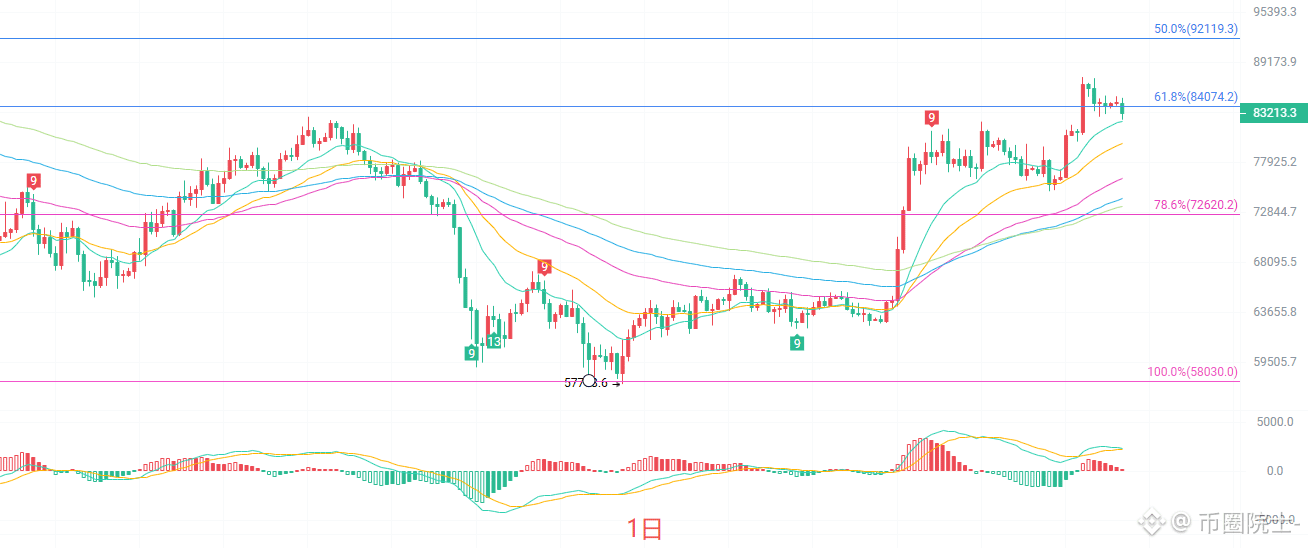
On the daily (D) chart, price retraces to the support area of the short-term EMA moving averages. The EMA15 and EMA30 remain sloping upward, while the medium- to long-term moving averages keep a bullish alignment, and the overall bullish structure has not been broken. The MACD histogram’s red bars gradually shorten; DIF and DEA are still above the zero line. Bullish momentum has weakened somewhat, but has not fully turned bearish. Bollinger Band upper band is 87,998 and lower band is 73,296. The current price is above the Bollinger middle band, indicating a strong consolidation pattern. Heavy resistance sits near previous highs, while the key support is around the 80,000 level.
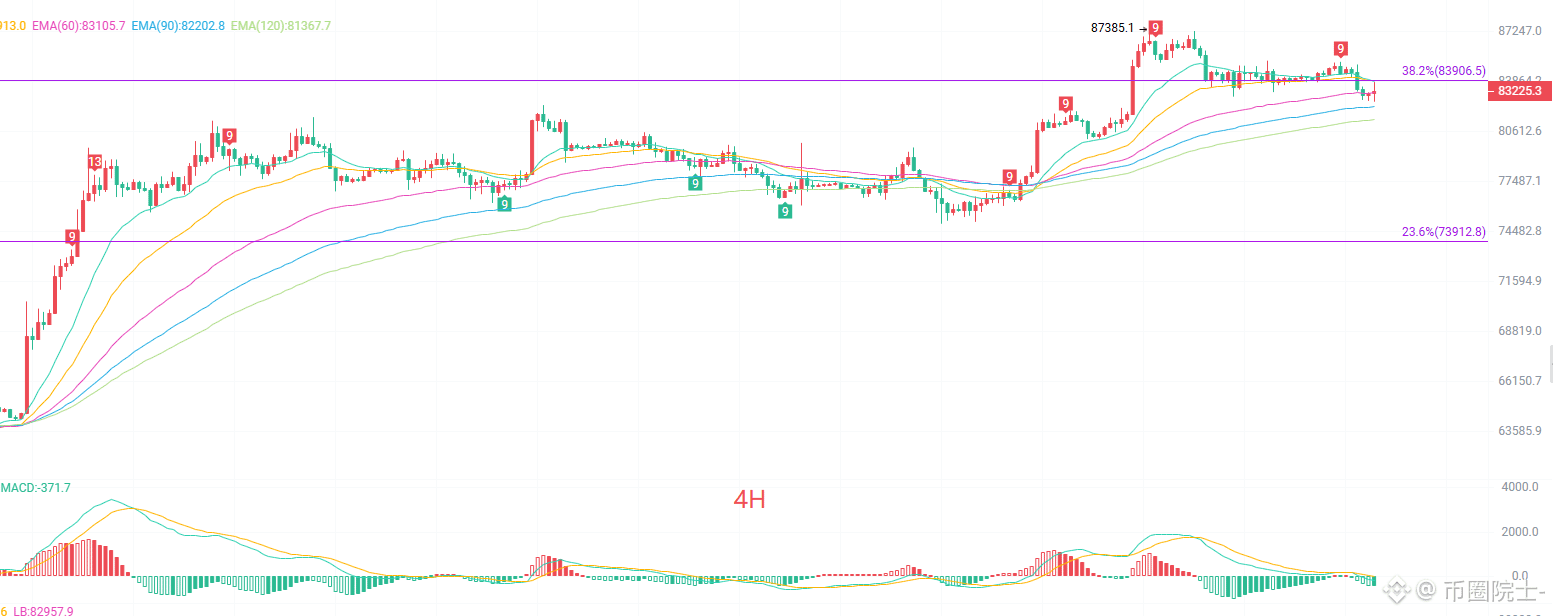
On the four-hour (4H) chart, after falling from the high at 87,385, the market is currently maintaining a range-bound consolidation. The short-term EMA moving averages are intertwined, showing intense short-term competition between bulls and bears and a lack of a clear direction. MACD continues to shrink; the green bars expand slightly. Short-term bearish force is starting to release, but medium- and long-term moving averages still provide support for the price. The Bollinger channel begins to tighten, and the volatility range is narrowing, suggesting that the market will soon choose a direction. Resistance is at 85,164, support at 82,910. Within this range, high-sell/low-buy works only for quick in-and-out short-term trades; you cannot hold positions for long periods and “tough it out.”
Short-Term Reference
On the upside: from 86,300 to 86,700 downward move—stop loss 500 points; target 85,500 to 84,500.
On the downside: from 83,500 to 83,000 upward move—stop loss 500 points; target 85,500 to 86,500.
Actual trading should be based on real-time order-book data. For more information, you can check the author’s articles. Article publication may be delayed; this is for reference only—risk is yours to bear #BTC走势分析
Bitcoin’s current price is 83,000. The hardest part of trading is not judging direction, but keeping your hands to yourself. In a ranging market, the biggest taboo is opening positions too frequently. Every entry must come with a clear exit plan. The big-cycle uptrend is still intact, but deep pullbacks can happen at any time when price is high—don’t blindly chase. Opportunities are something you wait for.
On the daily (D) chart, price retraces to the support area of the short-term EMA moving averages. The EMA15 and EMA30 remain sloping upward, while the medium- to long-term moving averages keep a bullish alignment, and the overall bullish structure has not been broken. The MACD histogram’s red bars gradually shorten; DIF and DEA are still above the zero line. Bullish momentum has weakened somewhat, but has not fully turned bearish. Bollinger Band upper band is 87,998 and lower band is 73,296. The current price is above the Bollinger middle band, indicating a strong consolidation pattern. Heavy resistance sits near previous highs, while the key support is around the 80,000 level.
On the four-hour (4H) chart, after falling from the high at 87,385, the market is currently maintaining a range-bound consolidation. The short-term EMA moving averages are intertwined, showing intense short-term competition between bulls and bears and a lack of a clear direction. MACD continues to shrink; the green bars expand slightly. Short-term bearish force is starting to release, but medium- and long-term moving averages still provide support for the price. The Bollinger channel begins to tighten, and the volatility range is narrowing, suggesting that the market will soon choose a direction. Resistance is at 85,164, support at 82,910. Within this range, high-sell/low-buy works only for quick in-and-out short-term trades; you cannot hold positions for long periods and “tough it out.”
Short-Term Reference
On the upside: from 86,300 to 86,700 downward move—stop loss 500 points; target 85,500 to 84,500.
On the downside: from 83,500 to 83,000 upward move—stop loss 500 points; target 85,500 to 86,500.
Actual trading should be based on real-time order-book data. For more information, you can check the author’s articles. Article publication may be delayed; this is for reference only—risk is yours to bear #BTC走势分析