Preparing Long BTC: The Levels I’m Watching
$BTC /USDT · 🟢 Bias: LONG (conservative) · 6/12 matching signals
Technical View: Conservative LONG. 6 out of 12 matching signals, 2 against.
What supports it (6):
✅ 1-hour direction: Price > EMA50 > EMA200, an uptrend structure is forming
✅ Trend strength (ADX/DI, 15 minutes): ADX 21.4 with buyers in control (DI+ 18.6 vs DI- 12.8)
✅ RSI on 4 hours: 56.8, bullish momentum (above 55)
✅ RSI on 1 hour: 58.2, bullish momentum (above 55)
✅ Relative strength vs BTC: Not applicable (base pair)
✅ Volume: Stable on green candles, suggesting accumulation
What opposes it (2):
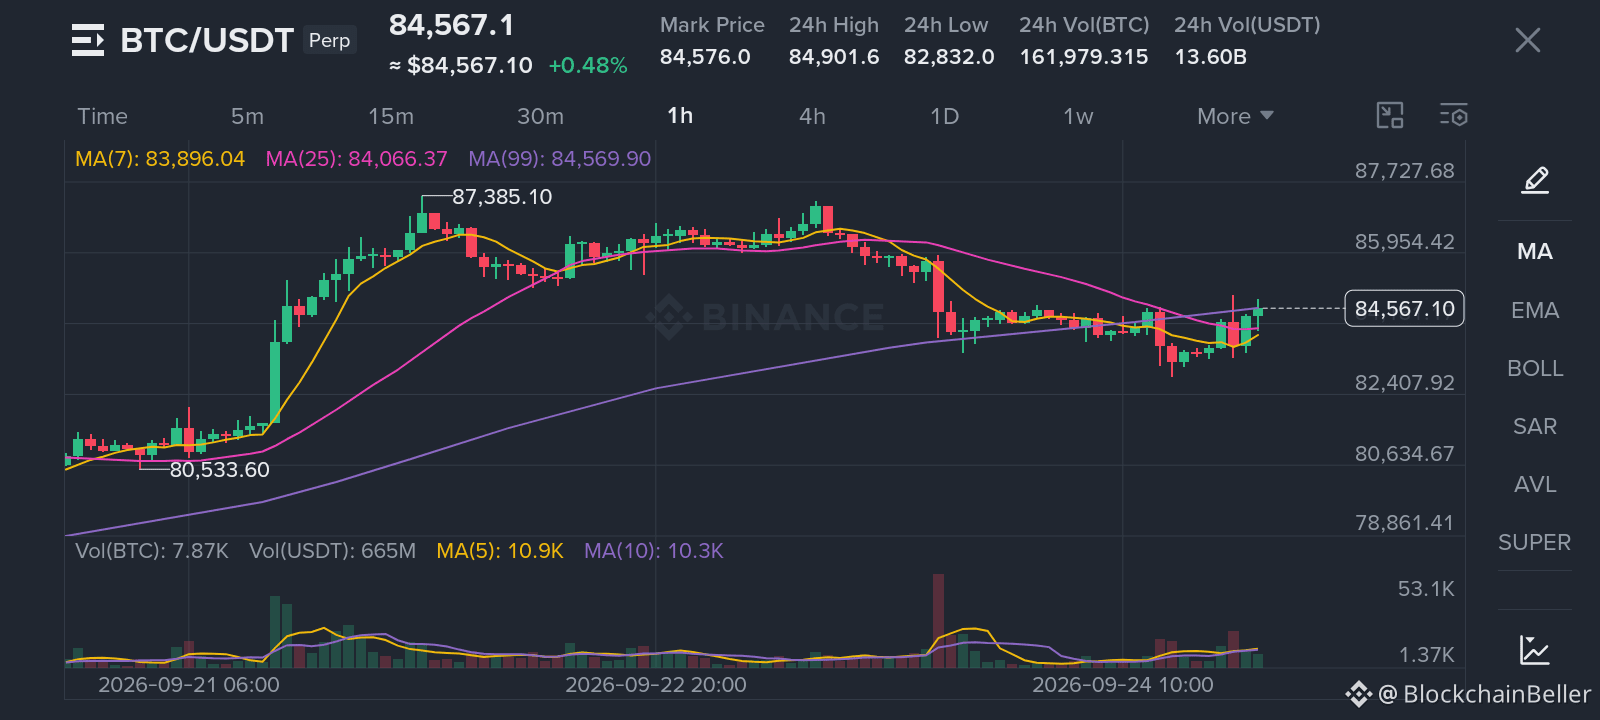
⚠️ Resistance at 87,385: The previous top is still acting as a ceiling
⚠️ RSI is extreme within the range: z-score +1.8 in range, risk of pullback from the top
Price Map:
📍 Entry: 84,000 – 84,500
🎯 Target 1: 85,500
🎯 Target 2: 86,500
🎯 Target 3: 87,500
🔴 Stop Loss: 82,500
Why this setup?
The daily trend is bullish, and 6 out of 12 matching signals favor the long side. The plan is to work within 84,000 – 84,500, take profits at 85,500 and 86,500, and wait patiently until 87,500. A move through 82,500 means the idea was wrong, and the stop will do its job.
The decision is yours:
Will BTC hit 85,500 first, or will it hit the stop loss?
Levels are shown on the chart below 👇
⚠️ Personal market analysis only. Not financial advice — manage risk and do your own research.
$BTC /USDT · 🟢 Bias: LONG (conservative) · 6/12 matching signals
Technical View: Conservative LONG. 6 out of 12 matching signals, 2 against.
What supports it (6):
✅ 1-hour direction: Price > EMA50 > EMA200, an uptrend structure is forming
✅ Trend strength (ADX/DI, 15 minutes): ADX 21.4 with buyers in control (DI+ 18.6 vs DI- 12.8)
✅ RSI on 4 hours: 56.8, bullish momentum (above 55)
✅ RSI on 1 hour: 58.2, bullish momentum (above 55)
✅ Relative strength vs BTC: Not applicable (base pair)
✅ Volume: Stable on green candles, suggesting accumulation
What opposes it (2):
⚠️ Resistance at 87,385: The previous top is still acting as a ceiling
⚠️ RSI is extreme within the range: z-score +1.8 in range, risk of pullback from the top
Price Map:
📍 Entry: 84,000 – 84,500
🎯 Target 1: 85,500
🎯 Target 2: 86,500
🎯 Target 3: 87,500
🔴 Stop Loss: 82,500
Why this setup?
The daily trend is bullish, and 6 out of 12 matching signals favor the long side. The plan is to work within 84,000 – 84,500, take profits at 85,500 and 86,500, and wait patiently until 87,500. A move through 82,500 means the idea was wrong, and the stop will do its job.
The decision is yours:
Will BTC hit 85,500 first, or will it hit the stop loss?
Levels are shown on the chart below 👇
⚠️ Personal market analysis only. Not financial advice — manage risk and do your own research.