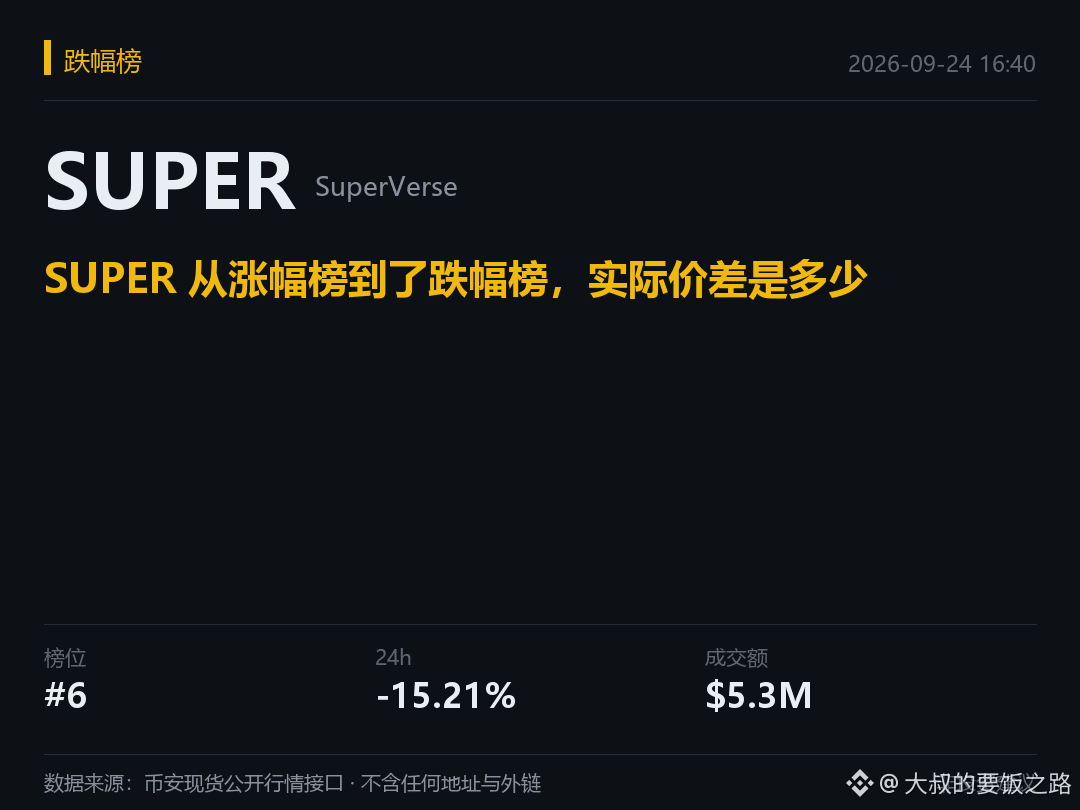
SUPER moved from the gainers list to the losers list—what’s the actual price difference?
The same $SUPER was on the gainers list in the morning, but ended up on the losers list in the afternoon. The two percentage figures look far apart, but they’re actually comparing two different time periods.
The snapshot price at 06:09:36 in the morning was 0.1798 USDT, with a rolling 24-hour gain of 14.30%. For the snapshot in the afternoon, the price was 0.1721 USDT, with a rolling 24-hour loss of 12.64%, and the SUPER/USDT trading volume was about 6.4659 million USDT.
Put the two snapshot prices side by side—the change during that period is about -4.28%. If you subtract the two “up/down” readings, you get a difference of 26.94 percentage points, but that’s not the actual drop from morning to afternoon. The rolling window keeps moving forward, so the starting point for comparison is also changing. Even if the percentage looks the same, the denominator and the time range behind it are different.
Now look at the project itself. The SuperVerse website currently lists two directions: game integration and a liquidity protocol. BlackHole is its first liquidity protocol. The official integration page says it runs on Avalanche, and part of the fees are used to support SUPER buybacks. What we can confirm here is the business and mechanism description—there’s no transaction-by-transaction buyback ledger, so you can’t specify the exact buyback amount or call it “bottom support.”
These project materials can explain what SUPER is doing, but I don’t think they can pin down the reason for today’s price movement. In this before-and-after comparison, the only directly computable figure is roughly a 4.28% price difference. The red/green colors on those two lists each reflect their own past 24 hours.
Can the two rolling 24-hour readings be subtracted directly? Has this pitfall tripped you up?
This article is compiled from publicly available information and represents personal opinions only; it does not constitute any investment advice. Trading pair volume is not equal to net capital inflow or outflow.
The same $SUPER was on the gainers list in the morning, but ended up on the losers list in the afternoon. The two percentage figures look far apart, but they’re actually comparing two different time periods.
The snapshot price at 06:09:36 in the morning was 0.1798 USDT, with a rolling 24-hour gain of 14.30%. For the snapshot in the afternoon, the price was 0.1721 USDT, with a rolling 24-hour loss of 12.64%, and the SUPER/USDT trading volume was about 6.4659 million USDT.
Put the two snapshot prices side by side—the change during that period is about -4.28%. If you subtract the two “up/down” readings, you get a difference of 26.94 percentage points, but that’s not the actual drop from morning to afternoon. The rolling window keeps moving forward, so the starting point for comparison is also changing. Even if the percentage looks the same, the denominator and the time range behind it are different.
Now look at the project itself. The SuperVerse website currently lists two directions: game integration and a liquidity protocol. BlackHole is its first liquidity protocol. The official integration page says it runs on Avalanche, and part of the fees are used to support SUPER buybacks. What we can confirm here is the business and mechanism description—there’s no transaction-by-transaction buyback ledger, so you can’t specify the exact buyback amount or call it “bottom support.”
These project materials can explain what SUPER is doing, but I don’t think they can pin down the reason for today’s price movement. In this before-and-after comparison, the only directly computable figure is roughly a 4.28% price difference. The red/green colors on those two lists each reflect their own past 24 hours.
Can the two rolling 24-hour readings be subtracted directly? Has this pitfall tripped you up?
This article is compiled from publicly available information and represents personal opinions only; it does not constitute any investment advice. Trading pair volume is not equal to net capital inflow or outflow.