

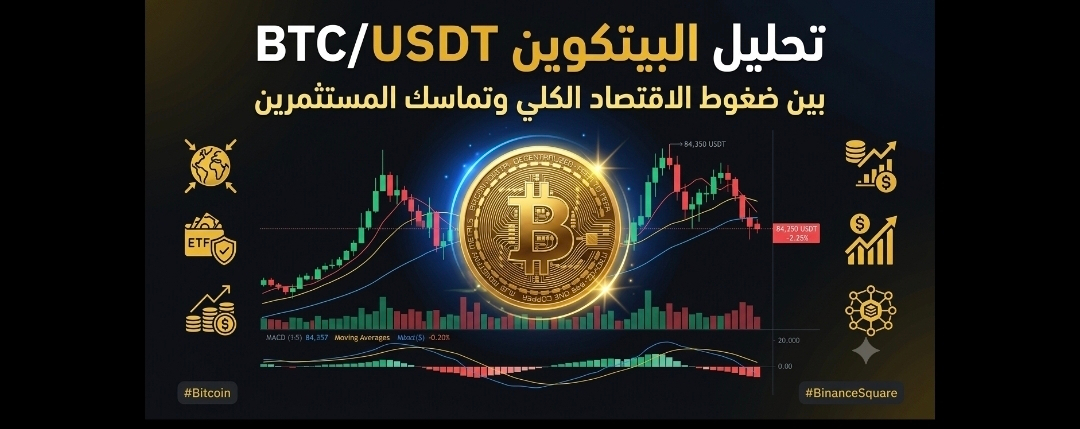

Bitcoin (BTC/USDT) analysis: between macroeconomic pressures and investor consolidation — where is the price headed?
Note: The data and figures in this analysis are compiled according to the latest update of market and network data as of 24 September 2026.
Bitcoin’s ( $BTC ) has recently seen a pullback toward the $84,000–$84,350 area, at a time when markets are becoming increasingly sensitive to developments in yields, energy, and global liquidity. This move alone is not enough to confirm the start of a new trend; it may instead reflect a broader correction or a consolidation phase within a volatile range. Therefore, this analysis reviews economic and technical indicators as well as network data to assess possible scenarios, while emphasizing that outcomes are not guaranteed and that risk management remains a key element.
To understand the bigger picture and assess possible scenarios, let’s review the available data together. 👇
📉 1. Macroeconomy and the behavior of large traders
Yield and energy pressures: The recent rise in U.S. Treasury bond yields and the increase in oil prices above $100 increase investors’ caution toward high-risk assets. However, the impact of these factors is not constant—it changes and is continuously influenced by inflation data, interest-rate expectations, and global risk appetite.
Short-term liquidity flows: Data from the market issued over the past 24 hours (up to September 24, 2026) indicates net outflows of -3,014 BTC, with limited sell pressure from large traders (whales) totaling -827 BTC. In addition, moving 600 BTC from an inactive wallet that has been idle for 14.2 years triggered caution and momentary volatility—factors that could raise short-term market volatility without being sufficient on their own to determine the next direction.
Ongoing institutional follow-through: Stability in some investors’ holdings of Bitcoin ETF products (based on Bitwise’s latest mid-September 2026 data) may reflect continued interest and a long-term commitment to Bitcoin. However, these data should be handled with caution, because fund flows can change quickly depending on market conditions and overall liquidity.
📊 2. Network data: what do the indicators say?
Network activity and falling transactions: Core data up to September 2026 indicates a decline in the total number of network transactions to 15.4M and a drop in daily active addresses to 444.4K. This decline may sometimes coincide with periods of price consolidation and brief calm, but by itself it does not prove that the market is in a clear accumulation phase; it may also be related to a broader drop in overall activity, higher fees, or a shift of part of usage activity to Layer 2 networks and other scaling solutions that do not show directly on the main chain.
Ecosystem and liquidity: The total value across the Bitcoin ecosystem (GMV) rose to $505M in September versus $398M in June 2026, which is a positive sign indicating a wider asset base and liquidity within the ecosystem. Still, it’s necessary to monitor and interpret these indicators precisely because calculation methods may differ from one platform to another.
🎯 3. Technical read and monitoring zones
The price is currently moving near technically crucial support zones, making the interaction between buyers and sellers there especially important for the next phase:
🟢 Key Support zones (Support):
84,000$– 84,300$: a short-term support zone worth close monitoring, especially if attempts to defend it coincide with a tangible improvement in trading volume.
82,400$: a lower technical level (the MA-7 daily moving average support) that may become highly significant if selling pressure increases. Staying above it supports the consolidation scenario, while losing it may increase the market’s sensitivity to broader volatility.
🔴 Resistance zones (Resistance):
85,500$: breaking above it requires monitoring trading volume and liquidity (not price alone); an upside move without clear participation from volume may remain prone to rapid whipsaws.
87,200$: the previous peak and the key to clearly returning to an uptrend.
🧭 Practical framework for risk management and building an educational trading plan
Alert: The examples and price levels below are hypothetical estimates based on a quick technical and historical read; they are not financial advice or a direct call to buy or sell.
⚡ 1. For traders and small-volume traders (fast, intraday moves):
Default buy (for example): monitor price behavior around the 84,000$– 84,200$ support zones. If intraday bounce signals appear, swing traders may target 84,800$ then 85,300$, with an assumed stop-loss activated on a break of 83,750$ (15-minute candle close) to avoid rapid slippage.
Default sell (for example): if failing to break 85,300$– 85,500$ with weak trading volume, the trader may aim for 84,500$ and 84,100$, with an assumed stop-loss activated above 85,800$ (1-hour candle close).
📈 2. For medium-term traders (futures and margin):
Default buy framework: Build buy scenarios either on a confirmed bounce from the 84,000$ zone, or after a real breakout and holding above 85,500$, supported by clear trading volume (Volume), targeting 86,500$ then 87,200$. The default stop-loss would be a 4-hour candle close below 83,500$ (with the importance of reducing leverage due to volatility).
Default sell framework: If the 83,800$ level is broken with a strong 4-hour candle, or if reversal behavior appears below the 85,500$ resistance, traders target 83,000$ first, then the daily support at 82,400$, with an assumed stop-loss above 85,900$.
💎 3. For investors and spot traders (long-term - DCA):
Progressive accumulation strategy: In the face of liquidity fluctuations, investors rely on splitting capital into installments (DCA method) rather than entering all at once:
The first installment at current levels 84,000$– 84,350$.
The second installment at the daily technical support level of 82,400$.
The reserve installment in case of a deeper pullback toward the 79,000$– 80,000$ zones.
Assumed distant targets: the 90,000$ zone, then 95,000$ and above in the medium and long term. The overall trend remains positive as long as the price holds the upward structure above the historical weekly support at 74,900$.
✍️ Risk management summary:
passing through $BTC In a phase where macroeconomic pressures overlap with investors’ monitoring of liquidity inflows and institutional behavior. Current support zones are important, but the outcome is not determined by a single indicator or a single day’s move.
The best approach is always to track global economic data, ETF product flows, trading volume, and how price responds around support and resistance zones. Remember that digital asset markets are highly volatile and their inputs can change quickly; therefore, it’s very important to manage risk based on your own research, goals, and your ability to withstand volatility—without relying on analysis as ready-made instructions.
This analysis is for educational and informational purposes only and does not represent direct investment or financial advice.
#TechnicalAnalysis_Tickeron #cryptouniverseofficial #BinanceSquare $BTC