

📊 BCH/USDT Technical Analysis
Bitcoin Cash (BCH) – 5M Chart
🔹 Current Price: $353.0
🔹 24H High: $354.4
🔹 24H Low: $263.8
🔹 24H Change: +33.21%
🔹 Trend: Strong bullish momentum
Technical View:
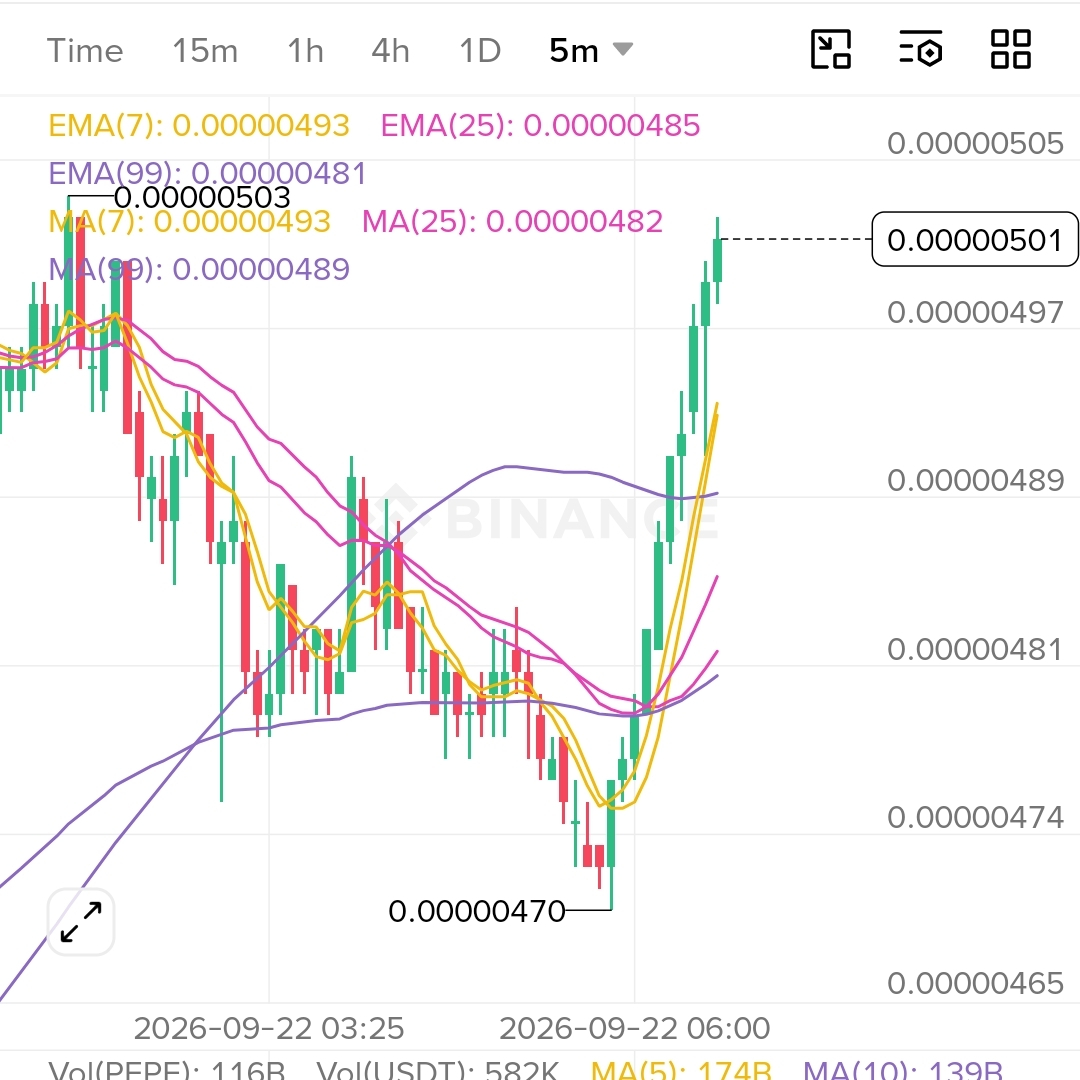
BCH has surged very strongly upward and is currently trading close to $354.4. On the 5M chart:
• EMA(7) = 345.7
• EMA(25) = 341.8
• EMA(99) = 339.4
• MA(7) = 343.8
• MA(25) = 340.5
• MA(99) = 341.2
Price is positioned above all key MA/EMA levels, indicating bullish momentum in the short term. At the same time, a large volume spike is visible.
🎯 Key Resistance:
$354.4 — current main resistance
📌 Important Support Zones:
$351–352
$347–348
$343–345
$339–341
⚠️ Market Note:
With a rise of around 33%+ in a day, volatility is much higher. If rejection occurs around the $354.4 level, a short-term pullback may happen. On the other hand, if price can strongly hold above the resistance, new price discovery could follow—however, it’s not wise to assume a breakout without confirmation.
Before trading, it’s important to check Volume + Candle Close + Support/Resistance confirmation.
#BCH #BCHUSDT #BitcoinCash #CryptoAnalysis #Binance #TechnicalAnalysis #CryptoTrading #Altcoin
This is technical analysis for educational purposes, not financial advice.
Bitcoin Cash (BCH) – 5M Chart
🔹 Current Price: $353.0
🔹 24H High: $354.4
🔹 24H Low: $263.8
🔹 24H Change: +33.21%
🔹 Trend: Strong bullish momentum
Technical View:
BCH has surged very strongly upward and is currently trading close to $354.4. On the 5M chart:
• EMA(7) = 345.7
• EMA(25) = 341.8
• EMA(99) = 339.4
• MA(7) = 343.8
• MA(25) = 340.5
• MA(99) = 341.2
Price is positioned above all key MA/EMA levels, indicating bullish momentum in the short term. At the same time, a large volume spike is visible.
🎯 Key Resistance:
$354.4 — current main resistance
📌 Important Support Zones:
$351–352
$347–348
$343–345
$339–341
⚠️ Market Note:
With a rise of around 33%+ in a day, volatility is much higher. If rejection occurs around the $354.4 level, a short-term pullback may happen. On the other hand, if price can strongly hold above the resistance, new price discovery could follow—however, it’s not wise to assume a breakout without confirmation.
Before trading, it’s important to check Volume + Candle Close + Support/Resistance confirmation.
#BCH #BCHUSDT #BitcoinCash #CryptoAnalysis #Binance #TechnicalAnalysis #CryptoTrading #Altcoin
This is technical analysis for educational purposes, not financial advice.