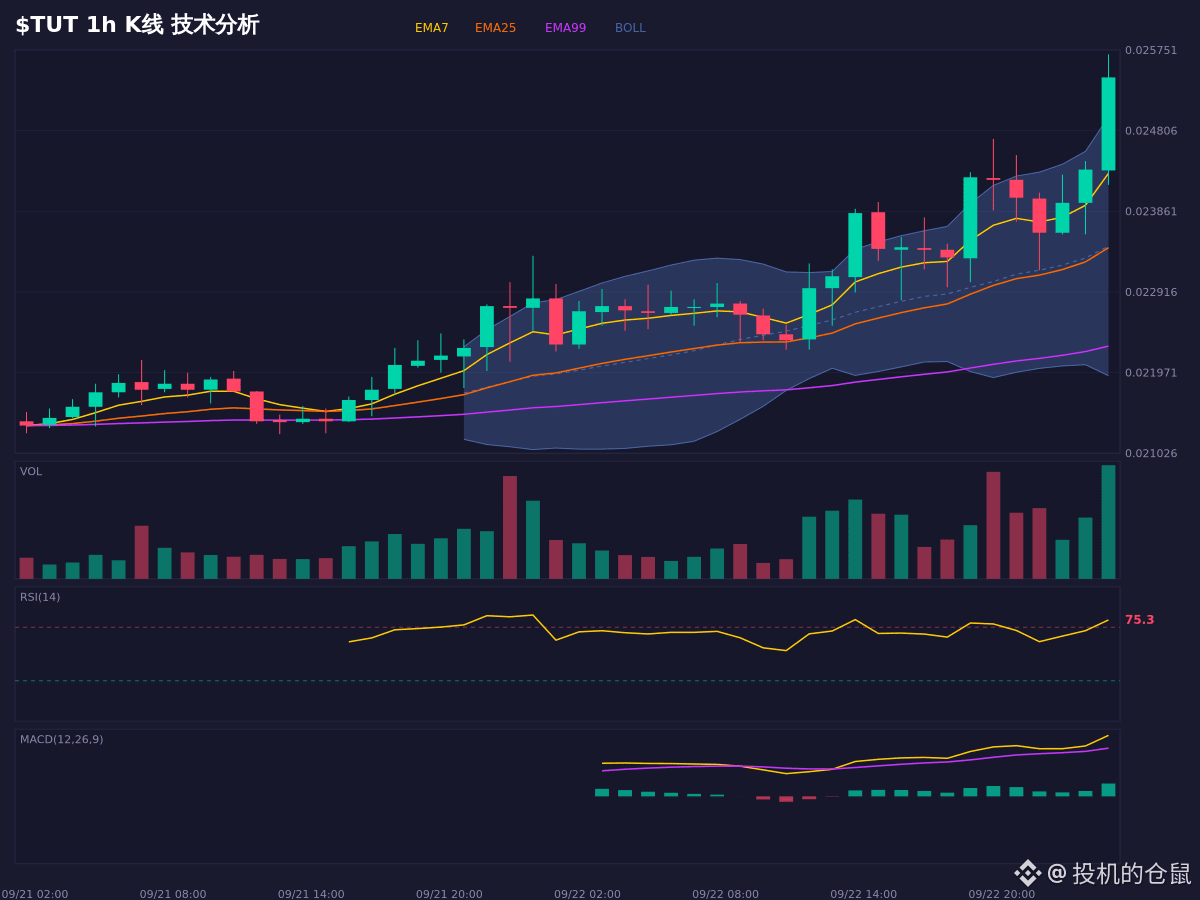
Just finished grabbing a few bites of takeout, and then took a look at $TUT . This rally is definitely fierce—the 6.8% gain is hard to miss. But after going through the details, things get a bit interesting.
The moving averages are in a bullish alignment plus the MACD histogram is expanding—this trend is genuinely strong. However, the issue is that the RSI has shot straight up to 76.2, squarely in the overbought zone. Even more contradictory: the Stoch RSI K line has crossed below the D line, and OBV suggests there are signs of capital flowing out. Doesn’t that sound like a typical “strong-will-but-nearing-the-end” signal?
The Bollinger Bands have broken above the upper band, and the price is indeed in an extreme position. This kind of move either accelerates or reverts—there’s basically no middle ground. The key is whether it can hold the support level at 0.02396.
This is only for chart observation and scenario-based reasoning, not a record of trading operations.
$TUT #市场情绪 #熊市 #Perpetual contract
The moving averages are in a bullish alignment plus the MACD histogram is expanding—this trend is genuinely strong. However, the issue is that the RSI has shot straight up to 76.2, squarely in the overbought zone. Even more contradictory: the Stoch RSI K line has crossed below the D line, and OBV suggests there are signs of capital flowing out. Doesn’t that sound like a typical “strong-will-but-nearing-the-end” signal?
The Bollinger Bands have broken above the upper band, and the price is indeed in an extreme position. This kind of move either accelerates or reverts—there’s basically no middle ground. The key is whether it can hold the support level at 0.02396.
This is only for chart observation and scenario-based reasoning, not a record of trading operations.
$TUT #市场情绪 #熊市 #Perpetual contract